
Recommandé
Contenu connexe
Plus de 168report
Plus de 168report (15)
Dernier
Dernier (20)
2000 2009 china pharmaceutical industry statistics
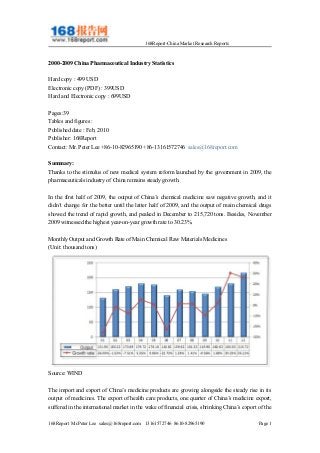
- 1. 168Report-China Market Research Reports 2000-2009 China Pharmaceutical Industry Statistics Hard copy : 499 USD Electronic copy (PDF) : 399USD Hard and Electronic copy : 699USD Pages:39 Tables and figures : Published date : Feb, 2010 Publisher: 168Report Contact: Mr. Peter Lee +86-10-82965190 +86-13161572746 sales@168report.com Summary: Thanks to the stimulus of new medical system reform launched by the government in 2009, the pharmaceuticals industry of China remains steady growth. In the first half of 2009, the output of China’s chemical medicine saw negative growth, and it didn’t change for the better until the latter half of 2009, and the output of main chemical drugs showed the trend of rapid growth, and peaked in December to 215,720 tons. Besides, November 2009 witnessed the highest year-on-year growth rate to 30.23%. Monthly Output and Growth Rate of Main Chemical Raw Materials Medicines (Unit: thousand tons) Source: WIND The import and export of China’s medicine products are growing alongside the steady rise in its output of medicines. The export of health care products, one quarter of China’s medicine export, suffered in the international market in the wake of financial crisis, shrinking China’s export of the 168Report Mr.Peter Lee sales@168report.com 13161572746 8610-82965190 Page 1
- 2. 168Report-China Market Research Reports health care products. In early 2009, China’s export of pharmaceuticals reduced from 2008 on average. In February 2009, the export volume was no more than 35,020 tons. However, China’s import of pharmaceuticals remained stable due to the expanding domestic demand. In the first half of 2009, China import volume of pharmaceutics in 1H2009 was the same as that of the year 2008. Exceptionally, a relatively year-on-year sharp drop of import occurred in March, amounting to 5,240 tons, with a year-on-year decrease of 7,600 tons. Import Volume of Antibiotics (Excluding Preparations),2008-2009 (Unit: ton) Source: WIND The financial crisis exerts negative influence on Chinese export market of pharmaceuticals. However, given that the Chinese Government has invested in medical care sector following the launch of national new medical reform policy, China’s pharmaceutical industry remains a sound development. As the recovery of international economy in 2010, this year will see a better development prospect in the pharmaceutical industry of China. Through about 70 charts and lists, this report highlights the overall operation, the output of main products, import & export situation and vitamin prices in the pharmaceuticals industry of China between 2000 and 2009. Based on the report, we will provide the latest versions of statistics by month and quarter, in an attempt to provide timely and accurate information for our clients. Table of Contents: 1. China Output of Main Pharmaceuticals 168Report Mr.Peter Lee sales@168report.com 13161572746 8610-82965190 Page 2
- 3. 168Report-China Market Research Reports 2. China Import & Export of Main Pharmaceuticals 2.1 Export 2.2 Import 3. Vitamin Price Trend in China Tables and Figures: Monthly Output and Growth Rate of Main Chemical Raw Materials Medicines,2009 Yearly Output and Growth Rate of Main Chemical Raw Materials Medicines,2000-2009 Monthly Output and Growth Rate of Main Chinese Traditional Patent Medicines,2009 Yearly Output and Growth Rate of Main Chinese Traditional Patent Medicines,2000-2009 Monthly Statistics of Pharmaceuticals Export Volume,2008-2009 Monthly Statistics of Vitamin C Export Volume,2008-2009 Monthly Statistics of Antibiotics (Excluding Preparations) Export Volume,2008-2009 Monthly Statistics of Chinese Traditional Patent Medicines Export Volume,2008-2009 Monthly Statistics of Medical Dressings Export Volume,2008-2009 Monthly Statistics of Pharmaceuticals Export Value,2008-2009 Monthly Statistics of Vitamin C Export Value,2008-2009 Monthly Statistics of Antibiotics (Excluding Preparations) Export Value,2008-2009 Monthly Statistics of Chinese Traditional Patent Medicines Export Value,2008-2009 Monthly Statistics of Medical Dressings Export Value,2008-2009 Export Volume of Pharmaceuticals, 2000-2009 Export Volume of Antibiotics (Excluding Preparations), 2000-2009 Export Volume of Chinese Traditional Patent Medicines, 2000-2009 Export Volume of Chinese Medicinal Materials, 2004-2009 Export Volume of Medical Dressings, 2000-2009 Growth Rate of Export Volume of Pharmaceuticals ,2000-2009 Growth Rate of Export Volume of Antibiotics (Excluding Preparations) ,2000-2009 Growth Rate of Export Volume of Chinese Traditional Patent Medicines, 2000-2009 Growth Rate of Export Volume of Chinese Medicinal Materials, 2003-2009 Growth Rate of Export Volume of Medical Dressings ,2000-2009 Export Value of Pharmaceuticals, 2000-2009 Export Value of Antibiotics (Excluding Preparations), 2000-2009 Export Value of Chinese Traditional Patent Medicines, 2000-2009 Export Value of Medical Dressings, 2000-2009 Growth Rate of Export Value of Pharmaceuticals,2000-2009 Growth Rate of Export Value of Antibiotics (Excluding Preparations) ,2000-2009 Growth Rate of Export Value of Chinese Traditional Patent Medicines,2000-2009 Growth Rate of Export Value of Medical Dressings ,2000-2009 Monthly Statistics of Medical Equipment and Instruments Export Value,2008-2009 Growth Rate of Export Value of Medical Equipment and Instruments ,2000-2009 168Report Mr.Peter Lee sales@168report.com 13161572746 8610-82965190 Page 3
- 4. 168Report-China Market Research Reports Monthly Statistics of Pharmaceuticals Import Volume,2008-2009 Monthly Statistics of Antibiotics (Excluding Preparations) Import Volume,2008-2009 Monthly Statistics of Antibiotics Preparations Import Volume,2008-2009 Monthly Statistics of Pharmaceuticals Import Value,2008-2009 Monthly Statistics of Antibiotics (Excluding Preparations) Import Value,2008-2009 Monthly Statistics of Antibiotics Preparations Import Value,2008-2009 Monthly Statistics of Medical Equipment and Instruments Import Value,2008-2009 Import Volume of Pharmaceuticals, 2000-2009 Import Volume of Antibiotics (Excluding Preparations), 2000-2009 Import Volume of Antibiotics Preparations, 2000-2009 Growth Rate of Import Volume of Pharmaceuticals ,2000-2009 Growth Rate of Import Volume of Antibiotics (Excluding Preparations) ,2000-2009 Growth Rate of Import Volume of Antibiotics Preparations,2000-2009 Import Value of Pharmaceuticals, 2000-2009 Import Value of Antibiotics (Excluding Preparations), 2000-2009 Import Value of Antibiotics Preparations, 2000-2009 Import Value of Medical Equipment and Instruments, 2000-2009 Growth Rate of Import Volume of Pharmaceuticals,2000-2009 Growth Rate of Import Volume of Antibiotics (Excluding Preparations),2000-2009 Growth Rate of Import Volume of Antibiotics Preparations,2000-2009 Growth Rate of Import Volume of Medical Equipment and Instruments,2000-2009 Monthly Statistics of China-made Vitamin A Unit Price,2008-2009 Monthly Statistics of Import Vitamin A Unit Price,2008-2009 Monthly Statistics of China-made Vitamin E Unit Price,2008-2009 Monthly Statistics of Import Vitamin E Unit Price,2008-2009 Monthly Statistics of China-made Vitamin D3 Unit Price,2008-2009 Monthly Statistics of China-made Choline Chloride Unit Price,2008-2009 Monthly Statistics of China-made Nicamidon Unit Price,2008-2009 Monthly Statistics of China-made Niacin Unit Price,2008-2009 Monthly Statistics of China-made Folic Acid Unit Price,2008-2009 Monthly Statistics of China-made Vitamin B1 Unit Price,2008-2009 Monthly Statistics of China-made Vitamin B2 (80%) Unit Price,2008-2009 Monthly Statistics of China-made Vitamin B6 Unit Price,2008-2009 Monthly Statistics of China-made Vitamin B12 (1% Liquid Phase) Unit Price,2008-2009 Monthly Statistics of China-made Vitamin K3 (96% MSB) Unit Price,2008-2009 Monthly Statistics of China-made Vitamin B12 (1% UV) Unit Price,2008-2009 168Report Mr.Peter Lee sales@168report.com 13161572746 8610-82965190 Page 4