
Recommandé
Recommandé
Contenu connexe
Plus de 168report
Plus de 168report (14)
Dernier
Dernier (20)
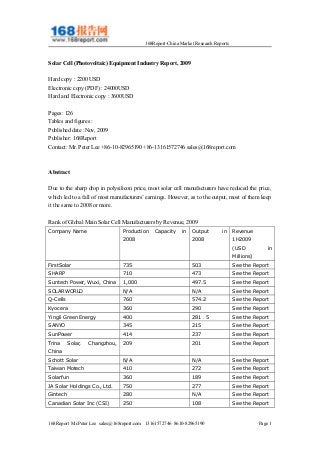
Solar cell (photovoltaic) equipment industry report, 2009
- 1. 168Report-China Market Research Reports Solar Cell (Photovoltaic) Equipment Industry Report, 2009 Hard copy : 2200 USD Electronic copy (PDF) : 24000USD Hard and Electronic copy : 3600USD Pages: 126 Tables and figures : Published date :Nov, 2009 Publisher: 168Report Contact: Mr. Peter Lee +86-10-82965190 +86-13161572746 sales@168report.com Abstract Due to the sharp drop in polysilicon price, most solar cell manufacturers have reduced the price, which led to a fall of most manufacturers’ earnings. However, as to the output, most of them keep it the same to 2008 or more. Rank of Global Main Solar Cell Manufacturers by Revenue, 2009 Company Name Production Capacity in 2008 Output in 2008 Revenue 1H2009 (USD in Millions) FirstSolar 735 503 See the Report SHARP 710 473 See the Report Suntech Power, Wuxi, China 1,000 497.5 See the Report SOLARWORLD N/A N/A See the Report Q-Cells 760 574.2 See the Report Kyocera 360 290 See the Report Yingli Green Energy 400 281.5 See the Report SANYO 345 215 See the Report SunPower 414 237 See the Report Trina Solar, Changzhou, China 209 201 See the Report Schott Solar N/A N/A See the Report Taiwan Motech 410 272 See the Report Solarfun 360 189 See the Report JA Solar Holdings Co., Ltd. 750 277 See the Report Gintech 280 N/A See the Report Canadian Solar Inc (CSI) 250 108 See the Report 168Report Mr.Peter Lee sales@168report.com 13161572746 8610-82965190 Page 1
- 2. 168Report-China Market Research Reports UnitedSolar N/A N/A See the Report E-tonsolar N/A N/A See the Report Green Energy N/A N/A See the Report Super-solar N/A N/A See the Report China Sunergy 320 111 See the Report BP Solar 160 N/A See the Report Ersol Solar Energy 145 N/A See the Report Mitsubishi Electric 150 N/A See the Report A 25MW polysilicon solar cell production line calls for total investment of approximately RMB40 million to RMB50 million. According to the current competition conditions, it starts from 100MW in China, and the investment approximates RMB220 million, of which 70% goes to equipments. In particular, the capital for PECVD equipment is the highest, accounting for around 30% of equipment investment. In addition, a 25MW production line of amorphous silicon thin-film solar cells is in need of RMB450million to RMB500million of investment, of which 70% are for equipment, particularly PECVD with the highest proportion of 65-70%. In 2009, the global solar cell equipment market is sized by about US$4.96 billion, of which PECVD holds 33%. Rank of Global Solar Cell Equipment Manufacturers by Revenue, 2008-2009 Unit: US$ in Millions Company 2008 2009 Applied Materials 808 1,208 Oerlikon 598 602 Centrotherm 375 601 ULVAC 382 432 GT Solar 510 508 Roth & Rau AG 272 200 MEYER BURGER 455 468 Manz 237 68 Gebr Schmid 502 468 Von Ardenne Anlagentechnik 124 128 RENA Sondermaschinen GmbH 96 96 Applied Materials Company is the overlord in the PECVD area, and it has great strength in the field of amorphous silicon thin-film solar cell equipments. It performed quite well in 2009, while other counterparts, except Manz adept in automation, have also made outstanding achievements. This shows still strong growth in solar cell sector. China has the most solar cell manufacturers all over the world. Chinese solar cell equipment industry performs well in polysilicon solar cell, and it is endeavoring in the field of amorphous silicon thin-film solar cells. In the 10 most important equipments for solar cell production line, 8 types can be made in China, of which 6 ones (diffusion furnace, plasma etcher, cleaning/flocking 168Report Mr.Peter Lee sales@168report.com 13161572746 8610-82965190 Page 2
- 3. 168Report-China Market Research Reports machine, PSG equipment, and low-temperature drying oven) hold leading roles in production lines in China; and the rest two types (Tubular PECVD and Fast Sintering Furnace) coexist with the imported equipments and their shares keep increasing. However, automatic screen printer, automatic sorter, and flat PECVD are still dependent on import. Contents 1. Solar (PV) Cell 1.1 History 1.2 Generating Theory 1.3 Categories 1.4 Manufacturing Process 1.5 Industry Chains 2. Solar Cell Industry Chains 2.1 Markets 2.2 Policies for Solar Cell in Countries 2.2.1 Germany 2.2.2 America 2.2.3 Spain & Japan 2.2.4 India 2.2.5 China 2.2.6 China Policies by Province 2.3 Global Solar Cell Industry 2.4 China Solar Cell Industry 2.5 China Thin-film Solar Cell Industry 2.5.1 Tianwei Baoding 2.5.2 Ennsolar 2.5.3 Shenzhen Topray Solar 2.5.4 Shenzhen Trony Solar 2.5.5 Chint 2.5.6 Golden Sun (Fujian) Solar 2.5.7 Jinneng Solar Cell 2.5.8 QS Solar 2.5.9 Bengbu Polar-PV 2.5.10 Suzhou Best Solar Energy 2.6 Solar Cell Industry in Germany 2.6.1 Policies 2.6.2 German Solar Cell Enterprises 2.7 Upstream--Polysilicon 2.8 Supply & Demand of Polysilicon 2.9 Thin-film Solar Cell 2.9.1 CdTe Thin-film Cell 2.10 CPV 168Report Mr.Peter Lee sales@168report.com 13161572746 8610-82965190 Page 3
- 4. 168Report-China Market Research Reports 2.10.1 Profile 2.10.2 Developments 2.10.3 Trough Solar Thermal Power Generation 2.10.4 Paraboloid CPV 2.10.5 Tower CPV 2.11 Dye-sensitized Solar Cell 3. Solar Cell Equipment Industry 3.1 Market Scale 3.2 Polysilicon Solar Cell Equipment 3.3 Amorphous Silicon Thin-film Solar Cell Equipment 3.3.1 Single Room with Multi Chips 3.3.2 Multi Rooms with Single Chip 3.3.3 Single Room with Multi Rooms 3.3.4 Roll to Roll 3.4 Global Solar Cell Equipment Industry 3.5 Chinese Solar Cell Equipment Industry 3.5.1 Cleaning and Flocking Machines 3.5.2 Diffusion Furnace 3.5.3 Bubular PECVD 3.5.4 Suppliers of Whole line 4. Solar (PV) Cell Equipment Manufacturers 4.1 Oerlikon 4. 2 Centrotherm Photovoltaics AG 4.3 ULVAC 4.4 GT Solar 4.5 Roth & Rau 4.6 MEYER BURGER 4.7 Manz Automation 4.8 Gebr Schmid 4.9 Applied Materials 4.10 CCEG 48th Institute 4.11 VON ARDENNE 4.12 Sunhisolar Appendix. Overview of Global Solar Cell Equipment Manufacturers 1. Complete Production Lines 2. Cleaning Instruments 3. Diffusion Equipments 4. Etching Equipments 5. Laminating Equipments 6. Screen Printing 168Report Mr.Peter Lee sales@168report.com 13161572746 8610-82965190 Page 4
- 5. 168Report-China Market Research Reports 7. Tester and Sorter 8. Other Oven Equipments 9. Other Equipments 10. Discretes and Packaging Equipments Selected Charts Cumulated Installed Capacity of Solar Cells in Germany, 2000-2008 German Output of Solar Cells, 2000-2010 The Process of Extracting Polysilicon Prices of Polysilicon, 2004--2011 Global Solar Cell Shipment by Power, 2004-2011 Market Demand of Global Solar Cell Equipments, 2003-2014 Polysilicon Solar Cell Process Flows Amorphous Silicon Thin-film Solar Cell Process Flows Output Value of Global Solar Cell Equipments by Technology, 2008 Output Value of Global Solar Cell Equipments by Region, 2009 Organization Structure of OERLIKON Revenues and EBIT of Oerlikon, 2004-2009 Oerlikon Revenue by Dept., 2007-Sep.2009 Oerlikon Technology Roadmap Organization Structure of Centrotherm Photovoltaics AG Revenue and EBIT Statistics and Forecast of Centrotherm Photovoltaics, 2005-2009 Revenue of Centrotherm Photovoltaics by Region, 2006-Sep.2009 Revenue of Centrotherm Photovoltaics by Business, 2006-Sep.2009 Revenue of Centrotherm Photovoltaics by Product, 2007-Sep.2009 Backlog Statistics of Centrotherm Photovoltaics, Aug.2008-Sep.2009 Revenue of Centrotherm Photovoltaics by Business, Q3 2009 Revenue of Centrotherm Photovoltaics by Region, Q3 2009 Shipment of Centrotherm Photovoltaics by Product, 2008 vs. Q1-Q3 2009 Expenditure of Centrotherm Photovoltaics, Jan.2009-Sep.2009 Revenue and Operating Profit Margin of ULVAC, FY2004-FY2010 Global Presence of ULVAC ULVAC Revenue by Dept., Q1 2004FY-Q1 2009FY ULVAC Orders by Dept., Q1 2004FY-Q1 2009FY ULVAC Revenue Forecast by Dept., FY2010 ULVAC Orders Forecast by Dept., FY2010 ULVAC Capital for R&D, FY2000-FY2010 ULVAC Revenue from Flat Displays and Solar Equipments, 2005-2010 vs. FY2014 ULVAC Revenue by Region, FY2005-FY2009 GT Solar Revenues and Gross Profit Margins, FY2006-FY2010 GT Solar Revenues by Region, FY2007-FY2009 168Report Mr.Peter Lee sales@168report.com 13161572746 8610-82965190 Page 5
- 6. 168Report-China Market Research Reports Main Customers of GT Solar Revenue and EBIT Statistics and Forecast of Roth&Rau AG, 2004--2009 Bridge Map of EBIT, Roth&Rau, 2009 Organization Structure of MEYER BURGER Revenues and Gross Profits of MERYER BURGER, 2006--2009 Revenues and Pre-tax Profit of Manz, 2005-Sep.2009 Revenues and Gross Profit Margins of Applied Materials, FY2004-FY2009 Sales Revenue of Applied Materials by Dept., FY2006-FY2009 Sales Revenue and Operating Profit of Applied Materials, Q12009FY-Q4 2009FY Revenues of Applied Materials by Dept., Q4 2009FY Orders of Applied Materials by Region, Q4 2009FY Order Sum of Applied Materials by Region, 2006FY-2009Q1-Q3FY Sales Revenue of Applied Materials by Region, 2006FY-2009Q1-Q3FY Order Sum of Applied Materials by Dept., 2006FY-2009Q1-Q3FY Cumulated Photovoltaic Installed Capacity in Main Countries, 2001-2008 Newly Added Photovoltaic Installed Capacity in Main Countries, 2002-2008 Demand Forecast of Global Newly Added Photovoltaic Installation, 2007-2011 FIT Comparison of Main European Countries Rank of 34 Global Solar (Photovoltaic) Cell Manufacturers, 1H 2009 Rank of 38 Chinese Solar Cell Manufacturers by Output, 2008 Output Value of German Solar Cell Manufacturers, 2004-2009 Output Capacity of Global Main Polysilicon Manufacturers, 2006-2010 Forecast of Polysilicon Demand, 2008-2011 Forecast of Polysilicon Supply, 2007-2011 Cost Estimation of CdTe Cell Generation, 2008-2011 Tables for Main Core Parts of Trough Generating Tables for Gloal Main Trough Solar Generating Projects Tables for Global Main Paraboloid Solar Generating Projects Target of Paraboloid Soalr Generating Cost and Performance Tables for Global Main Tower Solar Generating Projects Rank of Global Solar Cell Manufacturers, 2008-2009 Orders, Sales and EBIT Statistics of Oerlink's PV Dept., 2007-Mar.2009 Main Customers of Oerlinkon, 2009 Assets and Net Asset Value of Centrotherm Photovoltaics, 2005-2008 Staff Members and Left Amounts of Orders of Centrotherm Photovoltaics, 2005-Sep.2009 Sales, EBITDA, and EBIT of Centrotherm Photovoltaics, Jan.2009-Sep.2009 Occupied Proportions of Main Customers of GT Solar, FY2007-FY2009 Financial Data of Manz, 2005-2009 168Report Mr.Peter Lee sales@168report.com 13161572746 8610-82965190 Page 6
- 7. 168Report-China Market Research Reports Main Customers of GT Solar Revenue and EBIT Statistics and Forecast of Roth&Rau AG, 2004--2009 Bridge Map of EBIT, Roth&Rau, 2009 Organization Structure of MEYER BURGER Revenues and Gross Profits of MERYER BURGER, 2006--2009 Revenues and Pre-tax Profit of Manz, 2005-Sep.2009 Revenues and Gross Profit Margins of Applied Materials, FY2004-FY2009 Sales Revenue of Applied Materials by Dept., FY2006-FY2009 Sales Revenue and Operating Profit of Applied Materials, Q12009FY-Q4 2009FY Revenues of Applied Materials by Dept., Q4 2009FY Orders of Applied Materials by Region, Q4 2009FY Order Sum of Applied Materials by Region, 2006FY-2009Q1-Q3FY Sales Revenue of Applied Materials by Region, 2006FY-2009Q1-Q3FY Order Sum of Applied Materials by Dept., 2006FY-2009Q1-Q3FY Cumulated Photovoltaic Installed Capacity in Main Countries, 2001-2008 Newly Added Photovoltaic Installed Capacity in Main Countries, 2002-2008 Demand Forecast of Global Newly Added Photovoltaic Installation, 2007-2011 FIT Comparison of Main European Countries Rank of 34 Global Solar (Photovoltaic) Cell Manufacturers, 1H 2009 Rank of 38 Chinese Solar Cell Manufacturers by Output, 2008 Output Value of German Solar Cell Manufacturers, 2004-2009 Output Capacity of Global Main Polysilicon Manufacturers, 2006-2010 Forecast of Polysilicon Demand, 2008-2011 Forecast of Polysilicon Supply, 2007-2011 Cost Estimation of CdTe Cell Generation, 2008-2011 Tables for Main Core Parts of Trough Generating Tables for Gloal Main Trough Solar Generating Projects Tables for Global Main Paraboloid Solar Generating Projects Target of Paraboloid Soalr Generating Cost and Performance Tables for Global Main Tower Solar Generating Projects Rank of Global Solar Cell Manufacturers, 2008-2009 Orders, Sales and EBIT Statistics of Oerlink's PV Dept., 2007-Mar.2009 Main Customers of Oerlinkon, 2009 Assets and Net Asset Value of Centrotherm Photovoltaics, 2005-2008 Staff Members and Left Amounts of Orders of Centrotherm Photovoltaics, 2005-Sep.2009 Sales, EBITDA, and EBIT of Centrotherm Photovoltaics, Jan.2009-Sep.2009 Occupied Proportions of Main Customers of GT Solar, FY2007-FY2009 Financial Data of Manz, 2005-2009 168Report Mr.Peter Lee sales@168report.com 13161572746 8610-82965190 Page 6