SlideShare une entreprise Scribd logo
1  sur  4
2013/05/07
1
STATISTICS
X-Kit Textbook
Chapter 8 (Making sense of Sample Data)
Precalculus Textbook
Appendix B: Concepts in Statistics
Par B.1 (Representing Data)
ORGANISE& SUMMARISERAW DATA
Raw Data
Discrete Data
Ungrouped
Frequency
Table
Grouped (low
frequency)
Continuous
Data
Grouped
Frequency
Table
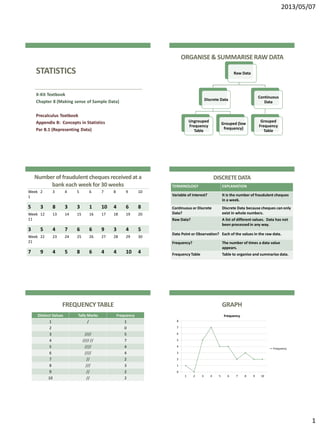
Number of fraudulent cheques receivedat a
bank each week for 30 weeks
Week
1
2 3 4 5 6 7 8 9 10
5 3 8 3 3 1 10 4 6 8
Week
11
12 13 14 15 16 17 18 19 20
3 5 4 7 6 6 9 3 4 5
Week
21
22 23 24 25 26 27 28 29 30
7 9 4 5 8 6 4 4 10 4
DISCRETEDATA
TERMINOLOGY EXPLANATION
Variable of Interest? It is the number of fraudulent cheques
in a week.
Continuous or Discrete
Data?
Discrete Data because cheques can only
exist in whole numbers.
Raw Data? A list of different values. Data has not
been processed in any way.
Data Point or Observation? Each of the values in the raw data.
Frequency? The number of times a data value
appears.
Frequency Table Table to organise and summarise data.
FREQUENCYTABLE
Distinct Values Tally Marks Frequency
1 / 1
2 0
3 //// 5
4 //// // 7
5 //// 4
6 //// 4
7 // 2
8 /// 3
9 // 2
10 // 2
GRAPH
0
1
2
3
4
5
6
7
8
1 2 3 4 5 6 7 8 9 10
Frequency
Frequency
2013/05/07
2
Truck Data: weights(in tonnes) of 20 fully
loaded trucks
Truck
1
2 3 4 5 6 7 8 9 10
Weight
4.54
3.81 4.29 5.16 2.51 4.63 4.75 3.98 5.04 2.80
Truck
11
12 13 14 15 16 17 18 19 20
Weight
2.52
5.88 2.95 3.59 3.87 4.17 3.30 5.48 4.26 3.53
CONTINUOUSDATA
TERMINOLOGY EXPLANATION
Variable of Interest? The weight of a loaded truck.
Continuous or Discrete
Data?
Continuous Data, you can get any
number of values between two
given values.
Frequency Table Table to organise and summarise
data.
Grouped Frequency Table
FREQUENCYTABLE
Class Intervals Tally Marks Frequency
𝟐. 𝟓 ≤ 𝒙 ≤ 𝟑. 𝟎 //// 4
𝟑. 𝟎 ≤ 𝒙 ≤ 𝟑. 𝟓 / 1
𝟑. 𝟓 ≤ 𝒙 ≤ 𝟒. 𝟎 //// 5
𝟒. 𝟎 ≤ 𝒙 ≤ 𝟒. 𝟓 /// 3
𝟒. 𝟓 ≤ 𝒙 ≤ 𝟓. 𝟎 /// 3
𝟓. 𝟎 ≤ 𝒙 ≤ 𝟓. 𝟓 // 2
𝟓. 𝟓 ≤ 𝒙 ≤ 𝟔. 𝟎 // 2
GRAPH
0
1
2
3
4
5
6
0 - 2.5 2.5 - 3.0 3.0 - 3.5 3.5 - 4.0 4.0 - 4.5 4.5 - 5.0 5.0 - 5.5 5.5 - 6.0
Frequency
Frequency
PRESENTATIONOF DATA
Frequency
Table
Pictogram
Bar
Graphs
Histogram
Pie
Chart
Line
Graphs
Stem-and-
Leaf
Ogive
FREQUENCYTABLE
Class Intervals Frequency Cumulative
Frequency
𝟐. 𝟓 ≤ 𝒙 ≤ 𝟑. 𝟎 4 4
𝟑. 𝟎 ≤ 𝒙 ≤ 𝟑. 𝟓 1 5
𝟑. 𝟓 ≤ 𝒙 ≤ 𝟒. 𝟎 5 10
𝟒. 𝟎 ≤ 𝒙 ≤ 𝟒. 𝟓 3 13
𝟒. 𝟓 ≤ 𝒙 ≤ 𝟓. 𝟎 3 16
𝟓. 𝟎 ≤ 𝒙 ≤ 𝟓. 𝟓 3 19
𝟓. 𝟓 ≤ 𝒙 ≤ 𝟔. 𝟎 1 20
2013/05/07
3
OGIVE
0
5
10
15
20
25
2.5 3 3.5 4 4.5 5 5.5 6
Cumulative Frequency
Pictogram: Net Worthof America'sRichest Billionaires
Pie Chart: Average Annual Expenses in a U.S. Household
EXAMPLE
In a class with 30 pupils there are 12 with
blue eyes; 9 with brown eyes; 4 with dark
brown eyes and 5 with green eyes.
1. Draw a pie chart showing this
information.
2. Calculate the fraction and percentage
represented by each eye colour.
EXAMPLE: SOLUTION
Colour of
Eyes
Frequency Angle at Centre Percentage
Blue 12 𝟏𝟐
𝟑𝟎
× 𝟑𝟔𝟎°
= 𝟏𝟒𝟒°
𝟏𝟐
𝟑𝟎
× 𝟏𝟎𝟎 = 𝟒𝟎%
Brown 9 𝟗
𝟑𝟎
× 𝟑𝟔𝟎°
= 𝟏𝟎𝟖°
𝟗
𝟑𝟎
× 𝟏𝟎𝟎 = 𝟑𝟎%
Dark Brown 4 𝟒
𝟑𝟎
× 𝟑𝟔𝟎°
= 𝟒𝟖°
𝟒
𝟑𝟎
× 𝟏𝟎𝟎 = 𝟏𝟑, 𝟑%
Green 5 𝟓
𝟑𝟎
× 𝟑𝟔𝟎°
= 𝟔𝟎°
𝟓
𝟑𝟎
× 𝟏𝟎𝟎 = 𝟏𝟔, 𝟕%
Total 30 𝟑𝟔𝟎° 𝟏𝟎𝟎%
PIE CHART
Blue
Brown
Dark Brown
Green
2013/05/07
4
Bar Graph: Expected U.S. PopulationAged 100 and Over DoubleBar Graph: Fuel Efficiency
LineGraph: Effectof Inflationon the Valueof a $100,000
LifeInsurance Policy
DoubleLineGraph: Populationsof Californiaand Texas
Stem-and-Leaf Plot
Represent the data below in a stem-and-leaf plot:
152; 165; 143; 139; 138;
144; 150; 158; 161; 157;
143; 156; 162; 165; 139;
158; 151; 167; 166; 160;
170; 132; 145; 151; 148;
147; 171; 155; 146; 141.
Stem-and-Leaf Plot
STEM LEAVES
13 9; 8; 9; 2
14 3; 4; 3; 5; 8; 7; 6; 1
15 2; 0; 8; 7; 6; 8; 1; 1; 5
16 5; 1; 2; 5; 7; 6; 0
17 0; 1

Contenu connexe

En vedette

Chapter 5 more about interest edulink
Chapter 5 more about interest edulinkChapter 5 more about interest edulink
Chapter 5 more about interest edulinkME MALULEKE
 
03 Simple ideograms
03  Simple ideograms03  Simple ideograms
03 Simple ideogramsHaibiao Miao
 
Guatemala Presentation
Guatemala PresentationGuatemala Presentation
Guatemala Presentationandramlowe
 
Mayan Writing & the Long Count
Mayan Writing & the Long CountMayan Writing & the Long Count
Mayan Writing & the Long CountDokka Srinivasu
 
The Archaeology Of Mayan Civilization
The Archaeology Of Mayan CivilizationThe Archaeology Of Mayan Civilization
The Archaeology Of Mayan CivilizationFaiza Rehman
 
Mayan Center for Peace: Guatemala to Minnesota
Mayan Center for Peace:  Guatemala to MinnesotaMayan Center for Peace:  Guatemala to Minnesota
Mayan Center for Peace: Guatemala to Minnesotaadam.utley
 

En vedette (7)

Chapter 5 more about interest edulink
Chapter 5 more about interest edulinkChapter 5 more about interest edulink
Chapter 5 more about interest edulink
 
03 Simple ideograms
03  Simple ideograms03  Simple ideograms
03 Simple ideograms
 
Guatemala Presentation
Guatemala PresentationGuatemala Presentation
Guatemala Presentation
 
Mayan Writing & the Long Count
Mayan Writing & the Long CountMayan Writing & the Long Count
Mayan Writing & the Long Count
 
Mayan Presentation
Mayan PresentationMayan Presentation
Mayan Presentation
 
The Archaeology Of Mayan Civilization
The Archaeology Of Mayan CivilizationThe Archaeology Of Mayan Civilization
The Archaeology Of Mayan Civilization
 
Mayan Center for Peace: Guatemala to Minnesota
Mayan Center for Peace:  Guatemala to MinnesotaMayan Center for Peace:  Guatemala to Minnesota
Mayan Center for Peace: Guatemala to Minnesota
 

Similaire à Organising and Summarising Raw Data

maft0a2_Statistics_lecture2_2021.pptx
maft0a2_Statistics_lecture2_2021.pptxmaft0a2_Statistics_lecture2_2021.pptx
maft0a2_Statistics_lecture2_2021.pptxTshegofatso Mphake
 
Willie Evangelista - Presentation of data
Willie Evangelista -  Presentation of data Willie Evangelista -  Presentation of data
Willie Evangelista - Presentation of data Willie Evangelista
 
Presentationofdata 120111034007-phpapp02
Presentationofdata 120111034007-phpapp02Presentationofdata 120111034007-phpapp02
Presentationofdata 120111034007-phpapp02Alex Robianes Hernandez
 
20- Tabular & Graphical Presentation of data(UG2017-18).ppt
20- Tabular & Graphical Presentation of data(UG2017-18).ppt20- Tabular & Graphical Presentation of data(UG2017-18).ppt
20- Tabular & Graphical Presentation of data(UG2017-18).pptRAJESHKUMAR428748
 
Stat 200 week 6 homework problems9.1.2 many high school student
Stat 200 week 6 homework problems9.1.2 many high school studentStat 200 week 6 homework problems9.1.2 many high school student
Stat 200 week 6 homework problems9.1.2 many high school studentrock73
 
Type of data @ web mining discussion
Type of data @ web mining discussionType of data @ web mining discussion
Type of data @ web mining discussionCherryBerry2
 
Type of data @ Web Mining Discussion
Type of data @ Web Mining DiscussionType of data @ Web Mining Discussion
Type of data @ Web Mining DiscussionCherryBerry2
 
Frequency Tables, Frequency Distributions, and Graphic Presentation
Frequency Tables, Frequency Distributions, and Graphic PresentationFrequency Tables, Frequency Distributions, and Graphic Presentation
Frequency Tables, Frequency Distributions, and Graphic PresentationConflagratioNal Jahid
 
Algebra unit 9.2
Algebra unit 9.2Algebra unit 9.2
Algebra unit 9.2Mark Ryder
 
2 biostatistics presenting data
2  biostatistics presenting data2  biostatistics presenting data
2 biostatistics presenting dataDr. Nazar Jaf
 
Penggambaran Data dengan Grafik
Penggambaran Data dengan GrafikPenggambaran Data dengan Grafik
Penggambaran Data dengan Grafikanom0164
 
03 ch ken black solution
03 ch ken black solution03 ch ken black solution
03 ch ken black solutionKrunal Shah
 
frequency distribution
 frequency distribution frequency distribution
frequency distributionUnsa Shakir
 
Graphs that Enlighten and Graphs that Deceive
Graphs that Enlighten and Graphs that DeceiveGraphs that Enlighten and Graphs that Deceive
Graphs that Enlighten and Graphs that DeceiveLong Beach City College
 
Basic Stat Notes
Basic Stat NotesBasic Stat Notes
Basic Stat Notesroopcool
 
Teoria y problemas de tabla de frecuencias tf221 ccesa007
Teoria y problemas de tabla de frecuencias  tf221  ccesa007Teoria y problemas de tabla de frecuencias  tf221  ccesa007
Teoria y problemas de tabla de frecuencias tf221 ccesa007Demetrio Ccesa Rayme
 
measure of dispersion
measure of dispersion measure of dispersion
measure of dispersion som allul
 

Similaire à Organising and Summarising Raw Data (20)

maft0a2_Statistics_lecture2_2021.pptx
maft0a2_Statistics_lecture2_2021.pptxmaft0a2_Statistics_lecture2_2021.pptx
maft0a2_Statistics_lecture2_2021.pptx
 
Willie Evangelista - Presentation of data
Willie Evangelista -  Presentation of data Willie Evangelista -  Presentation of data
Willie Evangelista - Presentation of data
 
Presentationofdata 120111034007-phpapp02
Presentationofdata 120111034007-phpapp02Presentationofdata 120111034007-phpapp02
Presentationofdata 120111034007-phpapp02
 
20- Tabular & Graphical Presentation of data(UG2017-18).ppt
20- Tabular & Graphical Presentation of data(UG2017-18).ppt20- Tabular & Graphical Presentation of data(UG2017-18).ppt
20- Tabular & Graphical Presentation of data(UG2017-18).ppt
 
Stat 200 week 6 homework problems9.1.2 many high school student
Stat 200 week 6 homework problems9.1.2 many high school studentStat 200 week 6 homework problems9.1.2 many high school student
Stat 200 week 6 homework problems9.1.2 many high school student
 
Type of data @ web mining discussion
Type of data @ web mining discussionType of data @ web mining discussion
Type of data @ web mining discussion
 
Type of data @ Web Mining Discussion
Type of data @ Web Mining DiscussionType of data @ Web Mining Discussion
Type of data @ Web Mining Discussion
 
Frequency Tables, Frequency Distributions, and Graphic Presentation
Frequency Tables, Frequency Distributions, and Graphic PresentationFrequency Tables, Frequency Distributions, and Graphic Presentation
Frequency Tables, Frequency Distributions, and Graphic Presentation
 
statistic.ppt
statistic.pptstatistic.ppt
statistic.ppt
 
Algebra unit 9.2
Algebra unit 9.2Algebra unit 9.2
Algebra unit 9.2
 
2 biostatistics presenting data
2  biostatistics presenting data2  biostatistics presenting data
2 biostatistics presenting data
 
Penggambaran Data dengan Grafik
Penggambaran Data dengan GrafikPenggambaran Data dengan Grafik
Penggambaran Data dengan Grafik
 
03 ch ken black solution
03 ch ken black solution03 ch ken black solution
03 ch ken black solution
 
Data presentation
Data presentationData presentation
Data presentation
 
frequency distribution
 frequency distribution frequency distribution
frequency distribution
 
Graphs that Enlighten and Graphs that Deceive
Graphs that Enlighten and Graphs that DeceiveGraphs that Enlighten and Graphs that Deceive
Graphs that Enlighten and Graphs that Deceive
 
Basic Stat Notes
Basic Stat NotesBasic Stat Notes
Basic Stat Notes
 
Freq & Histo
Freq & HistoFreq & Histo
Freq & Histo
 
Teoria y problemas de tabla de frecuencias tf221 ccesa007
Teoria y problemas de tabla de frecuencias  tf221  ccesa007Teoria y problemas de tabla de frecuencias  tf221  ccesa007
Teoria y problemas de tabla de frecuencias tf221 ccesa007
 
measure of dispersion
measure of dispersion measure of dispersion
measure of dispersion
 

Dernier

Field Attribute Index Feature in Odoo 17
Field Attribute Index Feature in Odoo 17Field Attribute Index Feature in Odoo 17
Field Attribute Index Feature in Odoo 17Celine George
 
Keynote by Prof. Wurzer at Nordex about IP-design
Keynote by Prof. Wurzer at Nordex about IP-designKeynote by Prof. Wurzer at Nordex about IP-design
Keynote by Prof. Wurzer at Nordex about IP-designMIPLM
 
MULTIDISCIPLINRY NATURE OF THE ENVIRONMENTAL STUDIES.pptx
MULTIDISCIPLINRY NATURE OF THE ENVIRONMENTAL STUDIES.pptxMULTIDISCIPLINRY NATURE OF THE ENVIRONMENTAL STUDIES.pptx
MULTIDISCIPLINRY NATURE OF THE ENVIRONMENTAL STUDIES.pptxAnupkumar Sharma
 
USPS® Forced Meter Migration - How to Know if Your Postage Meter Will Soon be...
USPS® Forced Meter Migration - How to Know if Your Postage Meter Will Soon be...USPS® Forced Meter Migration - How to Know if Your Postage Meter Will Soon be...
USPS® Forced Meter Migration - How to Know if Your Postage Meter Will Soon be...Postal Advocate Inc.
 
How to Add Barcode on PDF Report in Odoo 17
How to Add Barcode on PDF Report in Odoo 17How to Add Barcode on PDF Report in Odoo 17
How to Add Barcode on PDF Report in Odoo 17Celine George
 
HỌC TỐT TIẾNG ANH 11 THEO CHƯƠNG TRÌNH GLOBAL SUCCESS ĐÁP ÁN CHI TIẾT - CẢ NĂ...
HỌC TỐT TIẾNG ANH 11 THEO CHƯƠNG TRÌNH GLOBAL SUCCESS ĐÁP ÁN CHI TIẾT - CẢ NĂ...HỌC TỐT TIẾNG ANH 11 THEO CHƯƠNG TRÌNH GLOBAL SUCCESS ĐÁP ÁN CHI TIẾT - CẢ NĂ...
HỌC TỐT TIẾNG ANH 11 THEO CHƯƠNG TRÌNH GLOBAL SUCCESS ĐÁP ÁN CHI TIẾT - CẢ NĂ...Nguyen Thanh Tu Collection
 
Roles & Responsibilities in Pharmacovigilance
Roles & Responsibilities in PharmacovigilanceRoles & Responsibilities in Pharmacovigilance
Roles & Responsibilities in PharmacovigilanceSamikshaHamane
 
Inclusivity Essentials_ Creating Accessible Websites for Nonprofits .pdf
Inclusivity Essentials_ Creating Accessible Websites for Nonprofits .pdfInclusivity Essentials_ Creating Accessible Websites for Nonprofits .pdf
Inclusivity Essentials_ Creating Accessible Websites for Nonprofits .pdfTechSoup
 
Incoming and Outgoing Shipments in 3 STEPS Using Odoo 17
Incoming and Outgoing Shipments in 3 STEPS Using Odoo 17Incoming and Outgoing Shipments in 3 STEPS Using Odoo 17
Incoming and Outgoing Shipments in 3 STEPS Using Odoo 17Celine George
 
Procuring digital preservation CAN be quick and painless with our new dynamic...
Procuring digital preservation CAN be quick and painless with our new dynamic...Procuring digital preservation CAN be quick and painless with our new dynamic...
Procuring digital preservation CAN be quick and painless with our new dynamic...Jisc
 
Difference Between Search & Browse Methods in Odoo 17
Difference Between Search & Browse Methods in Odoo 17Difference Between Search & Browse Methods in Odoo 17
Difference Between Search & Browse Methods in Odoo 17Celine George
 
What is Model Inheritance in Odoo 17 ERP
What is Model Inheritance in Odoo 17 ERPWhat is Model Inheritance in Odoo 17 ERP
What is Model Inheritance in Odoo 17 ERPCeline George
 
Grade 9 Q4-MELC1-Active and Passive Voice.pptx
Grade 9 Q4-MELC1-Active and Passive Voice.pptxGrade 9 Q4-MELC1-Active and Passive Voice.pptx
Grade 9 Q4-MELC1-Active and Passive Voice.pptxChelloAnnAsuncion2
 
Judging the Relevance and worth of ideas part 2.pptx
Judging the Relevance  and worth of ideas part 2.pptxJudging the Relevance  and worth of ideas part 2.pptx
Judging the Relevance and worth of ideas part 2.pptxSherlyMaeNeri
 
Karra SKD Conference Presentation Revised.pptx
Karra SKD Conference Presentation Revised.pptxKarra SKD Conference Presentation Revised.pptx
Karra SKD Conference Presentation Revised.pptxAshokKarra1
 

Dernier (20)

Field Attribute Index Feature in Odoo 17
Field Attribute Index Feature in Odoo 17Field Attribute Index Feature in Odoo 17
Field Attribute Index Feature in Odoo 17
 
Keynote by Prof. Wurzer at Nordex about IP-design
Keynote by Prof. Wurzer at Nordex about IP-designKeynote by Prof. Wurzer at Nordex about IP-design
Keynote by Prof. Wurzer at Nordex about IP-design
 
MULTIDISCIPLINRY NATURE OF THE ENVIRONMENTAL STUDIES.pptx
MULTIDISCIPLINRY NATURE OF THE ENVIRONMENTAL STUDIES.pptxMULTIDISCIPLINRY NATURE OF THE ENVIRONMENTAL STUDIES.pptx
MULTIDISCIPLINRY NATURE OF THE ENVIRONMENTAL STUDIES.pptx
 
USPS® Forced Meter Migration - How to Know if Your Postage Meter Will Soon be...
USPS® Forced Meter Migration - How to Know if Your Postage Meter Will Soon be...USPS® Forced Meter Migration - How to Know if Your Postage Meter Will Soon be...
USPS® Forced Meter Migration - How to Know if Your Postage Meter Will Soon be...
 
YOUVE_GOT_EMAIL_PRELIMS_EL_DORADO_2024.pptx
YOUVE_GOT_EMAIL_PRELIMS_EL_DORADO_2024.pptxYOUVE_GOT_EMAIL_PRELIMS_EL_DORADO_2024.pptx
YOUVE_GOT_EMAIL_PRELIMS_EL_DORADO_2024.pptx
 
How to Add Barcode on PDF Report in Odoo 17
How to Add Barcode on PDF Report in Odoo 17How to Add Barcode on PDF Report in Odoo 17
How to Add Barcode on PDF Report in Odoo 17
 
HỌC TỐT TIẾNG ANH 11 THEO CHƯƠNG TRÌNH GLOBAL SUCCESS ĐÁP ÁN CHI TIẾT - CẢ NĂ...
HỌC TỐT TIẾNG ANH 11 THEO CHƯƠNG TRÌNH GLOBAL SUCCESS ĐÁP ÁN CHI TIẾT - CẢ NĂ...HỌC TỐT TIẾNG ANH 11 THEO CHƯƠNG TRÌNH GLOBAL SUCCESS ĐÁP ÁN CHI TIẾT - CẢ NĂ...
HỌC TỐT TIẾNG ANH 11 THEO CHƯƠNG TRÌNH GLOBAL SUCCESS ĐÁP ÁN CHI TIẾT - CẢ NĂ...
 
Roles & Responsibilities in Pharmacovigilance
Roles & Responsibilities in PharmacovigilanceRoles & Responsibilities in Pharmacovigilance
Roles & Responsibilities in Pharmacovigilance
 
Inclusivity Essentials_ Creating Accessible Websites for Nonprofits .pdf
Inclusivity Essentials_ Creating Accessible Websites for Nonprofits .pdfInclusivity Essentials_ Creating Accessible Websites for Nonprofits .pdf
Inclusivity Essentials_ Creating Accessible Websites for Nonprofits .pdf
 
Incoming and Outgoing Shipments in 3 STEPS Using Odoo 17
Incoming and Outgoing Shipments in 3 STEPS Using Odoo 17Incoming and Outgoing Shipments in 3 STEPS Using Odoo 17
Incoming and Outgoing Shipments in 3 STEPS Using Odoo 17
 
TataKelola dan KamSiber Kecerdasan Buatan v022.pdf
TataKelola dan KamSiber Kecerdasan Buatan v022.pdfTataKelola dan KamSiber Kecerdasan Buatan v022.pdf
TataKelola dan KamSiber Kecerdasan Buatan v022.pdf
 
Model Call Girl in Tilak Nagar Delhi reach out to us at 🔝9953056974🔝
Model Call Girl in Tilak Nagar Delhi reach out to us at 🔝9953056974🔝Model Call Girl in Tilak Nagar Delhi reach out to us at 🔝9953056974🔝
Model Call Girl in Tilak Nagar Delhi reach out to us at 🔝9953056974🔝
 
Procuring digital preservation CAN be quick and painless with our new dynamic...
Procuring digital preservation CAN be quick and painless with our new dynamic...Procuring digital preservation CAN be quick and painless with our new dynamic...
Procuring digital preservation CAN be quick and painless with our new dynamic...
 
LEFT_ON_C'N_ PRELIMS_EL_DORADO_2024.pptx
LEFT_ON_C'N_ PRELIMS_EL_DORADO_2024.pptxLEFT_ON_C'N_ PRELIMS_EL_DORADO_2024.pptx
LEFT_ON_C'N_ PRELIMS_EL_DORADO_2024.pptx
 
Difference Between Search & Browse Methods in Odoo 17
Difference Between Search & Browse Methods in Odoo 17Difference Between Search & Browse Methods in Odoo 17
Difference Between Search & Browse Methods in Odoo 17
 
OS-operating systems- ch04 (Threads) ...
OS-operating systems- ch04 (Threads) ...OS-operating systems- ch04 (Threads) ...
OS-operating systems- ch04 (Threads) ...
 
What is Model Inheritance in Odoo 17 ERP
What is Model Inheritance in Odoo 17 ERPWhat is Model Inheritance in Odoo 17 ERP
What is Model Inheritance in Odoo 17 ERP
 
Grade 9 Q4-MELC1-Active and Passive Voice.pptx
Grade 9 Q4-MELC1-Active and Passive Voice.pptxGrade 9 Q4-MELC1-Active and Passive Voice.pptx
Grade 9 Q4-MELC1-Active and Passive Voice.pptx
 
Judging the Relevance and worth of ideas part 2.pptx
Judging the Relevance  and worth of ideas part 2.pptxJudging the Relevance  and worth of ideas part 2.pptx
Judging the Relevance and worth of ideas part 2.pptx
 
Karra SKD Conference Presentation Revised.pptx
Karra SKD Conference Presentation Revised.pptxKarra SKD Conference Presentation Revised.pptx
Karra SKD Conference Presentation Revised.pptx
 

Organising and Summarising Raw Data

  • 1. 2013/05/07 1 STATISTICS X-Kit Textbook Chapter 8 (Making sense of Sample Data) Precalculus Textbook Appendix B: Concepts in Statistics Par B.1 (Representing Data) ORGANISE& SUMMARISERAW DATA Raw Data Discrete Data Ungrouped Frequency Table Grouped (low frequency) Continuous Data Grouped Frequency Table Number of fraudulent cheques receivedat a bank each week for 30 weeks Week 1 2 3 4 5 6 7 8 9 10 5 3 8 3 3 1 10 4 6 8 Week 11 12 13 14 15 16 17 18 19 20 3 5 4 7 6 6 9 3 4 5 Week 21 22 23 24 25 26 27 28 29 30 7 9 4 5 8 6 4 4 10 4 DISCRETEDATA TERMINOLOGY EXPLANATION Variable of Interest? It is the number of fraudulent cheques in a week. Continuous or Discrete Data? Discrete Data because cheques can only exist in whole numbers. Raw Data? A list of different values. Data has not been processed in any way. Data Point or Observation? Each of the values in the raw data. Frequency? The number of times a data value appears. Frequency Table Table to organise and summarise data. FREQUENCYTABLE Distinct Values Tally Marks Frequency 1 / 1 2 0 3 //// 5 4 //// // 7 5 //// 4 6 //// 4 7 // 2 8 /// 3 9 // 2 10 // 2 GRAPH 0 1 2 3 4 5 6 7 8 1 2 3 4 5 6 7 8 9 10 Frequency Frequency
  • 2. 2013/05/07 2 Truck Data: weights(in tonnes) of 20 fully loaded trucks Truck 1 2 3 4 5 6 7 8 9 10 Weight 4.54 3.81 4.29 5.16 2.51 4.63 4.75 3.98 5.04 2.80 Truck 11 12 13 14 15 16 17 18 19 20 Weight 2.52 5.88 2.95 3.59 3.87 4.17 3.30 5.48 4.26 3.53 CONTINUOUSDATA TERMINOLOGY EXPLANATION Variable of Interest? The weight of a loaded truck. Continuous or Discrete Data? Continuous Data, you can get any number of values between two given values. Frequency Table Table to organise and summarise data. Grouped Frequency Table FREQUENCYTABLE Class Intervals Tally Marks Frequency 𝟐. 𝟓 ≤ 𝒙 ≤ 𝟑. 𝟎 //// 4 𝟑. 𝟎 ≤ 𝒙 ≤ 𝟑. 𝟓 / 1 𝟑. 𝟓 ≤ 𝒙 ≤ 𝟒. 𝟎 //// 5 𝟒. 𝟎 ≤ 𝒙 ≤ 𝟒. 𝟓 /// 3 𝟒. 𝟓 ≤ 𝒙 ≤ 𝟓. 𝟎 /// 3 𝟓. 𝟎 ≤ 𝒙 ≤ 𝟓. 𝟓 // 2 𝟓. 𝟓 ≤ 𝒙 ≤ 𝟔. 𝟎 // 2 GRAPH 0 1 2 3 4 5 6 0 - 2.5 2.5 - 3.0 3.0 - 3.5 3.5 - 4.0 4.0 - 4.5 4.5 - 5.0 5.0 - 5.5 5.5 - 6.0 Frequency Frequency PRESENTATIONOF DATA Frequency Table Pictogram Bar Graphs Histogram Pie Chart Line Graphs Stem-and- Leaf Ogive FREQUENCYTABLE Class Intervals Frequency Cumulative Frequency 𝟐. 𝟓 ≤ 𝒙 ≤ 𝟑. 𝟎 4 4 𝟑. 𝟎 ≤ 𝒙 ≤ 𝟑. 𝟓 1 5 𝟑. 𝟓 ≤ 𝒙 ≤ 𝟒. 𝟎 5 10 𝟒. 𝟎 ≤ 𝒙 ≤ 𝟒. 𝟓 3 13 𝟒. 𝟓 ≤ 𝒙 ≤ 𝟓. 𝟎 3 16 𝟓. 𝟎 ≤ 𝒙 ≤ 𝟓. 𝟓 3 19 𝟓. 𝟓 ≤ 𝒙 ≤ 𝟔. 𝟎 1 20
  • 3. 2013/05/07 3 OGIVE 0 5 10 15 20 25 2.5 3 3.5 4 4.5 5 5.5 6 Cumulative Frequency Cumulative Frequency Pictogram: Net Worthof America'sRichest Billionaires Pie Chart: Average Annual Expenses in a U.S. Household EXAMPLE In a class with 30 pupils there are 12 with blue eyes; 9 with brown eyes; 4 with dark brown eyes and 5 with green eyes. 1. Draw a pie chart showing this information. 2. Calculate the fraction and percentage represented by each eye colour. EXAMPLE: SOLUTION Colour of Eyes Frequency Angle at Centre Percentage Blue 12 𝟏𝟐 𝟑𝟎 × 𝟑𝟔𝟎° = 𝟏𝟒𝟒° 𝟏𝟐 𝟑𝟎 × 𝟏𝟎𝟎 = 𝟒𝟎% Brown 9 𝟗 𝟑𝟎 × 𝟑𝟔𝟎° = 𝟏𝟎𝟖° 𝟗 𝟑𝟎 × 𝟏𝟎𝟎 = 𝟑𝟎% Dark Brown 4 𝟒 𝟑𝟎 × 𝟑𝟔𝟎° = 𝟒𝟖° 𝟒 𝟑𝟎 × 𝟏𝟎𝟎 = 𝟏𝟑, 𝟑% Green 5 𝟓 𝟑𝟎 × 𝟑𝟔𝟎° = 𝟔𝟎° 𝟓 𝟑𝟎 × 𝟏𝟎𝟎 = 𝟏𝟔, 𝟕% Total 30 𝟑𝟔𝟎° 𝟏𝟎𝟎% PIE CHART Blue Brown Dark Brown Green
  • 4. 2013/05/07 4 Bar Graph: Expected U.S. PopulationAged 100 and Over DoubleBar Graph: Fuel Efficiency LineGraph: Effectof Inflationon the Valueof a $100,000 LifeInsurance Policy DoubleLineGraph: Populationsof Californiaand Texas Stem-and-Leaf Plot Represent the data below in a stem-and-leaf plot: 152; 165; 143; 139; 138; 144; 150; 158; 161; 157; 143; 156; 162; 165; 139; 158; 151; 167; 166; 160; 170; 132; 145; 151; 148; 147; 171; 155; 146; 141. Stem-and-Leaf Plot STEM LEAVES 13 9; 8; 9; 2 14 3; 4; 3; 5; 8; 7; 6; 1 15 2; 0; 8; 7; 6; 8; 1; 1; 5 16 5; 1; 2; 5; 7; 6; 0 17 0; 1