SlideShare une entreprise Scribd logo
1  sur  4
2013/05/07
1
STATISTICS
X-Kit Textbook
Chapter 8 (Making sense of Sample Data)
Precalculus Textbook
Appendix B: Concepts in Statistics
Par B.1 (Representing Data)
ORGANISE& SUMMARISERAW DATA
Raw Data
Discrete Data
Ungrouped
Frequency
Table
Grouped (low
frequency)
Continuous
Data
Grouped
Frequency
Table
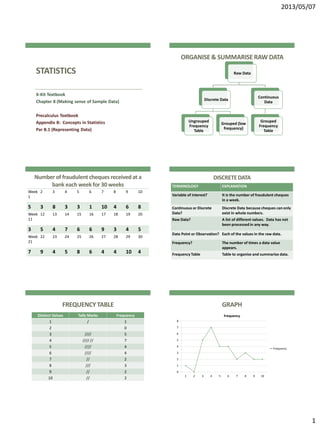
Number of fraudulent cheques receivedat a
bank each week for 30 weeks
Week
1
2 3 4 5 6 7 8 9 10
5 3 8 3 3 1 10 4 6 8
Week
11
12 13 14 15 16 17 18 19 20
3 5 4 7 6 6 9 3 4 5
Week
21
22 23 24 25 26 27 28 29 30
7 9 4 5 8 6 4 4 10 4
DISCRETEDATA
TERMINOLOGY EXPLANATION
Variable of Interest? It is the number of fraudulent cheques
in a week.
Continuous or Discrete
Data?
Discrete Data because cheques can only
exist in whole numbers.
Raw Data? A list of different values. Data has not
been processed in any way.
Data Point or Observation? Each of the values in the raw data.
Frequency? The number of times a data value
appears.
Frequency Table Table to organise and summarise data.
FREQUENCYTABLE
Distinct Values Tally Marks Frequency
1 / 1
2 0
3 //// 5
4 //// // 7
5 //// 4
6 //// 4
7 // 2
8 /// 3
9 // 2
10 // 2
GRAPH
0
1
2
3
4
5
6
7
8
1 2 3 4 5 6 7 8 9 10
Frequency
Frequency
2013/05/07
2
Truck Data: weights(in tonnes) of 20 fully
loaded trucks
Truck
1
2 3 4 5 6 7 8 9 10
Weight
4.54
3.81 4.29 5.16 2.51 4.63 4.75 3.98 5.04 2.80
Truck
11
12 13 14 15 16 17 18 19 20
Weight
2.52
5.88 2.95 3.59 3.87 4.17 3.30 5.48 4.26 3.53
CONTINUOUSDATA
TERMINOLOGY EXPLANATION
Variable of Interest? The weight of a loaded truck.
Continuous or Discrete
Data?
Continuous Data, you can get any
number of values between two
given values.
Frequency Table Table to organise and summarise
data.
Grouped Frequency Table
FREQUENCYTABLE
Class Intervals Tally Marks Frequency
𝟐. 𝟓 ≤ 𝒙 ≤ 𝟑. 𝟎 //// 4
𝟑. 𝟎 ≤ 𝒙 ≤ 𝟑. 𝟓 / 1
𝟑. 𝟓 ≤ 𝒙 ≤ 𝟒. 𝟎 //// 5
𝟒. 𝟎 ≤ 𝒙 ≤ 𝟒. 𝟓 /// 3
𝟒. 𝟓 ≤ 𝒙 ≤ 𝟓. 𝟎 /// 3
𝟓. 𝟎 ≤ 𝒙 ≤ 𝟓. 𝟓 // 2
𝟓. 𝟓 ≤ 𝒙 ≤ 𝟔. 𝟎 // 2
GRAPH
0
1
2
3
4
5
6
0 - 2.5 2.5 - 3.0 3.0 - 3.5 3.5 - 4.0 4.0 - 4.5 4.5 - 5.0 5.0 - 5.5 5.5 - 6.0
Frequency
Frequency
PRESENTATIONOF DATA
Frequency
Table
Pictogram
Bar
Graphs
Histogram
Pie
Chart
Line
Graphs
Stem-and-
Leaf
Ogive
FREQUENCYTABLE
Class Intervals Frequency Cumulative
Frequency
𝟐. 𝟓 ≤ 𝒙 ≤ 𝟑. 𝟎 4 4
𝟑. 𝟎 ≤ 𝒙 ≤ 𝟑. 𝟓 1 5
𝟑. 𝟓 ≤ 𝒙 ≤ 𝟒. 𝟎 5 10
𝟒. 𝟎 ≤ 𝒙 ≤ 𝟒. 𝟓 3 13
𝟒. 𝟓 ≤ 𝒙 ≤ 𝟓. 𝟎 3 16
𝟓. 𝟎 ≤ 𝒙 ≤ 𝟓. 𝟓 3 19
𝟓. 𝟓 ≤ 𝒙 ≤ 𝟔. 𝟎 1 20
2013/05/07
3
OGIVE
0
5
10
15
20
25
2.5 3 3.5 4 4.5 5 5.5 6
Cumulative Frequency
Pictogram: Net Worthof America'sRichest Billionaires
Pie Chart: Average Annual Expenses in a U.S. Household
EXAMPLE
In a class with 30 pupils there are 12 with
blue eyes; 9 with brown eyes; 4 with dark
brown eyes and 5 with green eyes.
1. Draw a pie chart showing this
information.
2. Calculate the fraction and percentage
represented by each eye colour.
EXAMPLE: SOLUTION
Colour of
Eyes
Frequency Angle at Centre Percentage
Blue 12 𝟏𝟐
𝟑𝟎
× 𝟑𝟔𝟎°
= 𝟏𝟒𝟒°
𝟏𝟐
𝟑𝟎
× 𝟏𝟎𝟎 = 𝟒𝟎%
Brown 9 𝟗
𝟑𝟎
× 𝟑𝟔𝟎°
= 𝟏𝟎𝟖°
𝟗
𝟑𝟎
× 𝟏𝟎𝟎 = 𝟑𝟎%
Dark Brown 4 𝟒
𝟑𝟎
× 𝟑𝟔𝟎°
= 𝟒𝟖°
𝟒
𝟑𝟎
× 𝟏𝟎𝟎 = 𝟏𝟑, 𝟑%
Green 5 𝟓
𝟑𝟎
× 𝟑𝟔𝟎°
= 𝟔𝟎°
𝟓
𝟑𝟎
× 𝟏𝟎𝟎 = 𝟏𝟔, 𝟕%
Total 30 𝟑𝟔𝟎° 𝟏𝟎𝟎%
PIE CHART
Blue
Brown
Dark Brown
Green
2013/05/07
4
Bar Graph: Expected U.S. PopulationAged 100 and Over DoubleBar Graph: Fuel Efficiency
LineGraph: Effectof Inflationon the Valueof a $100,000
LifeInsurance Policy
DoubleLineGraph: Populationsof Californiaand Texas
Stem-and-Leaf Plot
Represent the data below in a stem-and-leaf plot:
152; 165; 143; 139; 138;
144; 150; 158; 161; 157;
143; 156; 162; 165; 139;
158; 151; 167; 166; 160;
170; 132; 145; 151; 148;
147; 171; 155; 146; 141.
Stem-and-Leaf Plot
STEM LEAVES
13 9; 8; 9; 2
14 3; 4; 3; 5; 8; 7; 6; 1
15 2; 0; 8; 7; 6; 8; 1; 1; 5
16 5; 1; 2; 5; 7; 6; 0
17 0; 1

Contenu connexe

En vedette

Other operations with exponents
Other operations with exponentsOther operations with exponents
Other operations with exponentsEdTechonGC Mallett
 
Chapter 7 future value annuities
Chapter 7 future value annuitiesChapter 7 future value annuities
Chapter 7 future value annuitiesME MALULEKE
 
Chapter 8 making sense of sample data
Chapter 8 making sense of sample dataChapter 8 making sense of sample data
Chapter 8 making sense of sample dataME MALULEKE
 
Guatemala Presentation
Guatemala PresentationGuatemala Presentation
Guatemala Presentationandramlowe
 
Chapter 5 more about interest edulink
Chapter 5 more about interest edulinkChapter 5 more about interest edulink
Chapter 5 more about interest edulinkME MALULEKE
 
Module 4 lesson 22
Module 4 lesson 22Module 4 lesson 22
Module 4 lesson 22mlabuski
 
Mayan Center for Peace: Guatemala to Minnesota
Mayan Center for Peace:  Guatemala to MinnesotaMayan Center for Peace:  Guatemala to Minnesota
Mayan Center for Peace: Guatemala to Minnesotaadam.utley
 
Guatemala Presentation
Guatemala PresentationGuatemala Presentation
Guatemala Presentationandramlowe
 

En vedette (9)

Other operations with exponents
Other operations with exponentsOther operations with exponents
Other operations with exponents
 
Chapter 7 future value annuities
Chapter 7 future value annuitiesChapter 7 future value annuities
Chapter 7 future value annuities
 
Exponents)
Exponents)Exponents)
Exponents)
 
Chapter 8 making sense of sample data
Chapter 8 making sense of sample dataChapter 8 making sense of sample data
Chapter 8 making sense of sample data
 
Guatemala Presentation
Guatemala PresentationGuatemala Presentation
Guatemala Presentation
 
Chapter 5 more about interest edulink
Chapter 5 more about interest edulinkChapter 5 more about interest edulink
Chapter 5 more about interest edulink
 
Module 4 lesson 22
Module 4 lesson 22Module 4 lesson 22
Module 4 lesson 22
 
Mayan Center for Peace: Guatemala to Minnesota
Mayan Center for Peace:  Guatemala to MinnesotaMayan Center for Peace:  Guatemala to Minnesota
Mayan Center for Peace: Guatemala to Minnesota
 
Guatemala Presentation
Guatemala PresentationGuatemala Presentation
Guatemala Presentation
 

Similaire à Making Sense of Sample Data

maft0a2_Statistics_lecture2_2021.pptx
maft0a2_Statistics_lecture2_2021.pptxmaft0a2_Statistics_lecture2_2021.pptx
maft0a2_Statistics_lecture2_2021.pptxTshegofatso Mphake
 
Willie Evangelista - Presentation of data
Willie Evangelista -  Presentation of data Willie Evangelista -  Presentation of data
Willie Evangelista - Presentation of data Willie Evangelista
 
Presentationofdata 120111034007-phpapp02
Presentationofdata 120111034007-phpapp02Presentationofdata 120111034007-phpapp02
Presentationofdata 120111034007-phpapp02Alex Robianes Hernandez
 
20- Tabular & Graphical Presentation of data(UG2017-18).ppt
20- Tabular & Graphical Presentation of data(UG2017-18).ppt20- Tabular & Graphical Presentation of data(UG2017-18).ppt
20- Tabular & Graphical Presentation of data(UG2017-18).pptaibakimito
 
20- Tabular & Graphical Presentation of data(UG2017-18).ppt
20- Tabular & Graphical Presentation of data(UG2017-18).ppt20- Tabular & Graphical Presentation of data(UG2017-18).ppt
20- Tabular & Graphical Presentation of data(UG2017-18).pptRAJESHKUMAR428748
 
Stat 200 week 6 homework problems9.1.2 many high school student
Stat 200 week 6 homework problems9.1.2 many high school studentStat 200 week 6 homework problems9.1.2 many high school student
Stat 200 week 6 homework problems9.1.2 many high school studentrock73
 
Type of data @ web mining discussion
Type of data @ web mining discussionType of data @ web mining discussion
Type of data @ web mining discussionCherryBerry2
 
Type of data @ Web Mining Discussion
Type of data @ Web Mining DiscussionType of data @ Web Mining Discussion
Type of data @ Web Mining DiscussionCherryBerry2
 
Frequency Tables, Frequency Distributions, and Graphic Presentation
Frequency Tables, Frequency Distributions, and Graphic PresentationFrequency Tables, Frequency Distributions, and Graphic Presentation
Frequency Tables, Frequency Distributions, and Graphic PresentationConflagratioNal Jahid
 
Algebra unit 9.2
Algebra unit 9.2Algebra unit 9.2
Algebra unit 9.2Mark Ryder
 
2 biostatistics presenting data
2  biostatistics presenting data2  biostatistics presenting data
2 biostatistics presenting dataDr. Nazar Jaf
 
Penggambaran Data dengan Grafik
Penggambaran Data dengan GrafikPenggambaran Data dengan Grafik
Penggambaran Data dengan Grafikanom0164
 
03 ch ken black solution
03 ch ken black solution03 ch ken black solution
03 ch ken black solutionKrunal Shah
 
frequency distribution
 frequency distribution frequency distribution
frequency distributionUnsa Shakir
 
Graphs that Enlighten and Graphs that Deceive
Graphs that Enlighten and Graphs that DeceiveGraphs that Enlighten and Graphs that Deceive
Graphs that Enlighten and Graphs that DeceiveLong Beach City College
 
Basic Stat Notes
Basic Stat NotesBasic Stat Notes
Basic Stat Notesroopcool
 
Teoria y problemas de tabla de frecuencias tf221 ccesa007
Teoria y problemas de tabla de frecuencias  tf221  ccesa007Teoria y problemas de tabla de frecuencias  tf221  ccesa007
Teoria y problemas de tabla de frecuencias tf221 ccesa007Demetrio Ccesa Rayme
 

Similaire à Making Sense of Sample Data (20)

maft0a2_Statistics_lecture2_2021.pptx
maft0a2_Statistics_lecture2_2021.pptxmaft0a2_Statistics_lecture2_2021.pptx
maft0a2_Statistics_lecture2_2021.pptx
 
Willie Evangelista - Presentation of data
Willie Evangelista -  Presentation of data Willie Evangelista -  Presentation of data
Willie Evangelista - Presentation of data
 
Presentationofdata 120111034007-phpapp02
Presentationofdata 120111034007-phpapp02Presentationofdata 120111034007-phpapp02
Presentationofdata 120111034007-phpapp02
 
20- Tabular & Graphical Presentation of data(UG2017-18).ppt
20- Tabular & Graphical Presentation of data(UG2017-18).ppt20- Tabular & Graphical Presentation of data(UG2017-18).ppt
20- Tabular & Graphical Presentation of data(UG2017-18).ppt
 
20- Tabular & Graphical Presentation of data(UG2017-18).ppt
20- Tabular & Graphical Presentation of data(UG2017-18).ppt20- Tabular & Graphical Presentation of data(UG2017-18).ppt
20- Tabular & Graphical Presentation of data(UG2017-18).ppt
 
Stat 200 week 6 homework problems9.1.2 many high school student
Stat 200 week 6 homework problems9.1.2 many high school studentStat 200 week 6 homework problems9.1.2 many high school student
Stat 200 week 6 homework problems9.1.2 many high school student
 
Type of data @ web mining discussion
Type of data @ web mining discussionType of data @ web mining discussion
Type of data @ web mining discussion
 
Type of data @ Web Mining Discussion
Type of data @ Web Mining DiscussionType of data @ Web Mining Discussion
Type of data @ Web Mining Discussion
 
Frequency Tables, Frequency Distributions, and Graphic Presentation
Frequency Tables, Frequency Distributions, and Graphic PresentationFrequency Tables, Frequency Distributions, and Graphic Presentation
Frequency Tables, Frequency Distributions, and Graphic Presentation
 
statistic.ppt
statistic.pptstatistic.ppt
statistic.ppt
 
Algebra unit 9.2
Algebra unit 9.2Algebra unit 9.2
Algebra unit 9.2
 
2 biostatistics presenting data
2  biostatistics presenting data2  biostatistics presenting data
2 biostatistics presenting data
 
Penggambaran Data dengan Grafik
Penggambaran Data dengan GrafikPenggambaran Data dengan Grafik
Penggambaran Data dengan Grafik
 
03 ch ken black solution
03 ch ken black solution03 ch ken black solution
03 ch ken black solution
 
Data presentation
Data presentationData presentation
Data presentation
 
frequency distribution
 frequency distribution frequency distribution
frequency distribution
 
Graphs that Enlighten and Graphs that Deceive
Graphs that Enlighten and Graphs that DeceiveGraphs that Enlighten and Graphs that Deceive
Graphs that Enlighten and Graphs that Deceive
 
Basic Stat Notes
Basic Stat NotesBasic Stat Notes
Basic Stat Notes
 
Freq & Histo
Freq & HistoFreq & Histo
Freq & Histo
 
Teoria y problemas de tabla de frecuencias tf221 ccesa007
Teoria y problemas de tabla de frecuencias  tf221  ccesa007Teoria y problemas de tabla de frecuencias  tf221  ccesa007
Teoria y problemas de tabla de frecuencias tf221 ccesa007
 

Dernier

Technology industry / Finnish economic outlook
Technology industry / Finnish economic outlookTechnology industry / Finnish economic outlook
Technology industry / Finnish economic outlookTechFinland
 
劳伦森大学毕业证
劳伦森大学毕业证劳伦森大学毕业证
劳伦森大学毕业证yyawb
 
fundamentals of corporate finance 11th canadian edition test bank.docx
fundamentals of corporate finance 11th canadian edition test bank.docxfundamentals of corporate finance 11th canadian edition test bank.docx
fundamentals of corporate finance 11th canadian edition test bank.docxssuserf63bd7
 
Economics Presentation-2.pdf xxjshshsjsjsjwjw
Economics Presentation-2.pdf xxjshshsjsjsjwjwEconomics Presentation-2.pdf xxjshshsjsjsjwjw
Economics Presentation-2.pdf xxjshshsjsjsjwjwmordockmatt25
 
20240419-SMC-submission-Annual-Superannuation-Performance-Test-–-design-optio...
20240419-SMC-submission-Annual-Superannuation-Performance-Test-–-design-optio...20240419-SMC-submission-Annual-Superannuation-Performance-Test-–-design-optio...
20240419-SMC-submission-Annual-Superannuation-Performance-Test-–-design-optio...Henry Tapper
 
cost-volume-profit analysis.ppt(managerial accounting).pptx
cost-volume-profit analysis.ppt(managerial accounting).pptxcost-volume-profit analysis.ppt(managerial accounting).pptx
cost-volume-profit analysis.ppt(managerial accounting).pptxazadalisthp2020i
 
Explore Dual Citizenship in Africa | Citizenship Benefits & Requirements
Explore Dual Citizenship in Africa | Citizenship Benefits & RequirementsExplore Dual Citizenship in Africa | Citizenship Benefits & Requirements
Explore Dual Citizenship in Africa | Citizenship Benefits & Requirementsmarketingkingdomofku
 
Strategic Resources May 2024 Corporate Presentation
Strategic Resources May 2024 Corporate PresentationStrategic Resources May 2024 Corporate Presentation
Strategic Resources May 2024 Corporate PresentationAdnet Communications
 
Avoidable Errors in Payroll Compliance for Payroll Services Providers - Globu...
Avoidable Errors in Payroll Compliance for Payroll Services Providers - Globu...Avoidable Errors in Payroll Compliance for Payroll Services Providers - Globu...
Avoidable Errors in Payroll Compliance for Payroll Services Providers - Globu...globusfinanza
 
Stock Market Brief Deck (Under Pressure).pdf
Stock Market Brief Deck (Under Pressure).pdfStock Market Brief Deck (Under Pressure).pdf
Stock Market Brief Deck (Under Pressure).pdfMichael Silva
 
MASTERING FOREX: STRATEGIES FOR SUCCESS.pdf
MASTERING FOREX: STRATEGIES FOR SUCCESS.pdfMASTERING FOREX: STRATEGIES FOR SUCCESS.pdf
MASTERING FOREX: STRATEGIES FOR SUCCESS.pdfCocity Enterprises
 
logistics industry development power point ppt.pdf
logistics industry development power point ppt.pdflogistics industry development power point ppt.pdf
logistics industry development power point ppt.pdfSalimullah13
 
Abortion pills in Saudi Arabia (+919707899604)cytotec pills in dammam
Abortion pills in Saudi Arabia (+919707899604)cytotec pills in dammamAbortion pills in Saudi Arabia (+919707899604)cytotec pills in dammam
Abortion pills in Saudi Arabia (+919707899604)cytotec pills in dammamsamsungultra782445
 
NO1 Verified Online Love Vashikaran Specialist Kala Jadu Expert Specialist In...
NO1 Verified Online Love Vashikaran Specialist Kala Jadu Expert Specialist In...NO1 Verified Online Love Vashikaran Specialist Kala Jadu Expert Specialist In...
NO1 Verified Online Love Vashikaran Specialist Kala Jadu Expert Specialist In...sarkh428
 
Seeman_Fiintouch_LLP_Newsletter_May-2024.pdf
Seeman_Fiintouch_LLP_Newsletter_May-2024.pdfSeeman_Fiintouch_LLP_Newsletter_May-2024.pdf
Seeman_Fiintouch_LLP_Newsletter_May-2024.pdfAshis Kumar Dey
 
Famous Kala Jadu, Black magic expert in Faisalabad and Kala ilam specialist i...
Famous Kala Jadu, Black magic expert in Faisalabad and Kala ilam specialist i...Famous Kala Jadu, Black magic expert in Faisalabad and Kala ilam specialist i...
Famous Kala Jadu, Black magic expert in Faisalabad and Kala ilam specialist i...batoole333
 
uk-no 1 kala ilam expert specialist in uk and qatar kala ilam expert speciali...
uk-no 1 kala ilam expert specialist in uk and qatar kala ilam expert speciali...uk-no 1 kala ilam expert specialist in uk and qatar kala ilam expert speciali...
uk-no 1 kala ilam expert specialist in uk and qatar kala ilam expert speciali...batoole333
 
Shrambal_Distributors_Newsletter_May-2024.pdf
Shrambal_Distributors_Newsletter_May-2024.pdfShrambal_Distributors_Newsletter_May-2024.pdf
Shrambal_Distributors_Newsletter_May-2024.pdfvikashdidwania1
 
Responsible Finance Principles and Implication
Responsible Finance Principles and ImplicationResponsible Finance Principles and Implication
Responsible Finance Principles and ImplicationNghiaPham100
 

Dernier (20)

Technology industry / Finnish economic outlook
Technology industry / Finnish economic outlookTechnology industry / Finnish economic outlook
Technology industry / Finnish economic outlook
 
劳伦森大学毕业证
劳伦森大学毕业证劳伦森大学毕业证
劳伦森大学毕业证
 
fundamentals of corporate finance 11th canadian edition test bank.docx
fundamentals of corporate finance 11th canadian edition test bank.docxfundamentals of corporate finance 11th canadian edition test bank.docx
fundamentals of corporate finance 11th canadian edition test bank.docx
 
Economics Presentation-2.pdf xxjshshsjsjsjwjw
Economics Presentation-2.pdf xxjshshsjsjsjwjwEconomics Presentation-2.pdf xxjshshsjsjsjwjw
Economics Presentation-2.pdf xxjshshsjsjsjwjw
 
20240419-SMC-submission-Annual-Superannuation-Performance-Test-–-design-optio...
20240419-SMC-submission-Annual-Superannuation-Performance-Test-–-design-optio...20240419-SMC-submission-Annual-Superannuation-Performance-Test-–-design-optio...
20240419-SMC-submission-Annual-Superannuation-Performance-Test-–-design-optio...
 
cost-volume-profit analysis.ppt(managerial accounting).pptx
cost-volume-profit analysis.ppt(managerial accounting).pptxcost-volume-profit analysis.ppt(managerial accounting).pptx
cost-volume-profit analysis.ppt(managerial accounting).pptx
 
Explore Dual Citizenship in Africa | Citizenship Benefits & Requirements
Explore Dual Citizenship in Africa | Citizenship Benefits & RequirementsExplore Dual Citizenship in Africa | Citizenship Benefits & Requirements
Explore Dual Citizenship in Africa | Citizenship Benefits & Requirements
 
Strategic Resources May 2024 Corporate Presentation
Strategic Resources May 2024 Corporate PresentationStrategic Resources May 2024 Corporate Presentation
Strategic Resources May 2024 Corporate Presentation
 
Avoidable Errors in Payroll Compliance for Payroll Services Providers - Globu...
Avoidable Errors in Payroll Compliance for Payroll Services Providers - Globu...Avoidable Errors in Payroll Compliance for Payroll Services Providers - Globu...
Avoidable Errors in Payroll Compliance for Payroll Services Providers - Globu...
 
Stock Market Brief Deck (Under Pressure).pdf
Stock Market Brief Deck (Under Pressure).pdfStock Market Brief Deck (Under Pressure).pdf
Stock Market Brief Deck (Under Pressure).pdf
 
MASTERING FOREX: STRATEGIES FOR SUCCESS.pdf
MASTERING FOREX: STRATEGIES FOR SUCCESS.pdfMASTERING FOREX: STRATEGIES FOR SUCCESS.pdf
MASTERING FOREX: STRATEGIES FOR SUCCESS.pdf
 
logistics industry development power point ppt.pdf
logistics industry development power point ppt.pdflogistics industry development power point ppt.pdf
logistics industry development power point ppt.pdf
 
W.D. Gann Theory Complete Information.pdf
W.D. Gann Theory Complete Information.pdfW.D. Gann Theory Complete Information.pdf
W.D. Gann Theory Complete Information.pdf
 
Abortion pills in Saudi Arabia (+919707899604)cytotec pills in dammam
Abortion pills in Saudi Arabia (+919707899604)cytotec pills in dammamAbortion pills in Saudi Arabia (+919707899604)cytotec pills in dammam
Abortion pills in Saudi Arabia (+919707899604)cytotec pills in dammam
 
NO1 Verified Online Love Vashikaran Specialist Kala Jadu Expert Specialist In...
NO1 Verified Online Love Vashikaran Specialist Kala Jadu Expert Specialist In...NO1 Verified Online Love Vashikaran Specialist Kala Jadu Expert Specialist In...
NO1 Verified Online Love Vashikaran Specialist Kala Jadu Expert Specialist In...
 
Seeman_Fiintouch_LLP_Newsletter_May-2024.pdf
Seeman_Fiintouch_LLP_Newsletter_May-2024.pdfSeeman_Fiintouch_LLP_Newsletter_May-2024.pdf
Seeman_Fiintouch_LLP_Newsletter_May-2024.pdf
 
Famous Kala Jadu, Black magic expert in Faisalabad and Kala ilam specialist i...
Famous Kala Jadu, Black magic expert in Faisalabad and Kala ilam specialist i...Famous Kala Jadu, Black magic expert in Faisalabad and Kala ilam specialist i...
Famous Kala Jadu, Black magic expert in Faisalabad and Kala ilam specialist i...
 
uk-no 1 kala ilam expert specialist in uk and qatar kala ilam expert speciali...
uk-no 1 kala ilam expert specialist in uk and qatar kala ilam expert speciali...uk-no 1 kala ilam expert specialist in uk and qatar kala ilam expert speciali...
uk-no 1 kala ilam expert specialist in uk and qatar kala ilam expert speciali...
 
Shrambal_Distributors_Newsletter_May-2024.pdf
Shrambal_Distributors_Newsletter_May-2024.pdfShrambal_Distributors_Newsletter_May-2024.pdf
Shrambal_Distributors_Newsletter_May-2024.pdf
 
Responsible Finance Principles and Implication
Responsible Finance Principles and ImplicationResponsible Finance Principles and Implication
Responsible Finance Principles and Implication
 

Making Sense of Sample Data

  • 1. 2013/05/07 1 STATISTICS X-Kit Textbook Chapter 8 (Making sense of Sample Data) Precalculus Textbook Appendix B: Concepts in Statistics Par B.1 (Representing Data) ORGANISE& SUMMARISERAW DATA Raw Data Discrete Data Ungrouped Frequency Table Grouped (low frequency) Continuous Data Grouped Frequency Table Number of fraudulent cheques receivedat a bank each week for 30 weeks Week 1 2 3 4 5 6 7 8 9 10 5 3 8 3 3 1 10 4 6 8 Week 11 12 13 14 15 16 17 18 19 20 3 5 4 7 6 6 9 3 4 5 Week 21 22 23 24 25 26 27 28 29 30 7 9 4 5 8 6 4 4 10 4 DISCRETEDATA TERMINOLOGY EXPLANATION Variable of Interest? It is the number of fraudulent cheques in a week. Continuous or Discrete Data? Discrete Data because cheques can only exist in whole numbers. Raw Data? A list of different values. Data has not been processed in any way. Data Point or Observation? Each of the values in the raw data. Frequency? The number of times a data value appears. Frequency Table Table to organise and summarise data. FREQUENCYTABLE Distinct Values Tally Marks Frequency 1 / 1 2 0 3 //// 5 4 //// // 7 5 //// 4 6 //// 4 7 // 2 8 /// 3 9 // 2 10 // 2 GRAPH 0 1 2 3 4 5 6 7 8 1 2 3 4 5 6 7 8 9 10 Frequency Frequency
  • 2. 2013/05/07 2 Truck Data: weights(in tonnes) of 20 fully loaded trucks Truck 1 2 3 4 5 6 7 8 9 10 Weight 4.54 3.81 4.29 5.16 2.51 4.63 4.75 3.98 5.04 2.80 Truck 11 12 13 14 15 16 17 18 19 20 Weight 2.52 5.88 2.95 3.59 3.87 4.17 3.30 5.48 4.26 3.53 CONTINUOUSDATA TERMINOLOGY EXPLANATION Variable of Interest? The weight of a loaded truck. Continuous or Discrete Data? Continuous Data, you can get any number of values between two given values. Frequency Table Table to organise and summarise data. Grouped Frequency Table FREQUENCYTABLE Class Intervals Tally Marks Frequency 𝟐. 𝟓 ≤ 𝒙 ≤ 𝟑. 𝟎 //// 4 𝟑. 𝟎 ≤ 𝒙 ≤ 𝟑. 𝟓 / 1 𝟑. 𝟓 ≤ 𝒙 ≤ 𝟒. 𝟎 //// 5 𝟒. 𝟎 ≤ 𝒙 ≤ 𝟒. 𝟓 /// 3 𝟒. 𝟓 ≤ 𝒙 ≤ 𝟓. 𝟎 /// 3 𝟓. 𝟎 ≤ 𝒙 ≤ 𝟓. 𝟓 // 2 𝟓. 𝟓 ≤ 𝒙 ≤ 𝟔. 𝟎 // 2 GRAPH 0 1 2 3 4 5 6 0 - 2.5 2.5 - 3.0 3.0 - 3.5 3.5 - 4.0 4.0 - 4.5 4.5 - 5.0 5.0 - 5.5 5.5 - 6.0 Frequency Frequency PRESENTATIONOF DATA Frequency Table Pictogram Bar Graphs Histogram Pie Chart Line Graphs Stem-and- Leaf Ogive FREQUENCYTABLE Class Intervals Frequency Cumulative Frequency 𝟐. 𝟓 ≤ 𝒙 ≤ 𝟑. 𝟎 4 4 𝟑. 𝟎 ≤ 𝒙 ≤ 𝟑. 𝟓 1 5 𝟑. 𝟓 ≤ 𝒙 ≤ 𝟒. 𝟎 5 10 𝟒. 𝟎 ≤ 𝒙 ≤ 𝟒. 𝟓 3 13 𝟒. 𝟓 ≤ 𝒙 ≤ 𝟓. 𝟎 3 16 𝟓. 𝟎 ≤ 𝒙 ≤ 𝟓. 𝟓 3 19 𝟓. 𝟓 ≤ 𝒙 ≤ 𝟔. 𝟎 1 20
  • 3. 2013/05/07 3 OGIVE 0 5 10 15 20 25 2.5 3 3.5 4 4.5 5 5.5 6 Cumulative Frequency Cumulative Frequency Pictogram: Net Worthof America'sRichest Billionaires Pie Chart: Average Annual Expenses in a U.S. Household EXAMPLE In a class with 30 pupils there are 12 with blue eyes; 9 with brown eyes; 4 with dark brown eyes and 5 with green eyes. 1. Draw a pie chart showing this information. 2. Calculate the fraction and percentage represented by each eye colour. EXAMPLE: SOLUTION Colour of Eyes Frequency Angle at Centre Percentage Blue 12 𝟏𝟐 𝟑𝟎 × 𝟑𝟔𝟎° = 𝟏𝟒𝟒° 𝟏𝟐 𝟑𝟎 × 𝟏𝟎𝟎 = 𝟒𝟎% Brown 9 𝟗 𝟑𝟎 × 𝟑𝟔𝟎° = 𝟏𝟎𝟖° 𝟗 𝟑𝟎 × 𝟏𝟎𝟎 = 𝟑𝟎% Dark Brown 4 𝟒 𝟑𝟎 × 𝟑𝟔𝟎° = 𝟒𝟖° 𝟒 𝟑𝟎 × 𝟏𝟎𝟎 = 𝟏𝟑, 𝟑% Green 5 𝟓 𝟑𝟎 × 𝟑𝟔𝟎° = 𝟔𝟎° 𝟓 𝟑𝟎 × 𝟏𝟎𝟎 = 𝟏𝟔, 𝟕% Total 30 𝟑𝟔𝟎° 𝟏𝟎𝟎% PIE CHART Blue Brown Dark Brown Green
  • 4. 2013/05/07 4 Bar Graph: Expected U.S. PopulationAged 100 and Over DoubleBar Graph: Fuel Efficiency LineGraph: Effectof Inflationon the Valueof a $100,000 LifeInsurance Policy DoubleLineGraph: Populationsof Californiaand Texas Stem-and-Leaf Plot Represent the data below in a stem-and-leaf plot: 152; 165; 143; 139; 138; 144; 150; 158; 161; 157; 143; 156; 162; 165; 139; 158; 151; 167; 166; 160; 170; 132; 145; 151; 148; 147; 171; 155; 146; 141. Stem-and-Leaf Plot STEM LEAVES 13 9; 8; 9; 2 14 3; 4; 3; 5; 8; 7; 6; 1 15 2; 0; 8; 7; 6; 8; 1; 1; 5 16 5; 1; 2; 5; 7; 6; 0 17 0; 1