SlideShare une entreprise Scribd logo
1  sur  3
Télécharger pour lire hors ligne
For immediate release

                                   Home Sales Edge Higher in September

   Vancouver, BC – October 14, 2011. The British Columbia Real Estate Association (BCREA)
   reports that Multiple Listing Service® (MLS®) residential unit sales in the province rose 8.8 per
   cent to 5995 units in September compared to the same month last year. The average MLS®
   residential price increased 6 per cent to $523,568 last month compared to September 2010.

   “MLS® home sales edged up 3 per cent in                                                 MLS® Residential Sales
   September compared to August on a seasonally
   adjusted basis,” said Cameron Muir, BCREA
                                                                                                       British Columbia
                                                                             Units
   Chief Economist. “Housing demand last month                               10,000
                                                                                                         Seasonally Adjusted

   was bolstered by persistent low mortgage interest                          9,000
                                                                              8,000
   rates and a surge in employment.”
                                                                              7,000
                                                                              6,000
   “Despite a modest gain in unit sales, total active                         5,000
   residential listings in the province remained                              4,000
   elevated in September,” added Muir. A total of                             3,000
                                                                                   2005      2006       2007   2008     2009   2010   2011
   55,616 homes were listed on the MLS® in the
                                                                             Source: BCREA Economics
   province at the end of September.

   Year-to-date, BC residential sales dollar volume increased 17.5 per cent to $34.8 billion,
   compared to the same period last year. Residential unit sales increased 3.2 per cent to 61,127
   units, while the average MLS® residential price rose 13.9 per cent to $569,922 over the same
   period.

                                                                -30-

   For more information, please contact:
   Cameron Muir                                                     Damian Stathonikos
   Chief Economist                                                  Director, Communications and Public Affairs
   Direct: 604.742.2780                                             Direct: 604.742.2793
   Mobile: 778.229.1884                                             Mobile: 778.990.1320
   Email: cmuir@bcrea.bc.ca                                         Email: dstathonikos@bcrea.bc.ca


   For detailed statistical information, contact your local real estate board.


1420 – 701 Georgia Street W, PO Box 10123, Pacific Centre, Vancouver, BC V7Y 1C6
President Rick Valouche       |   Vice President Jim McCaughan           |    bcrea@bcrea.bc.ca            |   604.683.7702 (tel)
Past President Moss Moloney   |   Chief Executive Officer Robert Laing   |    www.bcrea.bc.ca              |   604.683.8601 (fax)
Home Sales Edge Higher in September . . . Page 2


                               September 2011 Residential Average Price, Active Listings and
                                          Sales-to-Active-Listings Data by Board
                                      Average Price                                     Active Listings                      Sales-to-Active-Listings
                                                                         September           September                     September         September
                       September           September
                                                                           2011                 2010                          2011             2010
                          2011                2010
      Board                                                % change      Residential         Residential      %           Residential        Residential
                       Residential         Residential
                                                                           Active              Active       change       Sales to Active Sales to Active
                      Average Price       Average Price
                                                                          Listings            Listings                      Listings          Listings
                           ($)                 ($)
                                                                          (Units)              (Units)                         (%)              (%)
BC Northern             215,215           200,140              7.5         3,047                2,943            3.5          12.0              11.5
Chilliwack              304,913           289,209              5.4         1,887                1,360           38.7           8.3              10.1
Fraser Valley           489,420           444,997             10.0         8,489                6,939           22.3          13.1              13.9
Greater Vancouver       751,042           679,381             10.5        17,206               16,522            4.1          13.4              13.6
Kamloops                290,706           316,974             -8.3         2,178                2,000            8.9           8.7              9.4
Kootenay                285,725           257,413             11.0         3,386                3,102            9.2           6.4              6.1
Okanagan Mainline       375,593           401,982             -6.6         6,524                6,407            1.8           6.9              6.3
Powell River            211,311           193,077              9.4          263                  224            17.4           9.9              11.6
South Okanagan          299,410           291,587              2.7         2,113                2,147           -1.6           5.8              4.8
    Northern Lights     197,226           181,449              8.7          320                  322            -0.6          18.4              11.2
Vancouver Island        332,741           319,531              4.1         6,192                6,031            2.7           9.2              8.2
Victoria                493,522           485,459              1.7         4,011                3,436           16.7          10.9              11.0
Provincial Totals*      523,568           493,846              6.0        55,616               51,433            8.1          10.8              10.7
           *Numbers may not add due to rounding


                          September 2011 BC Residential Multiple Listing Service® Data by Board
                                            Dollar Volume (000s)                                                       Units
                             September 2011        September 2010                             September 2011           September 2010
           Board
                             Residential Sales     Residential Sales        % change          Residential Sales        Residential Sales   % change
                                    ($)                   ($)                                     (Units)                  (Units)
    BC Northern                   78,554                67,647                   16.1               365                      338              8.0
    Chilliwack                    47,568                39,622                   20.1               156                      137             13.9
    Fraser Valley                542,767               430,312                   26.1              1,109                     967             14.7
    Greater Vancouver           1,726,646                 1,531,324              12.8              2,299                    2,254             2.0
    Kamloops                      55,234                    59,908               -7.8               190                      189              0.5
    Kootenay                      62,002                    48,394               28.1               217                      188             15.4
    Okanagan Mainline            167,890                   161,597               3.9                447                      402             11.2
    Powell River                   5,494                     5,020               9.4                26                        26              0.0
    South Okanagan                36,827                    30,034               22.6               123                      103             19.4
        Northern Lights           11,636                     6,532               78.1               59                        36             63.9
    Vancouver Island             188,997                   157,209               20.2               568                      492             15.4
    Victoria                     215,176                   183,989               17.0               436                      379             15.0
     Provincial Totals*        3,138,791                  2,721,587              15.3              5,995                    5,511             8.8
         * Numbers may not add due to rounding

          **NOTE: The Northern Lights Real Estate Board (NLREB) became part of the South Okanagan Real
          Estate Board (SOREB) on January 1, 2011.


      1420 – 701 Georgia Street W, PO Box 10123, Pacific Centre, Vancouver, BC V7Y 1C6
      President Rick Valouche         |   Vice President Jim McCaughan            |     bcrea@bcrea.bc.ca   |     604.683.7702 (tel)
      Past President Moss Moloney     |   Chief Executive Officer Robert Laing    |     www.bcrea.bc.ca     |     604.683.8601 (fax)
Home Sales Edge Higher in September . . . Page 3


                    September 2011 Year-to-Date BC Residential Multiple Listing Service® Data by Board
                                      Dollar Volume (000s)                                 Unit Sales                             Average Price

       Board
                                                                  %                                       %                                         %
                            2011                 2010                                                                     2011           2010
                                                                change           2011       2010        change                                    change
                             ($)                  ($)                                                                      ($)            ($)

BC Northern                665,662             628,283            5.9        3,028          2,944           2.9         219,836         213,411    3.0
Chilliwack                 484,615             503,610            -3.8       1,616          1,638           -1.3        299,886         307,454    -2.5
Fraser Valley             5,967,440           5,046,812          18.2        11,779         11,191          5.3         506,617         450,971    12.3
Greater Vancouver
                         20,956,066           16,224,999         29.2        26,482         24,276          9.1         791,332         668,356    18.4
Kamloops                   499,660             528,299            -5.4       1,643          1,718           -4.4        304,114         307,508    -1.1
Kootenay                   404,828             444,218            -8.9       1,493          1,610           -7.3        271,151         275,912    -1.7
Okanagan Mainline         1,454,636           1,537,869           -5.4       3,803          3,900           -2.5        382,497         394,325    -3.0
Powell River               55,484               53,186            4.3            247         222            11.3        224,630         239,578    -6.2
South Okanagan             323,611             358,183            -9.7       1,051          1,108           -5.1        307,907         323,270    -4.8
  Northern Lights          76,502               77,586            -1.4           366         370            -1.1        209,022         209,691    -0.3
Vancouver Island          1,670,292           1,750,536           -4.6       5,084          5,308           -4.2        328,539         329,792    -0.4
Victoria                  2,278,815           2,492,337           -8.6       4,535          4,943           -8.3        502,495         504,215    -0.3
Provincial Totals*      34,837,609          29,645,918           17.5        61,127         59,228          3.2         569,922         500,539    13.9
           * Numbers may not add due to rounding

           BCREA represents 11 member real estate boards and their approximately 18,000 REALTORS®
           on all provincial issues, providing an extensive communications network, standard forms,
           economic research and analysis, government relations, applied practice courses and continuing
           professional education (cpe).

           To demonstrate the profession’s commitment to improving Quality of Life in BC communities,
           BCREA supports policies that encourage economic vitality, provide housing opportunities,
           respect the environment and build communities with good schools and safe neighbourhoods.

           For detailed statistical information, contact your local real estate board. MLS® is a cooperative
           marketing system used only by Canada’s real estate boards to ensure maximum exposure of
           properties listed for sale.


      1420 – 701 Georgia Street W, PO Box 10123, Pacific Centre, Vancouver, BC V7Y 1C6
      President Rick Valouche         |   Vice President Jim McCaughan             |    bcrea@bcrea.bc.ca     |    604.683.7702 (tel)
      Past President Moss Moloney     |   Chief Executive Officer Robert Laing     |    www.bcrea.bc.ca       |    604.683.8601 (fax)

Contenu connexe

Tendances (6)

Rebgv stats-pkg-november-2019-f
Rebgv stats-pkg-november-2019-fRebgv stats-pkg-november-2019-f
Rebgv stats-pkg-november-2019-f
 
South Windsor Conditions and Trends
South Windsor Conditions and TrendsSouth Windsor Conditions and Trends
South Windsor Conditions and Trends
 
Real Estate Board of Greater Vancouver Statistics Package November 2020
Real Estate Board of Greater Vancouver Statistics Package November 2020Real Estate Board of Greater Vancouver Statistics Package November 2020
Real Estate Board of Greater Vancouver Statistics Package November 2020
 
Rental report 05-08_10
Rental report 05-08_10Rental report 05-08_10
Rental report 05-08_10
 
K hov.short bio.jun 12
K hov.short bio.jun 12K hov.short bio.jun 12
K hov.short bio.jun 12
 
integrys 2003 wpsr
integrys 2003 wpsrintegrys 2003 wpsr
integrys 2003 wpsr
 

En vedette

Apie atleidima
Apie atleidimaApie atleidima
Apie atleidima
zigius
 
14 Nov 2012 1ABCT Weekly Newsletter
14 Nov  2012 1ABCT Weekly Newsletter14 Nov  2012 1ABCT Weekly Newsletter
14 Nov 2012 1ABCT Weekly Newsletter
Noel Waterman
 
Television and religious activism etc
Television and religious activism etcTelevision and religious activism etc
Television and religious activism etc
Ruth Deller
 
Trabajo de microsf excel
Trabajo de microsf excelTrabajo de microsf excel
Trabajo de microsf excel
adri20eli
 

En vedette (20)

Toy
ToyToy
Toy
 
Apie atleidima
Apie atleidimaApie atleidima
Apie atleidima
 
14 Nov 2012 1ABCT Weekly Newsletter
14 Nov  2012 1ABCT Weekly Newsletter14 Nov  2012 1ABCT Weekly Newsletter
14 Nov 2012 1ABCT Weekly Newsletter
 
Home away from home sjc-shopping-observation lab
Home away from home   sjc-shopping-observation labHome away from home   sjc-shopping-observation lab
Home away from home sjc-shopping-observation lab
 
Ft Riley Winter Guide Dec 2012, Jan and Feb 2013
Ft Riley Winter Guide Dec 2012, Jan and Feb 2013Ft Riley Winter Guide Dec 2012, Jan and Feb 2013
Ft Riley Winter Guide Dec 2012, Jan and Feb 2013
 
3 January 2013 1ABCT Weekly Newsletter
3 January 2013 1ABCT Weekly Newsletter3 January 2013 1ABCT Weekly Newsletter
3 January 2013 1ABCT Weekly Newsletter
 
Bab i
Bab  iBab  i
Bab i
 
Richard I, John and the loss of France
Richard I, John and the loss of FranceRichard I, John and the loss of France
Richard I, John and the loss of France
 
CLOTHES
CLOTHESCLOTHES
CLOTHES
 
Playing nice in the sandbox of life working on a team slides
Playing nice in the sandbox of life working on a team slidesPlaying nice in the sandbox of life working on a team slides
Playing nice in the sandbox of life working on a team slides
 
Television and religious activism etc
Television and religious activism etcTelevision and religious activism etc
Television and religious activism etc
 
01 hardware
01 hardware01 hardware
01 hardware
 
Garchig
GarchigGarchig
Garchig
 
מוזיאון בית גורדון – מחזון למציאות
מוזיאון בית גורדון – מחזון למציאותמוזיאון בית גורדון – מחזון למציאות
מוזיאון בית גורדון – מחזון למציאות
 
Peo Revised Main Website 12 8 10
Peo  Revised Main Website 12 8 10Peo  Revised Main Website 12 8 10
Peo Revised Main Website 12 8 10
 
Standardized testing information
Standardized testing informationStandardized testing information
Standardized testing information
 
Forbes, octubre 2015
Forbes, octubre 2015Forbes, octubre 2015
Forbes, octubre 2015
 
Where we live
Where we liveWhere we live
Where we live
 
Using joins
Using joinsUsing joins
Using joins
 
Trabajo de microsf excel
Trabajo de microsf excelTrabajo de microsf excel
Trabajo de microsf excel
 

Similaire à Home sales edge higher in september 2011

Home sales increased last year january 2012
Home sales increased last year january 2012Home sales increased last year january 2012
Home sales increased last year january 2012
Matt Collinge
 
Bc home sales steady in june 2011
Bc home sales steady in june 2011Bc home sales steady in june 2011
Bc home sales steady in june 2011
Matt Collinge
 
Vancouver real estate stats package, june 2011
Vancouver real estate stats package, june 2011Vancouver real estate stats package, june 2011
Vancouver real estate stats package, june 2011
Matt Collinge
 
Vancouver real estate stats package, December 2011
Vancouver real estate stats package, December 2011Vancouver real estate stats package, December 2011
Vancouver real estate stats package, December 2011
Matt Collinge
 
REBGV Stats Package January 2012
REBGV Stats Package January 2012REBGV Stats Package January 2012
REBGV Stats Package January 2012
vancouverhomesteam
 

Similaire à Home sales edge higher in september 2011 (20)

Tighter regulations trim sales BCREA 2012 09
Tighter regulations trim sales BCREA 2012 09Tighter regulations trim sales BCREA 2012 09
Tighter regulations trim sales BCREA 2012 09
 
Home sales increased last year january 2012
Home sales increased last year january 2012Home sales increased last year january 2012
Home sales increased last year january 2012
 
Bc home sales steady in june 2011
Bc home sales steady in june 2011Bc home sales steady in june 2011
Bc home sales steady in june 2011
 
Vancouver real estate stats package, june 2011
Vancouver real estate stats package, june 2011Vancouver real estate stats package, june 2011
Vancouver real estate stats package, june 2011
 
Vancouver real estate stats package, December 2011
Vancouver real estate stats package, December 2011Vancouver real estate stats package, December 2011
Vancouver real estate stats package, December 2011
 
REBGV Stats for December 2011 Courtesy Mike Stewart Vancouver Realtor
REBGV Stats for December 2011 Courtesy Mike Stewart Vancouver RealtorREBGV Stats for December 2011 Courtesy Mike Stewart Vancouver Realtor
REBGV Stats for December 2011 Courtesy Mike Stewart Vancouver Realtor
 
BC Real Estate Forecast October 2012
BC Real Estate Forecast October 2012BC Real Estate Forecast October 2012
BC Real Estate Forecast October 2012
 
Rebgv stats-pkg-november-2020
Rebgv stats-pkg-november-2020Rebgv stats-pkg-november-2020
Rebgv stats-pkg-november-2020
 
Rebgv stats package%2_c_may_2012_pdf_%282%29
Rebgv stats package%2_c_may_2012_pdf_%282%29Rebgv stats package%2_c_may_2012_pdf_%282%29
Rebgv stats package%2_c_may_2012_pdf_%282%29
 
May 2012 REBGV Stats Package
May 2012 REBGV Stats PackageMay 2012 REBGV Stats Package
May 2012 REBGV Stats Package
 
REBGV Stats Package January 2012
REBGV Stats Package January 2012REBGV Stats Package January 2012
REBGV Stats Package January 2012
 
Vancouver real estate stats package September 2011
Vancouver real estate stats package September 2011Vancouver real estate stats package September 2011
Vancouver real estate stats package September 2011
 
September 2011 REBGV
September 2011 REBGV September 2011 REBGV
September 2011 REBGV
 
REBGV Stats for Sept 2011 Mike Stewart
REBGV Stats for Sept 2011 Mike StewartREBGV Stats for Sept 2011 Mike Stewart
REBGV Stats for Sept 2011 Mike Stewart
 
October 2017 REBGV Stats Mike Stewart Vancouver Realtor
October 2017 REBGV Stats Mike Stewart Vancouver RealtorOctober 2017 REBGV Stats Mike Stewart Vancouver Realtor
October 2017 REBGV Stats Mike Stewart Vancouver Realtor
 
November 2011-rebgv-stats-adam scalena
November 2011-rebgv-stats-adam scalenaNovember 2011-rebgv-stats-adam scalena
November 2011-rebgv-stats-adam scalena
 
R E I Q
R  E  I  QR  E  I  Q
R E I Q
 
Vancouver real estate rebgv stats package january 2011
Vancouver real estate rebgv stats package january 2011Vancouver real estate rebgv stats package january 2011
Vancouver real estate rebgv stats package january 2011
 
September 2017 rebgv statistics package mike stewart realtor
September 2017 rebgv statistics package mike stewart realtorSeptember 2017 rebgv statistics package mike stewart realtor
September 2017 rebgv statistics package mike stewart realtor
 
Rebgv stats-pkg-january-2019
Rebgv stats-pkg-january-2019Rebgv stats-pkg-january-2019
Rebgv stats-pkg-january-2019
 

Plus de Matt Collinge

Cambie+7 preview package
Cambie+7 preview packageCambie+7 preview package
Cambie+7 preview package
Matt Collinge
 
February 2012 Housing Starts in Metro Vancouver
February 2012 Housing Starts in Metro VancouverFebruary 2012 Housing Starts in Metro Vancouver
February 2012 Housing Starts in Metro Vancouver
Matt Collinge
 
Vancouver real estate february 2012 stats package rebgv
Vancouver real estate february 2012 stats package rebgvVancouver real estate february 2012 stats package rebgv
Vancouver real estate february 2012 stats package rebgv
Matt Collinge
 
Vancouver real estate january 2012 stats package rebgv
Vancouver real estate january 2012 stats package rebgvVancouver real estate january 2012 stats package rebgv
Vancouver real estate january 2012 stats package rebgv
Matt Collinge
 
Td Economics Resale Housing Report October 2011
Td Economics Resale Housing Report October 2011Td Economics Resale Housing Report October 2011
Td Economics Resale Housing Report October 2011
Matt Collinge
 
Vancouver housing starts march 2011
Vancouver housing starts march 2011Vancouver housing starts march 2011
Vancouver housing starts march 2011
Matt Collinge
 
Vancouver housing starts february 2011
Vancouver housing starts february 2011Vancouver housing starts february 2011
Vancouver housing starts february 2011
Matt Collinge
 

Plus de Matt Collinge (20)

Vancouver real estate stats package, August 2013
Vancouver real estate stats package, August 2013Vancouver real estate stats package, August 2013
Vancouver real estate stats package, August 2013
 
Vancouver real estate stats package, january 2013
Vancouver real estate stats package, january 2013Vancouver real estate stats package, january 2013
Vancouver real estate stats package, january 2013
 
Vancouver Real Estate December 2012 Stats Package REBGV
Vancouver Real Estate December 2012 Stats Package REBGVVancouver Real Estate December 2012 Stats Package REBGV
Vancouver Real Estate December 2012 Stats Package REBGV
 
Vancouver real estate november 2012 stats package rebgv
Vancouver real estate november 2012 stats package rebgvVancouver real estate november 2012 stats package rebgv
Vancouver real estate november 2012 stats package rebgv
 
September 2012 Vancouver Real Estate stats package.
September 2012 Vancouver Real Estate stats package.September 2012 Vancouver Real Estate stats package.
September 2012 Vancouver Real Estate stats package.
 
Cambie+7 preview package
Cambie+7 preview packageCambie+7 preview package
Cambie+7 preview package
 
February 2012 Housing Starts in Metro Vancouver
February 2012 Housing Starts in Metro VancouverFebruary 2012 Housing Starts in Metro Vancouver
February 2012 Housing Starts in Metro Vancouver
 
Vancouver real estate february 2012 stats package rebgv
Vancouver real estate february 2012 stats package rebgvVancouver real estate february 2012 stats package rebgv
Vancouver real estate february 2012 stats package rebgv
 
Top 25 grants and rebates for homeowners
Top 25 grants and rebates for homeownersTop 25 grants and rebates for homeowners
Top 25 grants and rebates for homeowners
 
Vancouver real estate january 2012 stats package rebgv
Vancouver real estate january 2012 stats package rebgvVancouver real estate january 2012 stats package rebgv
Vancouver real estate january 2012 stats package rebgv
 
Lido floorplans
Lido floorplansLido floorplans
Lido floorplans
 
Top 26 grants and rebates for homeowners
Top 26 grants and rebates for homeownersTop 26 grants and rebates for homeowners
Top 26 grants and rebates for homeowners
 
Td Economics Resale Housing Report October 2011
Td Economics Resale Housing Report October 2011Td Economics Resale Housing Report October 2011
Td Economics Resale Housing Report October 2011
 
Vancouver housing starts april 2011
Vancouver housing starts april 2011Vancouver housing starts april 2011
Vancouver housing starts april 2011
 
Vancouver housing starts march 2011
Vancouver housing starts march 2011Vancouver housing starts march 2011
Vancouver housing starts march 2011
 
BC Mortgage Rate Forecast March 2011
BC Mortgage Rate Forecast March 2011BC Mortgage Rate Forecast March 2011
BC Mortgage Rate Forecast March 2011
 
Vancouver housing starts february 2011
Vancouver housing starts february 2011Vancouver housing starts february 2011
Vancouver housing starts february 2011
 
Real estate council of bc guide to selling
Real estate council of bc guide to sellingReal estate council of bc guide to selling
Real estate council of bc guide to selling
 
Real estate council of bc guide to selling
Real estate council of bc guide to sellingReal estate council of bc guide to selling
Real estate council of bc guide to selling
 
January 2011 housing starts in vancouver, bc from cmhc
January 2011 housing starts in vancouver, bc from cmhcJanuary 2011 housing starts in vancouver, bc from cmhc
January 2011 housing starts in vancouver, bc from cmhc
 

Dernier

Low Density Living New Project in BPTP THE AMAARIO Sector 37D Gurgaon Haryana...
Low Density Living New Project in BPTP THE AMAARIO Sector 37D Gurgaon Haryana...Low Density Living New Project in BPTP THE AMAARIO Sector 37D Gurgaon Haryana...
Low Density Living New Project in BPTP THE AMAARIO Sector 37D Gurgaon Haryana...
ApartmentWala1
 
Low Rate ✨➥9711108085▻✨Call Girls In East Of Kailash (E.K) (Delhi)
Low Rate ✨➥9711108085▻✨Call Girls In East Of Kailash (E.K) (Delhi)Low Rate ✨➥9711108085▻✨Call Girls In East Of Kailash (E.K) (Delhi)
Low Rate ✨➥9711108085▻✨Call Girls In East Of Kailash (E.K) (Delhi)
delhi24hrs1
 
Acibadem Konaklari Uskudar - Listin Turkey
Acibadem Konaklari Uskudar - Listin TurkeyAcibadem Konaklari Uskudar - Listin Turkey
Acibadem Konaklari Uskudar - Listin Turkey
Listing Turkey
 
Escort—>Call GiRls In Mori Gate Delhi —>8447779280—Service Escorts In South D...
Escort—>Call GiRls In Mori Gate Delhi —>8447779280—Service Escorts In South D...Escort—>Call GiRls In Mori Gate Delhi —>8447779280—Service Escorts In South D...
Escort—>Call GiRls In Mori Gate Delhi —>8447779280—Service Escorts In South D...
asmaqueen5
 
BPTP THE AMAARIO Luxury Project Invest Like Royalty in Sector 37D Gurgaon Dwa...
BPTP THE AMAARIO Luxury Project Invest Like Royalty in Sector 37D Gurgaon Dwa...BPTP THE AMAARIO Luxury Project Invest Like Royalty in Sector 37D Gurgaon Dwa...
BPTP THE AMAARIO Luxury Project Invest Like Royalty in Sector 37D Gurgaon Dwa...
ApartmentWala1
 
Listing Turkey - 2024 - May Featured Portfolio
Listing Turkey - 2024 - May Featured PortfolioListing Turkey - 2024 - May Featured Portfolio
Listing Turkey - 2024 - May Featured Portfolio
Listing Turkey
 
Low Rate Call girls in Sant Nagar{Delhi }8447779280} Service Escorts In South...
Low Rate Call girls in Sant Nagar{Delhi }8447779280} Service Escorts In South...Low Rate Call girls in Sant Nagar{Delhi }8447779280} Service Escorts In South...
Low Rate Call girls in Sant Nagar{Delhi }8447779280} Service Escorts In South...
asmaqueen5
 
Low Rate ✨➥9711108085▻✨Call Girls In Majnu Ka Tilla (Mt) (Delhi)
Low Rate ✨➥9711108085▻✨Call Girls In Majnu Ka Tilla (Mt) (Delhi)Low Rate ✨➥9711108085▻✨Call Girls In Majnu Ka Tilla (Mt) (Delhi)
Low Rate ✨➥9711108085▻✨Call Girls In Majnu Ka Tilla (Mt) (Delhi)
delhi24hrs1
 

Dernier (20)

Low Density Living New Project in BPTP THE AMAARIO Sector 37D Gurgaon Haryana...
Low Density Living New Project in BPTP THE AMAARIO Sector 37D Gurgaon Haryana...Low Density Living New Project in BPTP THE AMAARIO Sector 37D Gurgaon Haryana...
Low Density Living New Project in BPTP THE AMAARIO Sector 37D Gurgaon Haryana...
 
Prestige Sancoale Goa Residneces Brochure.pdf
Prestige Sancoale Goa Residneces Brochure.pdfPrestige Sancoale Goa Residneces Brochure.pdf
Prestige Sancoale Goa Residneces Brochure.pdf
 
Top tourism places in Dubai - Inch & Brick Realty
Top tourism places in Dubai - Inch & Brick RealtyTop tourism places in Dubai - Inch & Brick Realty
Top tourism places in Dubai - Inch & Brick Realty
 
Madhugiri Boucher Managed Farmland (knx)
Madhugiri Boucher Managed Farmland (knx)Madhugiri Boucher Managed Farmland (knx)
Madhugiri Boucher Managed Farmland (knx)
 
Yashwin Enchante Uppar Kharadi Pune E-Brochue.pdf
Yashwin Enchante Uppar Kharadi Pune  E-Brochue.pdfYashwin Enchante Uppar Kharadi Pune  E-Brochue.pdf
Yashwin Enchante Uppar Kharadi Pune E-Brochue.pdf
 
Parksville 96 Surrey Floor Plans May 2024
Parksville 96 Surrey Floor Plans May 2024Parksville 96 Surrey Floor Plans May 2024
Parksville 96 Surrey Floor Plans May 2024
 
Kalpataru Exquisite Wakad Pune E-Brochure.pdf
Kalpataru Exquisite Wakad Pune  E-Brochure.pdfKalpataru Exquisite Wakad Pune  E-Brochure.pdf
Kalpataru Exquisite Wakad Pune E-Brochure.pdf
 
Low Rate ✨➥9711108085▻✨Call Girls In East Of Kailash (E.K) (Delhi)
Low Rate ✨➥9711108085▻✨Call Girls In East Of Kailash (E.K) (Delhi)Low Rate ✨➥9711108085▻✨Call Girls In East Of Kailash (E.K) (Delhi)
Low Rate ✨➥9711108085▻✨Call Girls In East Of Kailash (E.K) (Delhi)
 
Vanam At Purva Soukhyam Guduvanchery.pdf.pdf
Vanam At Purva Soukhyam Guduvanchery.pdf.pdfVanam At Purva Soukhyam Guduvanchery.pdf.pdf
Vanam At Purva Soukhyam Guduvanchery.pdf.pdf
 
Kohinoor Teiko Hinjewadi Phase 2 Pune E-Brochure.pdf
Kohinoor Teiko Hinjewadi Phase 2 Pune  E-Brochure.pdfKohinoor Teiko Hinjewadi Phase 2 Pune  E-Brochure.pdf
Kohinoor Teiko Hinjewadi Phase 2 Pune E-Brochure.pdf
 
Acibadem Konaklari Uskudar - Listin Turkey
Acibadem Konaklari Uskudar - Listin TurkeyAcibadem Konaklari Uskudar - Listin Turkey
Acibadem Konaklari Uskudar - Listin Turkey
 
Escort—>Call GiRls In Mori Gate Delhi —>8447779280—Service Escorts In South D...
Escort—>Call GiRls In Mori Gate Delhi —>8447779280—Service Escorts In South D...Escort—>Call GiRls In Mori Gate Delhi —>8447779280—Service Escorts In South D...
Escort—>Call GiRls In Mori Gate Delhi —>8447779280—Service Escorts In South D...
 
Explore Dual Citizenship in Africa | Citizenship Benefits & Requirements
Explore Dual Citizenship in Africa | Citizenship Benefits & RequirementsExplore Dual Citizenship in Africa | Citizenship Benefits & Requirements
Explore Dual Citizenship in Africa | Citizenship Benefits & Requirements
 
BPTP THE AMAARIO Luxury Project Invest Like Royalty in Sector 37D Gurgaon Dwa...
BPTP THE AMAARIO Luxury Project Invest Like Royalty in Sector 37D Gurgaon Dwa...BPTP THE AMAARIO Luxury Project Invest Like Royalty in Sector 37D Gurgaon Dwa...
BPTP THE AMAARIO Luxury Project Invest Like Royalty in Sector 37D Gurgaon Dwa...
 
Listing Turkey - 2024 - May Featured Portfolio
Listing Turkey - 2024 - May Featured PortfolioListing Turkey - 2024 - May Featured Portfolio
Listing Turkey - 2024 - May Featured Portfolio
 
Yedi Mavi TOBB Zeytinburnu - Listing Turkey
Yedi Mavi TOBB Zeytinburnu - Listing TurkeyYedi Mavi TOBB Zeytinburnu - Listing Turkey
Yedi Mavi TOBB Zeytinburnu - Listing Turkey
 
Best Interior Design Services in Haldwani
Best Interior Design Services in HaldwaniBest Interior Design Services in Haldwani
Best Interior Design Services in Haldwani
 
Low Rate Call girls in Sant Nagar{Delhi }8447779280} Service Escorts In South...
Low Rate Call girls in Sant Nagar{Delhi }8447779280} Service Escorts In South...Low Rate Call girls in Sant Nagar{Delhi }8447779280} Service Escorts In South...
Low Rate Call girls in Sant Nagar{Delhi }8447779280} Service Escorts In South...
 
Bridge & Elliot Ladner Floor Plans May 2024.pdf
Bridge & Elliot Ladner Floor Plans May 2024.pdfBridge & Elliot Ladner Floor Plans May 2024.pdf
Bridge & Elliot Ladner Floor Plans May 2024.pdf
 
Low Rate ✨➥9711108085▻✨Call Girls In Majnu Ka Tilla (Mt) (Delhi)
Low Rate ✨➥9711108085▻✨Call Girls In Majnu Ka Tilla (Mt) (Delhi)Low Rate ✨➥9711108085▻✨Call Girls In Majnu Ka Tilla (Mt) (Delhi)
Low Rate ✨➥9711108085▻✨Call Girls In Majnu Ka Tilla (Mt) (Delhi)
 

Home sales edge higher in september 2011

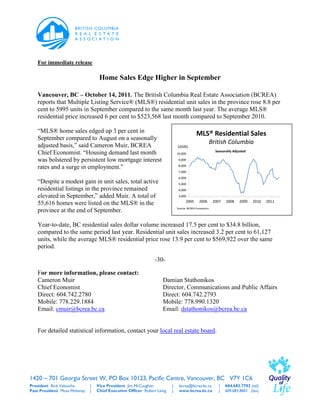
  • 1. For immediate release Home Sales Edge Higher in September Vancouver, BC – October 14, 2011. The British Columbia Real Estate Association (BCREA) reports that Multiple Listing Service® (MLS®) residential unit sales in the province rose 8.8 per cent to 5995 units in September compared to the same month last year. The average MLS® residential price increased 6 per cent to $523,568 last month compared to September 2010. “MLS® home sales edged up 3 per cent in MLS® Residential Sales September compared to August on a seasonally adjusted basis,” said Cameron Muir, BCREA British Columbia Units Chief Economist. “Housing demand last month 10,000 Seasonally Adjusted was bolstered by persistent low mortgage interest 9,000 8,000 rates and a surge in employment.” 7,000 6,000 “Despite a modest gain in unit sales, total active 5,000 residential listings in the province remained 4,000 elevated in September,” added Muir. A total of 3,000 2005 2006 2007 2008 2009 2010 2011 55,616 homes were listed on the MLS® in the Source: BCREA Economics province at the end of September. Year-to-date, BC residential sales dollar volume increased 17.5 per cent to $34.8 billion, compared to the same period last year. Residential unit sales increased 3.2 per cent to 61,127 units, while the average MLS® residential price rose 13.9 per cent to $569,922 over the same period. -30- For more information, please contact: Cameron Muir Damian Stathonikos Chief Economist Director, Communications and Public Affairs Direct: 604.742.2780 Direct: 604.742.2793 Mobile: 778.229.1884 Mobile: 778.990.1320 Email: cmuir@bcrea.bc.ca Email: dstathonikos@bcrea.bc.ca For detailed statistical information, contact your local real estate board. 1420 – 701 Georgia Street W, PO Box 10123, Pacific Centre, Vancouver, BC V7Y 1C6 President Rick Valouche | Vice President Jim McCaughan | bcrea@bcrea.bc.ca | 604.683.7702 (tel) Past President Moss Moloney | Chief Executive Officer Robert Laing | www.bcrea.bc.ca | 604.683.8601 (fax)
  • 2. Home Sales Edge Higher in September . . . Page 2 September 2011 Residential Average Price, Active Listings and Sales-to-Active-Listings Data by Board Average Price Active Listings Sales-to-Active-Listings September September September September September September 2011 2010 2011 2010 2011 2010 Board % change Residential Residential % Residential Residential Residential Residential Active Active change Sales to Active Sales to Active Average Price Average Price Listings Listings Listings Listings ($) ($) (Units) (Units) (%) (%) BC Northern 215,215 200,140 7.5 3,047 2,943 3.5 12.0 11.5 Chilliwack 304,913 289,209 5.4 1,887 1,360 38.7 8.3 10.1 Fraser Valley 489,420 444,997 10.0 8,489 6,939 22.3 13.1 13.9 Greater Vancouver 751,042 679,381 10.5 17,206 16,522 4.1 13.4 13.6 Kamloops 290,706 316,974 -8.3 2,178 2,000 8.9 8.7 9.4 Kootenay 285,725 257,413 11.0 3,386 3,102 9.2 6.4 6.1 Okanagan Mainline 375,593 401,982 -6.6 6,524 6,407 1.8 6.9 6.3 Powell River 211,311 193,077 9.4 263 224 17.4 9.9 11.6 South Okanagan 299,410 291,587 2.7 2,113 2,147 -1.6 5.8 4.8 Northern Lights 197,226 181,449 8.7 320 322 -0.6 18.4 11.2 Vancouver Island 332,741 319,531 4.1 6,192 6,031 2.7 9.2 8.2 Victoria 493,522 485,459 1.7 4,011 3,436 16.7 10.9 11.0 Provincial Totals* 523,568 493,846 6.0 55,616 51,433 8.1 10.8 10.7 *Numbers may not add due to rounding September 2011 BC Residential Multiple Listing Service® Data by Board Dollar Volume (000s) Units September 2011 September 2010 September 2011 September 2010 Board Residential Sales Residential Sales % change Residential Sales Residential Sales % change ($) ($) (Units) (Units) BC Northern 78,554 67,647 16.1 365 338 8.0 Chilliwack 47,568 39,622 20.1 156 137 13.9 Fraser Valley 542,767 430,312 26.1 1,109 967 14.7 Greater Vancouver 1,726,646 1,531,324 12.8 2,299 2,254 2.0 Kamloops 55,234 59,908 -7.8 190 189 0.5 Kootenay 62,002 48,394 28.1 217 188 15.4 Okanagan Mainline 167,890 161,597 3.9 447 402 11.2 Powell River 5,494 5,020 9.4 26 26 0.0 South Okanagan 36,827 30,034 22.6 123 103 19.4 Northern Lights 11,636 6,532 78.1 59 36 63.9 Vancouver Island 188,997 157,209 20.2 568 492 15.4 Victoria 215,176 183,989 17.0 436 379 15.0 Provincial Totals* 3,138,791 2,721,587 15.3 5,995 5,511 8.8 * Numbers may not add due to rounding **NOTE: The Northern Lights Real Estate Board (NLREB) became part of the South Okanagan Real Estate Board (SOREB) on January 1, 2011. 1420 – 701 Georgia Street W, PO Box 10123, Pacific Centre, Vancouver, BC V7Y 1C6 President Rick Valouche | Vice President Jim McCaughan | bcrea@bcrea.bc.ca | 604.683.7702 (tel) Past President Moss Moloney | Chief Executive Officer Robert Laing | www.bcrea.bc.ca | 604.683.8601 (fax)
  • 3. Home Sales Edge Higher in September . . . Page 3 September 2011 Year-to-Date BC Residential Multiple Listing Service® Data by Board Dollar Volume (000s) Unit Sales Average Price Board % % % 2011 2010 2011 2010 change 2011 2010 change change ($) ($) ($) ($) BC Northern 665,662 628,283 5.9 3,028 2,944 2.9 219,836 213,411 3.0 Chilliwack 484,615 503,610 -3.8 1,616 1,638 -1.3 299,886 307,454 -2.5 Fraser Valley 5,967,440 5,046,812 18.2 11,779 11,191 5.3 506,617 450,971 12.3 Greater Vancouver 20,956,066 16,224,999 29.2 26,482 24,276 9.1 791,332 668,356 18.4 Kamloops 499,660 528,299 -5.4 1,643 1,718 -4.4 304,114 307,508 -1.1 Kootenay 404,828 444,218 -8.9 1,493 1,610 -7.3 271,151 275,912 -1.7 Okanagan Mainline 1,454,636 1,537,869 -5.4 3,803 3,900 -2.5 382,497 394,325 -3.0 Powell River 55,484 53,186 4.3 247 222 11.3 224,630 239,578 -6.2 South Okanagan 323,611 358,183 -9.7 1,051 1,108 -5.1 307,907 323,270 -4.8 Northern Lights 76,502 77,586 -1.4 366 370 -1.1 209,022 209,691 -0.3 Vancouver Island 1,670,292 1,750,536 -4.6 5,084 5,308 -4.2 328,539 329,792 -0.4 Victoria 2,278,815 2,492,337 -8.6 4,535 4,943 -8.3 502,495 504,215 -0.3 Provincial Totals* 34,837,609 29,645,918 17.5 61,127 59,228 3.2 569,922 500,539 13.9 * Numbers may not add due to rounding BCREA represents 11 member real estate boards and their approximately 18,000 REALTORS® on all provincial issues, providing an extensive communications network, standard forms, economic research and analysis, government relations, applied practice courses and continuing professional education (cpe). To demonstrate the profession’s commitment to improving Quality of Life in BC communities, BCREA supports policies that encourage economic vitality, provide housing opportunities, respect the environment and build communities with good schools and safe neighbourhoods. For detailed statistical information, contact your local real estate board. MLS® is a cooperative marketing system used only by Canada’s real estate boards to ensure maximum exposure of properties listed for sale. 1420 – 701 Georgia Street W, PO Box 10123, Pacific Centre, Vancouver, BC V7Y 1C6 President Rick Valouche | Vice President Jim McCaughan | bcrea@bcrea.bc.ca | 604.683.7702 (tel) Past President Moss Moloney | Chief Executive Officer Robert Laing | www.bcrea.bc.ca | 604.683.8601 (fax)