Multitouch attribution model white-paper-final
- 1. © Slingshot SEO, Inc. All Rights Reserved.
www.SlingshotSEO.com
Executive Summary
In order to measure the overall effect of online marketing campaigns, one must be able to determine the true value of each
marketing channel: organic search, paid advertising, email marketing, direct visits, and referrals. Typically, a user will interact
with a website in a number of different ways using a combination of these channels over the course of a few days or even
weeks. This behavior can make it difficult to evaluate which channels are the most effective in influencing the user to make a
purchase and which channels had little or no impact on the user.
This study attempts to find the true value of each online marketing channel through a flat multi-touch attribution model. A
flat multi-touch attribution model is a way of assigning value equally to all interactions with a given website before a
conversion takes place. As a marketer, Slingshot SEO recommends considering the influence of every interaction leading to a
conversion, not just the last interaction.
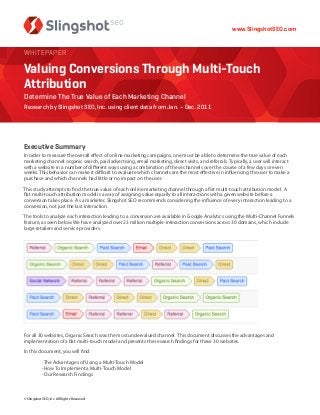
The tools to analyze each interaction leading to a conversion are available in Google Analytics using the Multi-Channel Funnels
feature, as seen below. We have analyzed over 23 million multiple-interaction conversions across 30 domains, which include
large retailers and service providers.
For all 30 websites, Organic Search was the most undervalued channel. This document discusses the advantages and
implementation of a flat multi-touch model and presents the research findings for these 30 websites.
In this document, you will find:
-The Advantages of Using a Multi-Touch Model
-How To Implement a Multi-Touch Model
-Our Research Findings
Whitepaper
Valuing Conversions Through Multi-Touch
Attribution
Determine The True Value of Each Marketing Channel
Research by Slingshot SEO, Inc. using client data from Jan. – Dec. 2011
- 2. www.SlingshotSEO.com
© Slingshot SEO, Inc. All Rights Reserved. 2
The Advantages of Using a Multi-Touch Model
What is a model?
A model is a compromise between simplicity and reality. It is too simple to credit the last referring campaign with a
conversion, as marketers often do by default. The reality is that users will interact with a website a few times before
converting. Therefore, it would be helpful for marketers to look at all paths leading to a single conversion, not just the last
interaction. This can be done using a flat multi-touch attribution model. Listed below are some of the issues between
simplicity and reality that marketers often overlook, and why a multi-touch model is an effective compromise.
Simplicity:
LAST-TOUCH ATTRIBUTION:
By default, Google Analytics credits each conversion to the last referring campaign/marketing channel.
Below is a series of interactions leading to a conversion:
Organic Search > Referral > Social Network > Email > Direct Visit ($100) = $100 Conversion
The "direct visit" gets all credit for the conversion.
This model assumes that the final marketing event was the only influence on the user and ignores the previous paths.
However, users often interact with a website several times before converting, and are influenced by each channel.
FIRST-TOUCH ATTRIBUTION:
You may want to attribute conversions to the first referring campaign/marketing channel.
Below is the same series of interactions leading to a conversion:
Organic Search ($100) > Referral > Social Network > Email > Direct Visit = $100 Conversion
In this case, the "organic search" gets credit for the conversion.
This model assumes the first interaction was the main influence on the user and ignores the interactions that follow.
However, nurturing potential customers is just as important as grabbing their attention in the first place. It may take an
assisting interaction like a social network or a coupon offered through an email to influence a user to make a purchase.
Reality:
If“Last-Touch”and“First-Touch”are too simple to prioritize different marketing events, then how could a marketer value each
channel? One way would be to examine each individual conversion and identify which channel was the most influential,
either by average time on site, pages/visit, or other ways of measuring how the user interacted with the site. The goal would
be to find which channel or combination of channels convinced the user to make a purchase.
Examining each conversion individually would be a long and arduous process, and there is no way to know which channel
was the true reason for each conversion. Assigning values to each path individually would be subjective and problematic
because users respond differently to each marketing channel.
A Compromise Between Simplicity and Reality:
MULTI-TOUCH ATTRIBUTION
In a flat multi-touch attribution model, we take the value of each conversion and divide it out equally among each channel
in the path.
For example, in the following series of interactions leading to a conversion, each of the five interactions is credited with an
equal portion of the conversion value.
- 3. www.SlingshotSEO.com
© Slingshot SEO, Inc. All Rights Reserved. 3
Organic Search ($20) > Referral ($20) > Social Network ($20) > Email ($20) > Direct ($20) = $100 Conversion
In this case, each channel receives the conversion value divided by the number of interactions in the chain.
The $20 credited to each path is referred to as an“Attributed Conversion.”
This model assumes that each interaction has equal influence on the user and that each interaction plays a role in any given
conversion. In reality, each interaction may not have equal influence, but since we cannot easily quantify the intrinsic value
of each channel, we must acknowledge that it does have some influence over the user. This is the main advantage of a flat
multi-touch model over other models.
While we may want to weight the first and last interactions more than the other paths, as Econsultancy points out in an
insightful post from March 2011, one must realize that“Attributed Conversions give us a sense of the‘influence’of a channel
since, if a channel appears often in paths where users are exposed to 20 events, you can say it has less value than one that
appears in paths where there were only two or three.”1
That sense of“true influence”is what the multi-touch model was designed to achieve.
Lexin Lin and Xuhui Shao show in their white paper, Data-driven Multi-touch Attribution Models, that more complex models
can also be implemented effectively. Their study uses a bivariate metric, which evaluates multi-touch using a bagged
logistic regression and probabilistic models. It is considered a major contribution to the field and is highly recommended
reading.2
How To Implement a Multi-Touch Model
Google Analytics (GA) provides the ability to track how visitors interact with a site before a conversion in its new feature,
Multi-Channel Funnels. In order to apply the flat multi-touch model to conversion data, make sure the data currently being
tracking is valuable and accurate.
Define conversions that reflect what you want a visitor to ultimately achieve on your website. It should be an actionable
insight that adds increased value to your business.
Examples of possible goals to set up in order to track conversions:
-eCommerce transactions/purchases
-Newsletter subscriptions
-Free trial subscriptions
-Email list subscriptions
-Upgrades
-Quote requests
-Downloads
-Watching a video about a service/product
-Viewing 5+ pages on the website
-Viewing 10+ pages on the website
-Facebook Likes / Google +1s
-Job application forms
-Contact forms
When eCommerce data is linked to GA, the customer transaction costs (conversion values) will be assigned to each
transaction. It would be helpful to assign conversion values to non-eCommerce goals as well.
Each of these goals will be more valuable to some websites than others, so it is important to determine which add the most
value to your business.
Once you set up meaningful goals and have a time frame with enough data, you can analyze conversion paths through
Multi-Channel Funnels.
1 http://econsultancy.com/us/blog/7229-social-media-and-seo-massively-undervalued-study
2 The study is available for download here: http://www.turn.com/news/solving-the-multi-touch-attribution-problem/
- 4. www.SlingshotSEO.com
© Slingshot SEO, Inc. All Rights Reserved. 4
This is located under Standard Reporting > Conversions > Multi-Channel Funnels > Top Conversion Paths. From here, apply
conversion segments to find the number of conversions for last-touch, first-touch, or any-touch across all channels. For
additional help with Google Analytics, please see our guide http://www.slingshotseo.com/resources/guides/how-to-use-
google-analytics/
The goal is to compare conversions (last-touch) with attributed conversions (flat multi-touch) for a specific channel.
Basic channel groupings from Google Analytics include: organic, paid advertising, referral, social network, email, and direct.
This comparison will help determine whether or not that particular channel is undervalued or overvalued.
Below is a brief overview on how to find the value of each channel.
For this walk-through, determine whether or not Organic Visits are undervalued or overvalued.
1. Finding Conversions (last-touch)
-This is simple. Create a new conversion segment specifying Include Last Interaction, from: Medium containing organic
-Then select a time range and apply the segment.
-Now record the total Conversion Value for this Last-Touch Organic segment. If there are no conversion values assigned, then
record the number of total conversions.
2. Finding Attributed Conversions (flat multi-touch)
-This is the tricky part. First, create a conversion segment specifying Include Any Interaction, from: Medium containing
organic
-Next, export the CSV into Excel.
There are three columns: Basic Channel Grouping Path, Conversions, and Conversion Values.
-For each path, the task is to divide each conversion value and attribute it to each channel, depending on how many times it
appears in that path.
-One way would be to delimit the first column, which breaks out each interaction into a single column. This can be used to
apply =COUNTIF() functions to determine the number of Organic interactions in that path.
- 5. www.SlingshotSEO.com
© Slingshot SEO, Inc. All Rights Reserved. 5
-Determine the value of those Attributed Conversions that belong to Organic in each path and sum those values. This is the
total amount Attributed Conversions for Organic Search.
-These steps are reiterated below:
Download the CSV to get three columns of data.
Basic Channel Grouping Conversions Conversion Value
Organic Search > Direct 100 $200,000
Organic Search >
Organic Search > Direct
50 $9,000
Delimit the first column.
Basic Channel Grouping Conversions Conversion Value
Organic Search > Direct 100 $200,000 Organic Search Direct
Organic Search >
Organic Search > Direct
50 $9,000 Organic Search Organic Search Direct
For each row, determine the number of interactions in each path using COUNTIF statements. Next, determine how many
times“Organic Search”appeared in each path. Determine what each interaction is worth for each path.
Basic Channel
Grouping
Conversions Conversion
Value
# of Organic
Search
# of Total
Interactions
Each Interaction
is Worth:
Attributed
Conversions to
Organic
Organic Search >
Direct
100 $200,000 1 2 $100,000 $100,000
Organic Search >
Organic Search >
Direct
50 $9,000 2 3 $3,000 $6,000
For the first path, each interaction is worth $100,000, so "organic search" gets credit for $100,000 because it appears once in
the path.
For the second path, each interaction is worth $3,000, so "organic search" gets credit for $6,000 because it appears twice in
the path.
Sum the entire column for“Attributed Conversions to Organic”to yield $106,000.
This is the amount of Attributed Conversions used to compare with Last-Touch Conversions.
Divide (Attributed Conversions) by (Last-Touch Conversions) to determine how overvalued or undervalued that channel is.
If "organic search" had 1,500 Attributed Conversions and 1,000 Conversions (Last-Touch), then "organic search" is
undervalued and should be worth 50% more than its current value.
This is useful because once attributed conversions have been determined for every available channel, a marketer can
prioritize these events based on all interactions, not just the last-touch.
- 6. www.SlingshotSEO.com
© Slingshot SEO, Inc. All Rights Reserved. 6
Research Findings
Slingshot SEO conducted this multi-touch attribution study on 30 of our largest clients for the time period of January
through December 2011.
In order for a website to qualify for the study, it must have had Google Analytics and meaningful goals set up for 2011. A
meaningful goal is an actionable insight that adds increased value to a business.
For privacy reasons, we have removed the client’s name and domain and instead listed a general category for each of the 30
businesses included in the study.
Below is an example of our findings for one“Retailers & General Merchandise”website in 2011:
Organic Search
Attributed Conversions (multi-touch): 4,492,548
Conversions (last-touch): 3,916,743
A difference of 114.70%
Indicates Organic Search was undervalued and would be increased by 14.70% in a flat Multi-Touch model.
Non-Branded Organic Search
Attributed Conversions (multi-touch): 257,058
Conversions (last-touch): 217,429
A difference of 118.23%
Indicates Non-Branded Organic Search was undervalued and would be increased by 18.23% in a flat Multi-Touch model.
Direct Visits
Attributed Conversions (multi-touch): 7,592,940
Conversions (last-touch): 8,305,468
A difference of -108.58%
Indicates Direct Visits were overvalued and would be decreased by 8.58% in a flat Multi-Touch model.
Paid Advertising
Attributed Conversions (multi-touch): 1,343,804
Conversions (last-touch): 1,102,729
A difference of 121.86%
Indicates Paid Advertising was undervalued and would be increased by 21.86% in a flat Multi-Touch model.
Referral Visits
Attributed Conversions (multi-touch): 982,419
Conversions (last-touch): 862,349
A difference of 113.92%
Indicates Referral Visits were undervalued and would be increased by 13.92% in a flat Multi-Touch model.
The table below shows the percent increase in value when considering attributed conversions as opposed to last-touch
conversions.
Percentages calculated by [Attributed Conversions / Last-Touch Conversions] – 1
A positive percentage indicates that the channel was undervalued.
A negative percentage indicates that the channel was overvalued.
The following channels are shown in Table 1.1:
"organic search", non-branded organic search", "direct visits", "paid advertising" (CPC), and "referral visits" (including social &
email referrals).
- 7. www.SlingshotSEO.com
© Slingshot SEO, Inc. All Rights Reserved. 7
Table 1.1 – Multi-Touch Attribution Analysis
Percentages calculated by [Attributed Conversions / Last-Touch Conversions] – 1
A positive % indicates that the channel is undervalued
A negative % indicates that the channel is overvalued
Client Category Organic Non-Branded Organic Direct Paid Referral
Business & Industrial 29.57% 31.54% -35.74% 26.31% 8.75%
Business & Industrial 24.34% 54.72% -12.75% 18.35% 25.93%
Business & Industrial 1.17% 1.17% -10.93% 14.20% 3.16%
Computers & Consumer Electronics 16.42% 25.66% -9.63% - -2.86%
Computers & Consumer Electronics 10.70% 10.98% -16.73% - 22.51%
Computers & Consumer Electronics 3.24% 23.50% -3.14% 22.72% -30.63%
Finance & Insurance 19.76% 66.92% -0.77% -22.60% -0.11%
Finance & Insurance 9.90% 13.03% -1.83% - 0.25%
Health & Wellness 21.11% 23.57% -22.88% 0.23% -8.68%
Health & Wellness 4.72% 5.44% -24.58% - 11.92%
Home & Garden 42.09% 51.64% -6.78% 96.67% -52.53%
Home & Garden 27.65% 31.91% -27.99% 22.60% -8.00%
Home & Garden 25.44% 27.48% -14.46% 19.35% 4.87%
Home & Garden 19.74% 25.02% -28.20% 13.60% 34.66%
Home & Garden 19.37% 20.41% -28.58% 11.18% 32.09%
Home & Garden 12.00% 13.00% -29.71% 5.69% 15.10%
Home & Garden 10.97% 14.76% -15.21% 11.54% 15.50%
Home & Garden 8.33% 16.95% -10.80% -2.86% 15.23%
Occasions & Gifts 7.73% 5.84% -4.57% 32.93% 50.65%
Retailers & General Merchandise 77.25% 44.74% -26.19% 24.34% -52.30%
Retailers & General Merchandise 31.10% 36.51% -25.08% 71.28% -9.92%
Retailers & General Merchandise 26.99% 81.59% -29.90% 76.88% -23.15%
Retailers & General Merchandise 20.21% 20.21% -8.41% 7.31% 16.31%
Retailers & General Merchandise 14.70% 18.23% -8.58% 21.86% 13.92%
Retailers & General Merchandise 13.07% 13.07% -6.71% -5.23% 3.77%
Retailers & General Merchandise 12.61% 26.01% -15.56% - 19.93%
Retailers & General Merchandise 12.28% 19.37% -7.79% - 2.68%
Retailers & General Merchandise 11.95% 18.42% -15.49% - -11.45%
Retailers & General Merchandise 7.71% 9.10% -12.93% 12.15% 16.97%
Retailers & General Merchandise 6.84% 14.51% -11.75% 11.92% 6.24%
Remark: For all 30 websites, "organic search" and "non-branded organic search" were being undervalued in 2011. Multi-touch attribution
showed that "organic search" should have been worth as much as 77.25% more than previously thought, and "non-branded organic"
should have been worth as much as 81.59% more.
Also, for all 30 websites, "direct visits" were being overvalued in 2011. "direct visits" should have been worth as much as 35.74% less than
previously thought.
- 8. www.SlingshotSEO.com
© Slingshot SEO, Inc. All Rights Reserved. 8
Table 1.2 – Multi-Touch Attribution Most Undervalued & Overvalued Channels
Client No. Client Category Most Undervalued Most Overvalued
1 Business & Industrial Non-Branded Organic Direct
2 Business & Industrial Non-Branded Organic Direct
3 Business & Industrial Paid Advertising Direct
4 Computers & Consumer Electronics Non-Branded Organic Direct
5 Computers & Consumer Electronics Referrals Direct
6 Computers & Consumer Electronics Non-Branded Organic Referrals
7 Finance & Insurance Non-Branded Organic Paid Advertising
8 Finance & Insurance Non-Branded Organic Direct
9 Health & Wellness Non-Branded Organic Direct
10 Health & Wellness Referrals Direct
11 Home & Garden Paid Advertising Referrals
12 Home & Garden Non-Branded Organic Direct
13 Home & Garden Non-Branded Organic Direct
14 Home & Garden Referrals Direct
15 Home & Garden Referrals Direct
16 Home & Garden Referrals Direct
17 Home & Garden Referrals Direct
18 Home & Garden Non-Branded Organic Direct
19 Occasions & Gifts Referrals Direct
20 Retailers & General Merchandise Organic Referrals
21 Retailers & General Merchandise Paid Advertising Direct
22 Retailers & General Merchandise Non-Branded Organic Direct
23 Retailers & General Merchandise Organic Direct
24 Retailers & General Merchandise Paid Advertising Direct
25 Retailers & General Merchandise Organic Direct
26 Retailers & General Merchandise Non-Branded Organic Direct
27 Retailers & General Merchandise Non-Branded Organic Direct
28 Retailers & General Merchandise Non-Branded Organic Direct
29 Retailers & General Merchandise Referrals Direct
30 Retailers & General Merchandise Non-Branded Organic Direct
Remark: The most undervalued channel was typically "non-branded organic searches", while the most overvalued channel was typically
"direct visits".
- 9. www.SlingshotSEO.com
© Slingshot SEO, Inc. All Rights Reserved. 9
Table 2.1 – Top 20 Most Common Conversion Paths (with 2 or more interactions)
Over 23.5 million multiple-step conversions were analyzed in this study
1. Organic Search > Organic Search
2. Organic Search > Organic Search > Organic Search
3. Paid Advertising > Paid Advertising
4. Direct > Direct
5. Organic Search > Organic Search > Organic Search > Organic Search
6. Referral > Referral
7. Paid Advertising > Paid Advertising > Paid Advertising
8. Organic Search > Direct
9. Direct > Direct > Direct
10. Organic Search > Organic Search > Organic Search > Organic Search > Organic Search
11. Referral > Referral > Referral
12. Paid Advertising > Paid Advertising > Paid Advertising > Paid Advertising
13. Direct > Organic Search
14. Referral > Referral > Referral > Referral
15. Organic Search > Organic Search > Organic Search > Organic Search > Organic Search > Organic Search
16. Direct > Direct > Direct > Direct
17. Referral > Referral > Referral > Referral > Referral
18. Referral > Organic Search
19. Paid Advertising > Paid Advertising > Paid Advertising > Paid Advertising > Paid Advertising
20. Paid Advertising > Direct
Remark: This table was included because it demonstrates the“quick-and-easy”way of looking at conversions, but it does not necessarily
reveal the user behavior patterns behind the scenes concerning which channels are the most influential. The table is helpful because it
outlines which overall paths are most likely to be taken by a user without having to apply a multi-touch model to break out the values
between each individual channel.
Users take a number of different paths before converting, and as a result, there are many unique paths that would be overlooked since
they are not in the top 20 most common paths. Just looking at this table would not reveal that "direct visits" are being overvalued or that
"organic search" is being undervalued. This speaks to the need for the quantitative analysis from a multi-touch model to prioritize
channels more effectively.
- 10. www.SlingshotSEO.com
© Slingshot SEO, Inc. All Rights Reserved. 10
Discussion/Additional Remarks
For these 30 businesses in 2011, "direct visits" were getting more credit for conversions under a last-touch model, as they
were often the last interaction before a conversion. As a result, other channels like "organic search", "paid advertising", and
"referrals" were typically undervalued.
Why would organic search be undervalued? Organic searches drive sales/conversions from the top of the funnel as users
are doing initial research. This affects the organic channel as a whole, but also conversion rates for generic organic
keywords. On average, users in this study took 2.79 interactions before converting. The last step before a conversion was
typically a direct visit to the site or a branded keyword search.
The“upper funnel”keywords may not have high conversion rates, but their goal is to capture as many initial research queries
as possible so that users will visit the site, do their research, find the product that best fits their needs, compare prices, and
return later through a direct visit. This behavior helps explain why looking at conversion rates for a generic keyword can be
misleading because the top-level keywords are not getting credit for those conversions. The influence of organic search
should not be limited to conversion rates and traffic numbers. Attributed Conversions are just as important to analyze.
The Multi-Touch Attribution model should be used to value conversions, determine the most influential paths, and prioritize
different marketing channels. Some marketers may prefer a model that weights the first and last conversions more than the
assisting interactions. No matter which model is chosen, valuing conversions should be part of ROI-focused discussions
with clients and a key focus for all marketers.
- 11. www.SlingshotSEO.com
© Slingshot SEO, Inc. All Rights Reserved. 11
Study Contributors
Study written and conducted by
Evan Fishkin
Head of Research and Development
Casey Szulc
Statistician
Questions & Comments can be sent to research@slingshotseo.com
Slingshot SEO
8900 Keystone Crossing
Suite 100
Indianapolis, IN 46240
http://www.slingshotseo.com
317.575.8852
Interested in More?
Contact Daren Tomey, SVP Corporate Development at Slingshot SEO to discover how your company can dominate online rankings.
D.Tomey@SlingshotSEO.com
Office | 317.575.8852
Mobile | 317.319.3840
Twitter | @darentomey| @SlingshotSEO