May 10, 2012: Charts that Count - Sovereign Debt and Monetary Malfeasance Insurance
•
0 j'aime•726 vues

According to the Canadian Taxpayers Federation "Canada's federal debt grew steadily between 5% and 10% per year until 1975 when it began to explode; growing for the next 12 years at more than 20% per year. It broke the $100 billion mark in 1981 and the $200 billion mark in 1985. While the growth slowed in 1988, our federal debt continued to climb, breaking $300 billion in 1988, $400 billion 1992, and $500 billion in 1994. It peaked in 1997 at $563 billion. Between 1997 and 2008, it slowly declined to $458 billion. After that, it all changed."

Recommandé
Contenu connexe
En vedette
En vedette (18)
Plus de Veripath Partners
Plus de Veripath Partners (20)
Dernier
Dernier (20)
May 10, 2012: Charts that Count - Sovereign Debt and Monetary Malfeasance Insurance
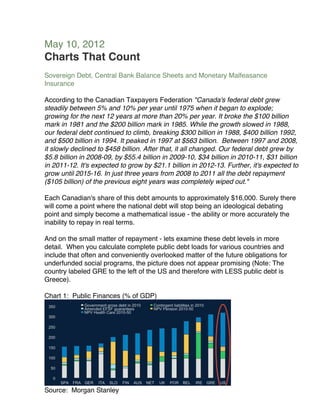
- 1. May 10, 2012 Charts That Count Sovereign Debt, Central Bank Balance Sheets and Monetary Malfeasance Insurance According to the Canadian Taxpayers Federation "Canada's federal debt grew steadily between 5% and 10% per year until 1975 when it began to explode; growing for the next 12 years at more than 20% per year. It broke the $100 billion mark in 1981 and the $200 billion mark in 1985. While the growth slowed in 1988, our federal debt continued to climb, breaking $300 billion in 1988, $400 billion 1992, and $500 billion in 1994. It peaked in 1997 at $563 billion. Between 1997 and 2008, it slowly declined to $458 billion. After that, it all changed. Our federal debt grew by $5.8 billion in 2008-09, by $55.4 billion in 2009-10, $34 billion in 2010-11, $31 billion in 2011-12. It's expected to grow by $21.1 billion in 2012-13. Further, it's expected to grow until 2015-16. In just three years from 2008 to 2011 all the debt repayment ($105 billion) of the previous eight years was completely wiped out." Each Canadian's share of this debt amounts to approximately $16,000. Surely there will come a point where the national debt will stop being an ideological debating point and simply become a mathematical issue - the ability or more accurately the inability to repay in real terms. And on the small matter of repayment - lets examine these debt levels in more detail. When you calculate complete public debt loads for various countries and include that often and conveniently overlooked matter of the future obligations for underfunded social programs, the picture does not appear promising (Note: The country labeled GRE to the left of the US and therefore with LESS public debt is Greece). Chart 1: Public Finances (% of GDP) Source: Morgan Stanley
- 2. But before we become too smug in Canada with our relatively "low" government debt levels let's not forget that simply looking at public finances does not tell the whole story. When you take into account total debt levels - Canada is at around 250% of GDP and notwithstanding the hypocritical concern of the Bank of Canada, continues to grow with the support of the historically low interest rates said bank has engineered. I believe Canada is going to face some debt challenges of its own in the not-too-distant future. Chart 2: G10 Debt Distribution Source: Haver Analytics, Morgan Stanley Research Remember that this chart does not attempt to account for the net present value of future healthcare and pension costs which due, to the proverbial "pig in the python" effect of the retiring baby-boomer generation, are due to escalate significantly. What happens when a state can no longer service its debt? Just like any other struggling borrower it defaults. How often does this happen? More often than you think and with a disproportionate number taking place in recent history.
- 3. Chart 3: Sovereign Defaults (Total number by period) Source: Econopicdata De jure sovereign defaults also exhibit an alarming tendency to occur in clusters - not a promising characteristic if this were to prove to be the case in our ongoing episode of sovereign debt distress. Chart 4: Sovereign Defaults or Restructurings (Number per year: 1824 - 2010) Source: UBS AG Sadly the two charts above actually understate the problem as they only catalogue de jure defaults and of course sovereign borrowers have a path not open to the average debtor on the street - they can print money. There have been many more subtle and pernicious de facto defaults arising from expansionary money supply
- 4. policies. In fact, one could argue that currency devaluation is the preferred default methodology of modern governments - witness the 97% loss of purchasing power of the US dollar since the inception of the Federal Reserve and the 95% loss of purchasing power of the Canadian dollar since the inception of the Bank of Canada. Despite the gravity of our current problems you might still conclude that sovereign defaults have occurred many times in the past and we survived them so how is our current situation any different? One word - "scale". To put the size of possible current sovereign defaults into perspective with those of the past - the largest nominal sovereign default in the world to date was Argentina in 2001 totaling $82 billion. The Eurozone PIIGS debt totals $4,800 billion. Knowing this, an inflationary default, if pursued, would have to be commensurately large. Food for thought. Certainly, the monetary powers that be show no sign of shying away from the task of producing the raw material for an inflationary default. I doubt it will come as a surprise to anyone who has been following the parabolic trajectory of global money supply that according to Lawrence Goodman, president of the Center for Financial Stability, the Federal Reserve has effectively become the dominant/marginal buyer and therefore the market for US government debt: "Last year the Fed purchased a stunning 61 percent of the total net Treasury issuance, up from negligible amounts prior to the 2008 financial crisis ...This not only creates the false appearance of limitless demand for U.S. debt but also blunts any sense of urgency to reduce supersized budget deficits." US Federal Reserve intervention in the government debt market is replacing demand from foreign lenders. Goodman notes that where once Japan and China had virtually an unlimited appetite for U.S. debt (tied to their need to recycle their US dollar surpluses as part of a mercantilist policy of suppressing the exchange values of their currencies) this may be waning. Goodman goes on to say "The Fed is in effect subsidizing U.S. government spending and borrowing via expansion of its balance sheet and massive purchases of Treasury bonds. This keeps Treasury interest rates abnormally low, camouflaging the true size of the budget deficit...Similarly, the Fed is providing preferential credit to the U.S. government and covering a rapidly widening gap between Treasury's need to borrow and a more limited willingness among market participants to supply Treasury with credit." The possibility that an inflationary default (at the very least in part) will be pursued by the G10 nations should be given some non-zero weighting in your investment decision-making. Even if you assign a low probability to such an event, the
- 5. consequences are obviously material. If you prefer, think of this exercise as buying monetary malfeasance insurance - which via certain asset classes can still be acquired for reasonable prices. Regards Stephen Johnston Legal Notice: Copyright material, please do not re-use without consent. The opinions, estimates, projections and other information contained herein are not intended and are not to be construed as an offer to sell, or a solicitation to buy any securities, including any exempt market securities, nor shall such opinions, estimates, projections and other information be considered as investment advice or as a recommendation to enter into any transaction. Please contact your registered investment adviser for information that is tailored to your specific needs.