Call Girls Hosur Just Call 7001305949 Top Class Call Girl Service Available
Diabetes mellitus
1. Diabetes Mellitus
Complicating Pregnancy
MARK B. LANDON, PATRICK M. CATALANO,
AND STEVEN G. GABBE CHAPTER 37
Pathophysiology 977 Congenital Malformations 986 Detection and Significance of
Normal Glucose Tolerance 977 Fetal Macrosomia 987 Gestational Diabetes Mellitus 992
Glucose Metabolism 977 Hypoglycemia 988 Treatment of the Patient with Type 1
Diabetes Mellitus 979 Respiratory Distress Syndrome 988 or Type 2 Diabetes Mellitus 994
Type 1 Diabetes Mellitus 980 Calcium and Magnesium Ketoacidosis 996
Type 2 Diabetes/Gestational Metabolism 989 Antepartum Fetal Evaluation 997
Diabetes 980 Hyperbilirubinema and Timing and Mode of Delivery 999
Amino Acid Metabolism 983 Polycythemia 989 Glucoregulation During Labor and
Lipid Metabolism 984 Maternal Classification and Risk Delivery 1000
Maternal Weight Gain and Energy Assessment 989 Management of the Patient with
Expenditure 984 Nephropathy 990 Gestational Diabetes 1000
Perinatal Morbidity and Mortality 985 Retinopathy 991 Counseling the Diabetic Patient 1002
Fetal Death 985 Coronary Artery Disease 992 Contraception 1003
KEY ABBREVIATIONS The introduction of insulin therapy 85 years ago
remains an important landmark in the care of pregnancy
American College of Obstetricians and ACOG for the diabetic woman. Before insulin became available,
Gynecologists pregnancy was not advised because it was likely to be
Biophysical profile BPP accompanied by fetal mortality and a substantial risk
Continuous subcutaneous insulin CSII for maternal death. Over the past 35 years, management
infusion (pump therapy) techniques have been developed which can prevent many
Depomedroxyprogesterone acetate DMPA complications of diabetic pregnancy. These advances,
Diabetic ketoacidosis DKA based on understanding of pathophysiology, now result
Disposition index DI in perinatal mortality rates in optimally managed cases
Gestational diabetes mellitus GDM that approach that of the normal population. This dra-
Glucose tolerance test GTT matic improvement in perinatal outcome can be largely
Glucose transporter GLUT attributed to clinical efforts to establish improved mater-
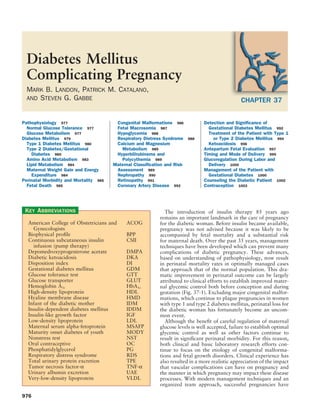
Hemoglobin A1c HbA1c nal glycemic control both before conception and during
High-density lipoprotein HDL gestation (Fig. 37-1). Excluding major congenital malfor-
Hyaline membrane disease HMD mations, which continue to plague pregnancies in women
Infant of the diabetic mother IDM with type 1 and type 2 diabetes mellitus, perinatal loss for
Insulin-dependent diabetes mellitus IDDM the diabetic woman has fortunately become an uncom-
Insulin-like growth factor IGF mon event.
Low-density lipoprotein LDL Although the benefit of careful regulation of maternal
Maternal serum alpha-fetoprotein MSAFP glucose levels is well accepted, failure to establish optimal
Maturity onset diabetes of youth MODY glycemic control as well as other factors continue to
Nonstress test NST result in significant perinatal morbidity. For this reason,
Oral contraceptive OC both clinical and basic laboratory research efforts con-
Phosphatidylglycerol PG tinue to focus on the etiology of congenital malforma-
Respiratory distress syndrome RDS tions and fetal growth disorders. Clinical experience has
Total urinary protein excretion TPE also resulted in a more realistic appreciation of the impact
Tumor necrosis factor-α TNF-α that vascular complications can have on pregnancy and
Urinary albumin excretion UAE the manner in which pregnancy may impact these disease
Very-low-density lipoprotein VLDL processes. With modern management techniques and an
organized team approach, successful pregnancies have
976
2. Chapter 37 Diabetes Mellitus Complicating Pregnancy 977
45
40
35
Perinatal mortality rate %
30
25
Figure 37-1. Perinatal mortality
rate in pregnancy complicated 20
by insulin-dependent diabetes
mellitus. 15
10
5
0
1925 1935 1945 1955 1965 1975 1985 Present
Time period
become the norm even for women with the most com- postprandial glucose levels and increased insulin response
plicated diabetes. in late gestation. However, early gestation can be viewed
Gestational diabetes mellitus (GDM), the most common as an anabolic state because of the increases in maternal
type of diabetes found in pregnancy, represents a continu- fat stores and decrease in free fatty acid concentration.
ing challenge for both clinicians and investigators. After Weiss et al.1 have described significant decreases in mater-
40 years since the concept of GDM was introduced, the nal insulin requirements in early gestation. The mecha-
clinical significance of this disorder, particularly in its nism for this decrease in insulin requirements have been
mildest variety, sparks great debate. Controversy also ascribed to various factors including increased insulin
remains concerning screening techniques, diagnostic cri- sensitivity, decreased substrate availability secondary to
teria, thresholds for insulin initiation, and whether oral factors such as nausea, the fetus acting as a glucose sink,
hypoglycemic agents are suitable treatment. or enhanced maternal insulin secretion. Longitudinal
Before considering these clinical issues, it is important studies in women with normal glucose tolerance have
to understand the metabolic effects of pregnancy in rela- shown significant alterations in all aspects of glucose
tion to the pathophysiology of diabetes mellitus. metabolism as early as the end of the first trimester.2
There are progressive increases in insulin secretion in
response to an intravenous glucose challenge with advanc-
PATHOPHYSIOLOGY ing gestation (Fig. 37-2A and B). The increases in insulin
concentration are more pronounced in lean as compared
Normal Glucose Tolerance to obese women, most probably as a response to the
greater decreases in insulin sensitivity in lean women as
There are significant alterations in maternal metabolism will be described later. Data regarding insulin clearance in
during pregnancy, which provide for adequate maternal pregnancy are limited. In separate studies Bellman,3 Lind
nutritional stores in early gestation in order to meet the et al.,4 and Burt and Davidson5 reported no difference
increased maternal and fetal demands of late gestation in insulin disappearance rate when insulin was infused
and lactation. Although we are apt to think of diabetes intravenously in late gestation in comparison with non-
mellitus as a disorder exclusively of maternal glucose gravid subjects. In contrast, Goodner and Freinkel,6 using
metabolism, in fact, diabetes mellitus affects all aspects a radiolabeled insulin described a 25-percent increase
of nutrient metabolism. In this section, we will consider in insulin turnover in a pregnant as compared with a
maternal glucose metabolism as it relates to pancreatic nonpregnant rat model. Catalano et al.7 using the eug-
β-cell production of insulin and insulin clearance, endog- lycemic-clamp model reported a 20-percent increase in
enous (i.e., primarily hepatic) glucose production and insulin clearance in lean women and 30-percent increase
suppression with insulin and peripheral glucose insulin in insulin clearance in obese women by late pregnancy
sensitivity. We also address maternal protein and lipid (Fig. 37-3). Although the placenta is rich in insulinase,
insulin metabolism. Finally, the impact of these alterna- the exact mechanism for the increased insulin clearance
tions on maternal metabolism are examined as they relate in pregnancy remains speculative.
to maternal energy expenditure and fetal growth. Although there is a progressive decrease in fasting glucose
with advancing gestation, the decrease is most probably a
result of the increase in plasma volume in early gestation
Glucose Metabolism and increase in fetoplacental glucose use in late gestation.
Kalhan and Cowett,8,9 using various stable isotope meth-
Normal pregnancy has been characterized as a dia- odologies in cross-sectional study designs, were the first
betogenic state because of the progressive increase in to describe increased fasting hepatic glucose production
3. 978 Section VI Pregnancy and Coexisting Disease
900 Lean control 800 Lean control
Obese control Obese control
800 700
Insulin clearance (ml/m2/min)
700
600
600
Insulin ( U/ml)
500
500
400
400
300
300
200
200
100 100
0 0
Pregravid Early Late Pregravid Early Late
A pregnancy pregnancy pregnancy pregnancy
8000 Lean control Figure 37-3. Longitudinal increases in metabolic clearance rate
Obese control of insulin (ml/m2/min) in lean and obese women with normal
glucose tolerance; pregravid, and early and late pregnancy.
6000 200 Lean control
Obese control
Insulin ( U/ml)
4000 175
Glucose (mg/min)
2000 150
0 125
Pregravid Early Late
B pregnancy pregnancy
Figure 37-2. Longitudinal increase in insulin response to an
intravenous glucose challenge in lean and obese women 100
with normal glucose tolerance, pregravid, and early and late Pregravid Early Late
pregnancy. A, First phase: Area under the curve from 0 to 5 pregnancy pregnancy
minutes. B, Second phase: Area under the curve from 5 to Figure 37-4. Longitudinal increase in basal endogenous (pri-
60 minutes. marily hepatic) glucose production (mg/min) in lean and obese
women with normal glucose tolerance; pregravid, early and late
pregnancy.
in late pregnancy. Additionally, Catalano et al.,10 using
a stable isotope of glucose in a prospective longitudinal
study design reported a 30-percent increase in maternal Estimates of peripheral insulin sensitivity in pregnancy
fasting hepatic glucose production with advancing gesta- have included the measurement of insulin response to a
tion (Fig. 37-4), which remained significant even when fixed oral or intravenous glucose challenge or the ratio of
adjusted for maternal weight gain. Tissue sensitivity to insulin to glucose under a variety of experimental condi-
insulin involves both liver and peripheral tissues, pri- tions. In recent years, newer methodologies such as the
marily skeletal muscle. The increase in fasting maternal minimal model12 and the euglycemic-hyperinsulinemic13
hepatic glucose production occurred despite a significant clamp have improved our ability to quantify peripheral
increase in fasting insulin concentration, thereby indicat- insulin sensitivity. In lean women in early gestation,
ing a decrease in maternal hepatic glucose sensitivity in Catalano et al.14 reported a 40-percent decrease in
women with normal glucose tolerance. Additionally, in maternal peripheral insulin sensitivity using the eugly-
obese women, there was a decreased ability of infused cemic-hyperinsulinemic clamp. However, when adjusted
insulin to suppress hepatic glucose production in late for changes in insulin concentrations during the clamp
gestation as compared with pregravid and early pregnancy and residual hepatic glucose production (i.e., the insulin
measurements, thereby indicating a further decrease in sensitivity index), insulin sensitivity decreased only 10
hepatic insulin sensitivity11 in obese women. percent (Fig. 37-5). In contrast there was a 15-percent
4. Chapter 37 Diabetes Mellitus Complicating Pregnancy 979
0.20 Lean control resistance such as leptin, tumor necrosis factor-α (TNF-
Obese control α), and resistin. Among these factors, TNF-α and leptin
are known to be produced in the placenta and, therefore,
could play a central role in the development of insulin
0.15 resistance. A recent study by Kirwan et al.23 reported
Insulin sensitivity index
that TNF-α was inversely correlated with the changes
in insulin sensitivity before conception through late ges-
tation. In combination with other placental hormones,
0.10 multivariate stepwise regression analysis revealed that
TNF-α was the strongest independent predictor of insulin
sensitivity in pregnancy, accounting for approximately
half of the variance in the decrease in insulin sensitivity
0.05 during gestation.
Placenta glucose transport is a nonenergy requiring
process and takes place through facilitated diffusion.
Glucose transport is dependent on a family of glucose
0.00 transporters referred to as GLUT glucose transporter
Pregravid Early Late
pregnancy pregnancy
family. The principal glucose transporter in the pla-
centa is GLUT 1, which is located in the syncytiotro-
Figure 37-5. Longitudinal changes in the insulin sensitivity phoblast.24 GLUT 1 is located on both the microvillus
index (glucose infusion rate adjusted for residual endogenous
glucose production and insulin concentrations achieved during
and basal membranes. Basal membrane GLUT 1 may
the glucose clamp) in lean and obese women with normal be the rate-limiting step in placental glucose transport.
glucose tolerance, pregravid, and early and late gestation. There is a two- to threefold increase in the expression of
syncytiotrophoblast glucose transporters with advancing
gestation.25 Although GLUT 3 and GLUT 4 expression
increase in the insulin sensitivity index in obese women in have been identified in placental endothelial cells and
early pregnancy as compared with pregravid estimates.15 intervillous nontrophoblastic cells, respectively, the role
Hence, the decrease in insulin requirements in early ges- they may play in placental glucose transport remains
tation observed in some women requiring insulin may speculative.26,27
be a consequence of an increase in insulin sensitivity,
particularly in women with decreased insulin sensitivity
prior to conception. DIABETES MELLITUS
As compared with the metabolic alterations in early
pregnancy, there is a uniformity of opinion regarding the Diabetes mellitus is a chronic metabolic disorder char-
decrease in peripheral insulin sensitivity in late gestation. acterized by either absolute or relative insulin deficiency,
Spellacy and Goetz16 were among the first investigators resulting in increased glucose concentrations. Although
to report an increase in insulin response to a glucose glucose intolerance is the common outcome of diabetes
challenge in late gestation. Additionally, Burt17 demon- mellitus, the pathophysiology remains heterogeneous.
strated that pregnant women experienced less hypoglyce- The two major classifications of diabetes mellitus are
mia in response to exogenous insulin in comparison with type 1, formerly referred to as insulin-dependent dia-
nonpregnant subjects. Later research by Fisher et al.18 betes or juvenile onset diabetes, and type 2, formerly
using a high-dose glucose infusion test, Buchanan et al.19 referred to as non–insulin-dependent or adult-onset dia-
using the Bergman minimal model, and Ryan et al.20 and betes. During pregnancy, classification of women with
Catalano et al.2 using the euglycemic-hyperinsulinemic diabetes has often relied on the White classification,28
clamp have demonstrated a decrease in insulin sensitiv- first proposed in the 1940s. This classification is based on
ity ranging from 33 percent to 78 percent. It should be factors such as the age of onset of diabetes and duration,
noted, however, that all these quantitative estimates of as well as end organ involvement, primarily retinal and
insulin sensitivity are very likely overestimates due to renal (Table 37-1).
non–insulin-mediated glucose disposal by the fetus and All forms of diabetes can occur during pregnancy. In
placenta. Hay et al.21 reported that in the pregnant ewe addition to type 1 and type 2 diabetes, there are genetic
model, approximately one third of maternal glucose uti- causes of diabetes, the most common of which is maturity
lization was accounted for by uterine, placental, and fetal onset diabetes of the young (MODY). MODY is charac-
tissue. Additionally, Marconi et al.22 reported that based terized by β-cell dysfunction and is an autosomal domi-
on human fetal blood sampling, fetal glucose concentra- nant mode of inheritance, usually becoming manifest in
tion was a function of fetal size and gestational age in young adulthood. Mutations in the glucokinase gene are
addition to maternal glucose concentration. a frequent cause of MODY. Various mutations have been
Historically, the decrease in insulin sensitivity during described, and each mutation is associated with varying
pregnancy has been ascribed to an increased production degrees of disease severity. The most common of these
of various placental and maternal hormones, such as mutations (MODY2) occurs in the European popula-
human placental lactogen, progesterone, estrogen, cor- tion and involves the glucokinase gene. Because the age
tisol, and prolactin. However, more recent evidence has of onset of diabetes in women with MODY coincides
focused on the role of several new mediators of insulin with the reproductive years, it may be difficult to distin-
5. 980 Section VI Pregnancy and Coexisting Disease
Table 37-1. Modified White Classification of Pregnant
tory epinephrine and glucagon response to hypoglycemia.
Diabetic Women The deficiency in this counterregulatory response may be
in part due to an independent effect of pregnancy.
DIABETES The alterations in glucose metabolism in women with
ONSET DURATION VASCULAR INSULIN type 1 diabetes are not well characterized. Because of
CLASS AGE (Y) (Y) DISEASE NEED maternal insulinopenia, insulin response during gestation
can only be estimated relative to pregravid requirements.
Gestational diabetes Estimates of the change in insulin requirements are com-
A1 Any Any 0 0 plicated by the degree of preconceptual glucose control
A2 Any Any 0 + and potential presence of insulin antibodies. Weiss and
Pregestational diabetes Hofman1 reported on the change in insulin requirements
in women with type 1 diabetes and strict glucose control
B >20 <10 0 + either before conception or before 10 weeks’ gestation.
C 10–19 or 10–19 0 +
There was a 12-percent decrease in insulin requirements
D <10 or >20 + +
F Any Any + + from 10 to 17 weeks’ gestation and a 50-percent increase
R Any Any + + in insulin requirement from 17 weeks’ until delivery as
T Any Any + + compared with pregravid requirements. After 36 weeks’
H Any Any + + gestation, there was a decrease in insulin requirements. A
5-percent decrease in insulin requirements after 36 weeks’
Modified from White P: Pregnancy complicating diabetes. Am J Med gestation was also noted by McManus and Ryan.33 The
7:609, 1949.
decrease in insulin requirements was associated with a
longer duration of diabetes mellitus but not with adverse
perinatal outcome. The fall in insulin requirements in
guish between the two. The glucokinase gene acts as a early pregnancy in women with type 1 diabetes may be
sensor in the β-cell, which leads to a secretory defect in a reflection of increased pregravid insulin sensitivity as
insulin response. Ellard et al.29 reported that 2.5 percent was described previously.
of women with GDM in the United Kingdom have the Schmitz et al.34 have evaluated the longitudinal changes
glucokinase mutation, whereas Stoffel30 in a small popu- in insulin sensitivity in women with type 1 diabetes in
lation in the United States reported that 5 percent of early and late pregnancy as well as postpartum in com-
patients had a glucokinase mutation. The implication parison with nonpregnant women with type 1 diabetes.
is that if the mother has the mutation, the fetus is at an In the pregnant women with type 1 diabetes, there was
increased risk for macrosomia. The implications for the a 50-percent decrease in insulin sensitivity only in late
fetus, if the mutation is inherited from the father, are gestation. There was no significant difference in insulin
a significant decrease in growth secondary to relative sensitivity in pregnant women with type 1 diabetes in
insulinopenia. early pregnancy or within 1 week of delivery as com-
pared with the nonpregnant women with type 1 diabetes.
Therefore, based on the available data women with type
Type 1 Diabetes Mellitus 1 diabetes appear to have a similar decrease in insulin
sensitivity when compared with women with normal
Type 1 diabetes mellitus is usually characterized by glucose tolerance.
an abrupt onset at a young age and absolute insulinope- Relative to the issue of placental transporters (GLUT
nia with life-long requirements for insulin replacement, 1), there is a report by Jansson and Powell35 describing
although depending on the population, the onset of type 1 an increase in both basal GLUT 1 expression and glucose
diabetes may occur in individuals in their third or fourth transport activity from placental tissue in women with
decades of life. Patients with diabetes mellitus may have White class D pregnancies.
a genetic predisposition for antibodies directed against
their pancreatic islet cells. The degree of concordance
for the development of type 1 diabetes in monozygotic Type 2 Diabetes/Gestational Diabetes
twins is 33 percent, suggesting that the events subsequent
to the development of autoantibodies and appearance The pathophysiology of type 2 diabetes involves abnor-
of glucose intolerance are also related to environmental malities of both insulin sensitive tissue (i.e., both a decrease
factors. Because of the complete dependence on exog- in skeletal muscle and hepatic sensitivity to insulin) and
enous insulin, pregnant women with type 1 diabetes are β-cell response as manifested by an inadequate insulin
at increased risk for the development of diabetic keto- response for a given degree of glycemia. Initially in the
acidosis (DKA). Additionally, because intensive insulin course of development of type 2 diabetes, the insulin
therapy is used in women with type 1 diabetes to decrease response to a glucose challenge may be increased relative
the risk for spontaneous abortion and congenital anoma- to that of individuals with normal glucose tolerance but
lies in early gestation, these women are at increased risk is inadequate to maintain normoglycemia. Whether or
for hypoglycemic reactions. Studies by Diamond et al.31 not decreased insulin sensitivity precedes β-cell dysfunc-
and Rosenn et al.32 have shown that women with type 1 tion in the development of type 2 diabetes continues to
diabetes are at increased risk for hypoglycemic reactions be debated. Arguments and experimental data support
during pregnancy because of diminished counterregula- both hypotheses. As noted by Sims and Calles-Escadon,36
6. Chapter 37 Diabetes Mellitus Complicating Pregnancy 981
heterogeneity of metabolic abnormalities exists in any 900 Lean control
classification of diabetes mellitus. Obese control
Despite the limitations of any classification system, 800
Lean GDM
certain generalizations can be made regarding women Obese GDM
700
with type 2 or GDM. These individuals are typically
older and more often heavier compared with individu- 600
Insulin ( U/ml)
als with type 1 diabetes or normal glucose tolerance.
The onset of the disorder is usually insidious, with few 500
patients complaining of classical triad of polydipsia,
polyphagia, and polyuria. Individuals with type 2 diabetes 400
are often initially recommended to lose weight, increase
300
their activity (i.e., exercise), and follow a diet that is low
in fats and high in complex carbohydrates. Oral agents 200
are often used to either increase insulin response or, with
newer drugs, enhance insulin sensitivity. Individuals with 100
type 2 diabetes may eventually require insulin therapy in
order to maintain euglycemia but are at significantly less 0
A Pregravid Early pregnancy Late pregnancy
risk for DKA. Data from monozygotic twin studies have
reported a lifetime risk of both twins developing type 2 8000 Lean control
diabetes that ranges between 58 percent and almost 100 Obese control
percent, suggesting that the disorder has a strong genetic 7000 Lean GDM
component. Obese GDM
Women with type 2 pregestational diabetes are usually 6000
classified as class B diabetes according to the White clas-
sification system. Women developing GDM (i.e., glucose Insulin ( U/ml) 5000
intolerance first recognized during pregnancy) share
many of the metabolic characteristics of women with 4000
type 2 diabetes. Although earlier studies reported a 10-
to 35-percent incidence of islet cell antibodies in women 3000
with GDM as measured by immunofluorescence tech-
niques,37,38 more recent data using specific monoclonal 2000
antibodies have described a much lower incidence, on the
order of 1 to 2 percent,39 suggesting a low risk of type 1 1000
diabetes in women with GDM. Furthermore, postpartum
studies of women with GDM have demonstrated defects 0
in insulin secretory response40 and decreased insulin sen- B Pregravid Early pregnancy Late pregnancy
sitivity,41 indicating that typical type 2 abnormalities in Figure 37-6. A and B, Longitudinal increase in insulin response
glucose metabolism are present in women with GDM. Of to an intravenous glucose challenge in lean and obese women
interest, the alterations in insulin secretory response and with normal glucose tolerance and gestational diabetes; pre-
insulin resistance in women with a previous history of gravid, early and late pregnancy. A, First phase: Area under the
curve from 0 to 5 min. B, Second phase: Area under the curve
GDM as compared with a weight-matched control group
from 5 to 60 min.
may differ depending on whether or not the women with
previous GDM are lean or obese.42 Thus, in women
with GDM, the hormonal events of pregnancy may repre- differences in insulin response may be related to the
sent an unmasking of a genetic susceptibility to type 2 ethnicity of the various study groups. Although there
diabetes. is an increase in the metabolic clearance rate of insulin
There are significant alterations in glucose metabolism with advancing gestation, there is no evidence that there
in women who develop GDM relative to the changes in is a significant difference between women with normal
glucose metabolism in women with normal glucose toler- glucose tolerance and GDM.15
ance. Decreased insulin response to a glucose challenge There is a significant decrease in fasting glucose concen-
has been demonstrated by Yen et al.,43 Fisher et al.,44 tration with advancing gestation in women developing
and Buchanan et al.19 in women with GDM in late gesta- GDM. In late pregnancy, glucose and hepatic glucose
tion. In prospective longitudinal studies of both lean and production increase in women with GDM in comparison
obese women with GDM, Catalano et al.14 also showed a with a control group.45 Whereas there was no signifi-
progressive decrease in first-phase insulin response in late cant difference in either fasting glucose concentration or
gestation in lean women developing GDM as compared hepatic glucose production in the longitudinal studies of
with a weight-matched control group (Fig. 37-6A). In Catalano et al.,14,15 these differences may again be popu-
contrast, in obese women developing GDM, there was lation specific or related to the degree of fasting hypo-
no difference in first-phase insulin response but rather glycemia. However, to date all reports indicate that in
a significant increase in second-phase insulin response late gestation, women with GDM have increased fasting
to an intravenous glucose challenge as compared with insulin concentrations (Fig. 37-7) and less suppression
a weight-matched control group (see Fig. 37-6B). These of hepatic glucose production during insulin infusion,
7. 982 Section VI Pregnancy and Coexisting Disease
45 Lean control 0.20 Lean control
Obese control Obese control
40
Lean GDM Lean GDM
35 Obese GDM Obese GDM
0.15
Insulin sensitivity index
30
Insulin ( U/ml)
25
0.10
20
15
0.05
10
5
0 0
Pregravid Early pregnancy Late pregnancy Pregravid Early pregnancy Late pregnancy
Figure 37-7. Longitudinal increase in basal or fasting insulin Figure 37-8. Longitudinal changes in the insulin sensitivity
(µ/ml) in lean and obese women with normal glucose toler- index (glucose infusion rate adjusted for residual endogenous
ance and gestational diabetes; pregravid, and early and later glucose production and insulin concentrations achieved during
pregnancy. the glucose clamp) in lean and obese women with normal
glucose tolerance and gestational diabetes; pregravid, early
and late pregnancy.
thereby indicating decreased hepatic glucose insulin sen-
sitivity in women with GDM as compared with a weight-
matched control group.14,15,45 In the studies of Xiang 1000
et al.,45 there was significant correlation between fasting
free fatty acid concentrations and hepatic glucose produc-
Insulin secretion rate (ISR)
800
tion, suggesting that increased free fatty acid concentra-
tions may contribute to hepatic insulin resistance.
Women with GDM have decreased insulin sensitivity 600 Normal
in comparison with weight-matched control groups.
Ryan et al.20 was the first to report a 40-percent decrease GDM
400
in insulin sensitivity in women with GDM in comparison
with a pregnant control group in late pregnancy using
a hyperinsulinemic-euglycemic clamp. Xiang et al.,45 200
found that women with GDM who had normal glucose
tolerance within 6 months of delivery had significantly 0
decreased insulin sensitivity as estimated by the glucose 0.0 0.1 0.2 0.3 0.4
clearance rate during a hyperinsulinemic-euglycemic Insulin sensitivity index (ISI)
clamp, as compared with a matched control group.
Catalano et al.,14,15 using similar techniques, described 3rd trimester
the longitudinal changes in insulin sensitivity in both Postpartum
lean and obese women developing GDM in comparison Figure 37-9. Insulin sensitivity index.
with a matched control group. Women developing GDM
had decreased insulin sensitivity as compared with the
matched control group (Fig. 37-8). The differences in The interactions of β-cell response and insulin sensitivity
insulin sensitivity were greatest before and during early are hallmarks of the metabolic adaptations of pregnancy.
gestation, and by late gestation, the differences in insulin As described by Bergman,47 there is a fixed relationship
sensitivity between the groups were less pronounced but between insulin response and insulin resistance in non-
still significant. Of interest, there was an increase in insulin pregnant individuals following a hyperbolic curve, i.e.,
sensitivity from the time prior to conception through the disposition index. Buchanan48 described a similar
early pregnancy (12 to 14 weeks), particularly in those relationship between insulin response and insulin action
women with greatest decreases in insulin sensitivity prior during pregnancy. Indeed, when the disposition index
to conception. The changes in insulin sensitivity from the has been compared between women with normal glucose
time before conception through early pregnancy were tolerance and GDM both during and after pregnancy, the
significantly correlated with changes in maternal weight failure of the β-cell to compensate for insulin resistance
gain and energy expenditure.46 The relationship between in GDM has been similar to the hyperbolic changes in
these alterations in maternal glucose insulin sensitivity the control group (Fig. 37-9). This relationship between
and weight gain and energy expenditure may help explain insulin sensitivity and insulin resistance, however, may
the decrease in maternal weight gain and insulin require- not hold in early pregnancy when there is both an increase
ments in women with diabetes in early gestation.1 in insulin sensitivity and insulin response.
8. Chapter 37 Diabetes Mellitus Complicating Pregnancy 983
IR
Ras IRS-1/2 Glucose
transport
Raf P85 PI-3-K P110
GLUT4
Figure 37-10. Schematic model of insulin signaling
GLUT4
cascade in skeletal muscle. GLUT, glucose trans- MAPK
porter; IR, insulin receptor; IRS, insulin receptor GLUT4
substrate. PKB
Mitogenesis
gene transcription
GSK3
Glycogen
synthesis
Studies in human skeletal muscle and adipose tissue acid concentrations in early pregnancy prior to the
have demonstrated that postreceptor defects in the accretion of significant maternal or fetal tissue.52 These
insulin signaling cascade are related to decreased insulin anticipatory changes in fasting amino acid metabolism
sensitivity in pregnancy. Garvey et al.49 were the first to occur after a shorter period of fasting in comparison
demonstrate that there were no significant differences in with nonpregnant women, and may be another example
the glucose transporter (GLUT 4) responsible for insulin of the accelerated starvation of pregnancy as described
action and skeletal muscle in pregnant as compared with by Freinkel.53 Furthermore, amino acid concentrations
nonpregnant women. Based on the studies of Friedman such as serine correlate significantly with fetal growth
et al.50 in both pregnant women with normal glucose in both early and late gestation.54 Maternal amino acid
tolerance and GDM as well as weight-matched nonpreg- concentrations were significantly decreased in mothers
nant control subjects, there appeared to be defects in the of small-for-gestational-age neonates in comparison
insulin-signaling cascade relating to pregnancy as well as with maternal concentration in appropriately grown
what may be additional abnormalities in women with neonates.55
GDM. All pregnant women appeared to have a decrease Based on a review of various studies, Duggleby and
in insulin receptor substrate-1 (IRS-1) expression. The Jackson56 have estimated that during the first trimester
down-regulation of the IRS-1 protein closely parallels the of a pregnancy, protein synthesis is similar to that of
decreased ability of insulin to induce additional steps in nonpregnant. However, there is a 15-percent increase
the insulin signaling cascade, resulting in movement of in protein synthesis during the second trimester and
the GLUT 4 to the cell surface membrane and to facili- a further increase in the third trimester by about 25
tate glucose transport into the cell. The downregulation percent. Additionally, there are marked interindividual
of IRS-1 protein closely parallels the ability of insulin differences at each time point. These differences have a
to stimulate 2-deoxyglucose uptake in vitro. In addi- strong relationship with fetal growth, that is, mothers
tion to the above-mentioned mechanisms, women with who had increased protein turnover in midpregnancy had
GDM demonstrate a distinct decrease in the ability of the babies who had increased lean body mass after adjust-
insulin receptor β (that component of the insulin receptor ment for significant covariables.57
not on the cell surface) to undergo tyrosine phosphoryla- Amino acids can be used either for protein accrual or
tion. The additional defect in the insulin signaling cascade oxidized as an energy source. Urea synthesis has been
results in a 25-percent lower glucose transport activity estimated in a number of studies using stable isotopes.
(Fig. 37-10). In general, there is a modest shift in oxidation in early
pregnancy, with an accrual of amino acids for protein
synthesis in late gestation.56 Furthermore, Kalhan et al.58
Amino Acid Metabolism reported that there are significant pregnancy-related adap-
tations in maternal protein metabolism early in gestation
Although glucose is the primary source of energy before any significant increase in fetal protein accretion.
for the fetus and placenta, there are no appreciable Preliminary studies by Catalano et al.59 have reported
amounts of glucose stored as glycogen in the fetus or that there is decreased insulin sensitivity as manifested
placenta. However, accretion of protein is essential for by a decreased suppression of leucine turnover during
growth of fetoplacental tissue. There is increased nitro- insulin infusion in late gestation in all pregnant women.
gen retention in pregnancy in both maternal and fetal There is evidence for an increase in basal leucine turn-
compartments. There is an increase of approximately over in women with GDM as compared with a matched
0.9 kg of maternal fat-free mass by 27 weeks.51 There control group. Whether these decreases in amino acid
is a significant decrease in most fasting maternal amino insulin sensitivity are related to decreased whole body/
9. 984 Section VI Pregnancy and Coexisting Disease
liver protein synthesis or increased breakdown are not infants of obese women had an increased birth weight
known at this time. and skinfold thickness, and higher free fatty acid levels
Recently, Cetin et al.60 reported that placental amino when compared with infants of lean women.
acid exchange is altered in pregnancies complicated Lipid metabolism in women with diabetes mellitus is
by GDM. Ornithine concentrations were significantly influenced by whether the woman has type 1 or type 2
increased in women with GDM as compared with con- diabetes. This also applies when these women become
trols, and in the cord blood of infants of women with pregnant. In women with type 2 diabetes and GDM,
GDM, there were significant increases in multiple amino Knopp et al.64 reported an increase in triglyceride and a
acids including phenylalanine and leucine but decreases decrease in HDL concentration. However, Montelongo
in glutamate. The investigators speculate that in infants et al.65 reported little change in free fatty acid concentra-
of women with GDM, the altered in utero fetal milieu tions through all three trimesters after a 12-hour fast.
impacts fetal growth through multiple mechanisms, Koukkou et al.66 noted an increase in total triglyceride
affecting various nutrient compartments. but a lower LDL cholesterol in women with GDM. In
Amino acids are actively transported across the placenta women with type 1 diabetes, there was no change in total
from mother to fetus through energy-requiring amino acid triglyceride but a lower cholesterol concentration, sec-
transporters. These transporters are highly stereospecific, ondary to a decrease in HDL. This is of interest because
but they have low substrate specificity. Additionally, they HDL acts as plasma antioxidant and thus may be related
may vary with location between the microvillus and basal to the increase in congenital malformations in women
membranes.61 Decreased amino acid concentrations have with type 1 diabetes. Oxidative stress has been implicated
been reported in growth restricted neonates in compari- as a potential factor in the incidence of anomalies in
son with appropriately grown neonates. Decreased amino women with type 1 diabetes.
acid transporter activity has been implicated as a pos- Hyperinsulinemic-euglycemic clamp studies in preg-
sible mechanism. However, the potential role, if any, of nant women with normal glucose tolerance and GDM
placental amino acid transporters in the development of revealed a decreased ability of insulin to suppress plasma
fetal macrosomia in women with diabetes is currently free fatty acids with advancing gestation. Insulin’s ability
unknown.62 to suppress plasma free fatty acid was lower in women
with GDM as compared to women with normal glucose
tolerance.67
Lipid Metabolism Taken together, these studies demonstrate that there is
decreased nutrient insulin sensitivity in all women with
Although there is ample literature regarding the changes advancing gestation. These decreases in insulin sensitiv-
in glucose metabolism during gestation, the data regard- ity are further exacerbated by the presence of decreased
ing the alterations in lipid metabolism are meager by pregravid maternal insulin sensitivity, which becomes
comparison. Darmady and Postle measured serum choles- manifest in later pregnancy as GDM, resulting in greater
terol and triglyceride before, during, and after pregnancy nutrient availability and higher ambient insulin concen-
in 34 normal women.63 There was a decrease in both trations for the developing fetoplacental unit, which may
cholesterol and triglyceride at approximately 7 weeks’ eventually result in fetal overgrowth.
gestation. Both of the levels increased progressively until
term. There was then a decrease in serum triglyceride
postpartum. The decrease was more rapid in women who Maternal Weight Gain and
breast-fed compared with those women who bottle fed Energy Expenditure
their infants.63 Additionally, Knopp et al.64 have reported
that there is a two- to fourfold increase in total trigly- Estimates of the energy cost of pregnancy range from a
ceride concentration and a 25- to 50-percent increase in cost of 80,000 kcal to a net saving of up to 10,000 kcal.66
total cholesterol concentration during gestation. There is As a result, the recommendations for nutritional intake in
a 50-percent increase in low-density lipoprotein (LDL) pregnancy differ and depend upon the population being
cholesterol and a 30-percent increase in high-density evaluated. Furthermore, based on more recent data, rec-
lipoprotein (HDL) cholesterol by midgestation, which ommendations for individuals within a population may
decreases slightly in the third trimester. Maternal trigly- be more varied than previously believed, making general
ceride and very-low-density lipoprotein (VLDL) levels guidelines for nutritional intake difficult.68,69
in late gestation are positively correlated with maternal The theoretical energy cost of pregnancy was originally
estriol and insulin concentrations. estimated by Hytten51 using a factorial method. The addi-
Free fatty acids have been associated with fetal over- tional cost of pregnancy consisted of (1) the additional
growth, particularly of fetal adipose tissue. There is a maternal and fetoplacental tissue accrued during preg-
significant difference in the arteriovenous free fatty acid nancy and (2) the additional “running cost” of preg-
concentration at birth much as there is with arteriovenous nancy (e.g., the work of increased cardiac output). In
glucose concentration. Knopp et al.64 reported that neo- Hytten’s model, the greatest increases in maternal energy
natal birth weight was positively correlated with triglyc- expenditure occur between 10 and 30 weeks’ gestation,
eride and free fatty acid concentration in late pregnancy. primarily because of maternal accretion of adipose tissue.
Similar conclusions were reached by Ogburn et al.,61 who However, the mean increases in maternal adipose tissue
showed that higher insulin concentrations decrease free vary considerably among various ethnic groups. Forsum
fatty acid concentrations, inhibit lipolysis and result in et al.70 reported a mean increase of more than 5 kg of
increased fat deposition. Last, Kleigman62 reported that adipose tissue in Swedish women, whereas Lawrence
10. Chapter 37 Diabetes Mellitus Complicating Pregnancy 985
et al.71 found no increase in adipose tissue stores in show that there is a relationship between the changes in
women from the Gambia. maternal insulin sensitivity and accretion of adipose tissue
Basal metabolic rate accounts for 60 to 70 percent in early gestation.78 The ability of women with decreased
of total energy expenditure in individuals not engaged pregravid glucose insulin sensitivity (obese women and
in competitive physical activity and correlates well with women with GDM) to conserve energy, not significantly
total energy expenditure. As with the changes in mater- increase body fat, and make sufficient nutrients avail-
nal accretion of adipose tissue, there are wide variations able to produce a healthy fetus, supports the hypothesis
in the change in maternal basal metabolic rate during that decreased maternal insulin sensitivity may have a
gestation, not only in different populations but again reproductive metabolic advantage in women when food
within relatively homogeneous groups. The cumulative availability is marginal. In contrast, decreased maternal
energy changes in basal metabolic rate range from a insulin sensitivity before conception in areas where food
high of 52,000 kcal in Swedish women72 to a net savings is plentiful and a sedentary lifestyle is more common
of 10,700 kcal in women from the Gambia71 without may manifest itself as GDM and increase the long-term
nutritional supplementation. The mean increase in basal risk for both diabetes and obesity in the woman and her
metabolic rate in Western women relative to a nonpreg- offspring.79
nant, nonlactating control group averages approximately
20 percent.71 However, the coefficient of variation of
basal metabolic rate in these populations during gestation
ranges from 93 percent in women in the United Kingdom72 PERINATAL MORBIDITY
to more than 200 percent in Swedish women.70 When AND MORTALITY
assessing energy intake in relation to energy expenditure,
however, estimated energy intake remains lower than Fetal Death
the estimates of total energy expenditure. These discrep-
ancies have usually been examined by factors such as In the past, sudden and unexplained stillbirth occurred
(1) increased metabolic efficiency during gestation,73 (2) in 10 to 30 percent of pregnancies complicated by type
decreased maternal activity,74 and (3) unreliable assess- 1 diabetes mellitus insulin-dependent diabetes mellitus,
ment of food intake.75 (IDDM).80,81 Although relatively uncommon today, such
Data in nonpregnant subjects may help explain some losses still plague the pregnancies of patients who do
of the wide variations in metabolic parameters during not receive optimal care. Stillbirths have been observed
human gestation, even with homogeneous populations. most often after the 36th week of pregnancy in patients
Swinburn et al.76 reported that in the Pima Indian popula- with vascular disease, poor glycemic control, hydramnios,
tion, subjects with decreased insulin sensitivity gained less fetal macrosomia, or preeclampsia. Women with vascular
weight as compared with more insulin-sensitive subjects complications may develop fetal growth restriction and
(3.1 versus 7.6 kg) over a period of 4 years. Furthermore, intrauterine demise as early as the second trimester. In the
the percentage weight change per year was highly cor- past, prevention of intrauterine death led to a strategy of
related with glucose disposal as estimated from clamp scheduled preterm deliveries for type 1 diabetic women.
studies. Catalano et al.77 conducted a prospective longitu- This empiric approach reduced the number of stillbirths,
dinal study in early pregnancy of the changes in maternal but errors in estimation of fetal size and gestational age
accretion of body fat and basal metabolic rate in lean and as well as the functional immaturity characteristic of
obese women with normal GDM. Women with GDM the infant of the diabetic mother (IDM) contributed to
had decreased insulin sensitivity for glucose in early many neonatal deaths from hyaline membrane disease
gestation as compared with the control group and had (HMD).
significantly smaller increases in body fat than women The precise cause of the excessive stillbirth rate in
with normal glucose tolerance. In these lean women, there pregnancies complicated by diabetes remains unknown.
was a significant inverse correlation between the changes Because extramedullary hematopoiesis is frequently
in fat accretion and insulin sensitivity (i.e., women with observed in stillborn IDMs, chronic intrauterine hypoxia
decreased pregravid insulin sensitivity had less accretion has been cited as a likely cause of these intrauterine fetal
of body fat as compared with women with increased deaths. Studies of fetal umbilical cord blood samples in
pregravid insulin sensitivity). These results are consistent pregnant women with type 1 diabetes have demonstrated
with a previous report showing that total weight gain in “relative fetal erythremia and lactic acidemia.”82 Mater-
women with GDM was 2.5 kg less as compared with a nal diabetes may also produce alterations in red blood
weight-matched control group.77 cell oxygen release and placental blood flow.83
In the basal state, lean women increase the use of car- Reduced uterine blood flow is thought to contribute to
bohydrate as a metabolic fuel, whereas in obese women, the increased incidence of intrauterine growth restriction
there is an increased use of lipids for oxidative needs. observed in pregnancies complicated by diabetic vascu-
However, with the decrease in insulin sensitivity in late lopathy. Investigations using radioactive tracers have also
gestation, all women lean or obese with normal glucose suggested a relationship between poor maternal meta-
tolerance or GDM have an increase in fat oxidation and bolic control and reduced uteroplacental blood flow.84
a decrease in nonoxidative glucose metabolism (storage). Ketoacidosis and preeclampsia, two factors known to
Of interest, these increases in lipid oxidation in pregnancy be associated with an increased incidence of intrauter-
are positively correlated with the increases in maternal ine deaths, may further decrease uterine blood flow. In
leptin concentrations, possibly accounting for a role of DKA, hypovolemia and hypotension caused by dehy-
leptin in human pregnancy. The results of these studies dration may reduce flow through the intervillous space,
11. 986 Section VI Pregnancy and Coexisting Disease
whereas in preeclampsia, narrowing and vasospasm of week of gestation.90 Central nervous system malforma-
spiral arterioles may result. tions, particularly anencephaly, open spina bifida, and,
Alterations in fetal carbohydrate metabolism also may possibly, holoprosencephaly, are increased 10-fold.90,91
contribute to intrauterine asphyxia.85,86 There is consider- Cardiac anomalies, especially ventricular septal defects
able evidence linking hyperinsulinemia and fetal hypoxia. and complex lesions such as transposition of the great
Hyperinsulinemia induced in fetal lambs by an infusion vessels, are increased fivefold. The congenital defect
of exogenous insulin produces an increase in oxygen con- thought to be most characteristic of diabetic embryopa-
sumption and a decrease in arterial oxygen content.85,86 thy is sacral agenesis or caudal dysplasia, an anomaly
Persistent maternal-fetal hyperglycemia occurs indepen- found 200 to 400 times more often in offspring of dia-
dent of maternal uterine blood flow, which may not be betic women (Fig. 37-11). However, this defect is not
increased enough to allow for enhanced oxygen delivery pathognomonic for diabetes, since it occurs in nondia-
in the face of increased metabolic demands. Thus, hyper- betic pregnancies.
insulinemia in the fetus of the diabetic mother appears to Impaired glycemic control and associated derangements
increase fetal metabolic rate and oxygen requirement in in maternal metabolism appear to contribute to abnormal
the face of several factors such as hyperglycemia, ketoaci- embryogenesis. The notion of excess glucose as the single
dosis, preeclampsia, and maternal vasculopathy, which teratogenic agent in diabetic pregnancy has thus been
can reduce placental blood flow and fetal oxygenation. replaced with the view of a multifactorial etiology90 (see
the box “Proposed Factors Associated with Teratogenesis
in Pregnancy Complicated by Diabetes Mellitus”).
Congenital Malformations Maternal hyperglycemia has been proposed by most
investigators as the primary teratogenic factor, but hyper-
With the reduction in intrauterine deaths and a marked ketonemia, hypoglycemia, somatomedin inhibitor excess,
decrease in neonatal mortality related to HMD and trau- and excess free oxygen radicals have also been sug-
matic delivery, congenital malformations have emerged gested.90 The profile of a woman most likely to produce
as the most important cause of perinatal loss in pregnan- an anomalous infant would include a patient with poor
cies complicated by type 1 and type 2 diabetes mellitus. periconceptional control, long-standing diabetes, and
In the past, these anomalies were responsible for only
10 percent of all perinatal deaths. At present, however,
malformations account for 30 to 50 percent of perinatal
mortality.81 Neonatal deaths now exceed stillbirths in
pregnancies complicated by pregestational diabetes mel-
litus, and fatal congenital malformations account for this
changing pattern.
Most studies have documented a two- to sixfold increase
in major malformations in infants of type 1 and type 2
diabetic mothers. At The Ohio State University Diabetes
in Pregnancy Program, we observed 29 congenital anom-
alies in 289 (10 percent) diabetic woman enrolled over a
10-year period.87 In a prospective analysis, Simpson et al.
observed an 8.5 percent incidence of major anomalies in
the diabetic population, whereas the malformation rate
in a small group of concurrently gathered control subjects
was 2.4 percent.88 Similar figures were obtained in the
Diabetes in Early Pregnancy Study in the United States.89
The incidence of major anomalies was 2.1 percent in
389 control patients and 9.0 percent in 279 diabetic
women. In general, the incidence of major malformations
in worldwide studies of offspring of diabetic mothers has
ranged from 5 to 10 percent (Table 37-2).
The insult that causes malformations in IDM impacts
on most organ systems and must act before the seventh
Figure 37-11. Infant of a diabetic mother.
Table 37-2. Frequency of Congenital Malformations in
Infants of Diabetic Mothers Proposed Factors Associated with Teratogenesis in
Pregnancy Complicated By Diabetes Mellitus
Mills90 25/279 9.0
Greene262 35/451 7.7 • Hyperglycemia
Steel and Duncan264 12/239 7.8 • Ketone body excess
Fuhrmann et al259 22/292 7.5 • Somatomedin inhibition
Simpson et al99 9/106 8.5 • Arachidonic acid deficiency
Albert et al89 29/289 10.0 • Free oxygen radical excess
12. Chapter 37 Diabetes Mellitus Complicating Pregnancy 987
vascular disease.91 Genetic susceptibility to the terato-
genic influence of diabetes may be a factor. Koppe and
Smoremberg-Schoorl as well as Simpson and colleagues
have suggested that certain maternal HLA types may be
more often associated with anomalies.92,93
Several mechanisms have been proposed by which
the above-mentioned teratogenic factors produce mal-
formations. Freinkel et al.94 suggested that anomalies
might arise from inhibition of glycolysis, the key energy-
producing process during embryogenesis. He found that
D-mannose added to the culture medium of rat embryos
inhibited glycolysis and produced growth restriction and
derangement of neural tube closure.94 Freinkel et al.94
stressed the sensitivity of normal embryogenesis to altera-
tions in these key energy-producing pathways, a process
he labeled “fuel-mediated” teratogenesis. Goldman and
Figure 37-12. Two extremes of growth abnormalities.
Baker95 suggested that the mechanism responsible for the
increased incidence of neural tube defects in embryos
cultured in a hyperglycemic medium may involve a linemia, resulting in excessive fetal growth. Increased
functional deficiency of arachidonic acid, because supple- fetal β-cell mass may be identified as early as the second
mentation with arachidonic acid or myoinositol will trimester.100 Evidence supporting the Pedersen hypothesis
reduce the frequency of neural tube defects in this exper- has come from the studies of amniotic fluid and cord
imental model.95 Pinter and Reece,96 and Pinter et al.97 blood insulin and C-peptide concentrations. Both are
have confirmed these studies and demonstrated that increased in the amniotic fluid of insulin-treated women
hyperglycemia-induced alterations in neural tube closure with diabetes at term101 and correlate with neonatal fat
include disordered cells, decreased mitoses, and changes mass.102 Lipids and amino acids, which are elevated in
indicating premature maturation. These authors have pregnancies complicated by GDM, may also play a role
further demonstrated that hyperglycemia during organ- in excessive fetal growth by stimulating the release of
ogenesis has a primary deleterious effect on yolk sac insulin and other growth factors from the fetal pancreatic
function with resultant embryopathy. β cells and placenta. Infants of mothers with GDM have
Altered oxidative metabolism from maternal diabetes an increase in fat mass compared with fat-free mass.103
may cause increased production of free oxygen radicals Additionally, the growth is disproportionate, with chest/
in the developing embryo, which are likely teratogenic. head and shoulder/head ratios larger than those of infants
Supplementation of oxygen radical–scavenging enzymes, of women with normal glucose tolerance. This factor may
such as superoxide dismutase to the culture medium of contribute to the higher rate of shoulder dystocia and
rat embryos protects against growth delay and excess birth trauma observed in these infants.104
malformations.98 It has been suggested that excess free The results of several clinical series have validated the
oxygen radicals may have a direct effect on embry- Pedersen hypothesis inasmuch as tight maternal glyce-
onic prostaglandin biosynthesis. Free oxygen radical mic control has been associated with a decline in the
excess may enhance lipid peroxidation, and in turn, incidence of macrosomia. In a series of 260 insulin-
generated hydroperoxides might stimulate thrombox- dependent women achieving fasting plasma glucose con-
ane biosynthesis and inhibit prostacyclin production, an centrations between 109 and 140 mg/dl, Gabbe et al.105
imbalance that could have profound effects on embryonic observed 58 (22 percent) macrosomic infants. Kitzmiller
development.90 and Cloherty106 reported that 11 percent of 134 women
achieving fasting glucose concentrations between 105
and 121 mg/dl were delivered of an infant with a birth
Fetal Macrosomia weight in excess of 4,000 g. A more dramatic reduc-
tion in the rate of macrosomia has been reported when
Macrosomia has been variously defined as birth weight more physiologic control has been achieved. Roversi
greater than 4,000 to 4,500 g as well as large for ges- and Gargiulo107 instituted a program of “maximally tol-
tational age, in which birth weight is above the 90th erated” insulin administration and observed macrosomia
percentile for population and sex-specific growth curves. in only 6 percent of cases. Jovanovic and coworkers108
Fetal macrosomia complicates as many as 50 percent eliminated macrosomia in 52 women who achieved mean
of pregnancies in women with GDM and 40 percent of glucose level of 80 to 87 mg/dl throughout gestation.
pregnancies complicated by type 1 and type 2 diabe- Landon and colleagues,109 using daily capillary glucose
tes, including some women treated with intensive glyce- values obtained during the second and third trimester
mic control (Fig. 37-12). Delivery of an infant weighing in women requiring insulin, reported a rate of 9 percent
greater than 4,500 g occurs 10 times more often in women macrosomia when mean values were below 110 mg/dl
with diabetes as compared with a population of women compared with 34 percent when less optimal control was
with normal glucose tolerance.99 achieved. Jovanovic et al.110 have suggested that 1-hour
According to the Pedersen hypothesis, maternal hyper- postprandial glucose measurements correlate best with
glycemia results in fetal hyperglycemia and hyperinsu- the frequency of macrosomia. After controlling for other
13. 988 Section VI Pregnancy and Coexisting Disease
factors, these authors noted that the strongest prediction Table 37-3. Neonatal Body Composition
for birth weight was third-trimester nonfasting glucose
measurements. GDM (n = 195) NGT (n = 220) P value
In a series of metabolic studies, Catalano et al.111 esti- Weight (g) 3,398 ± 550 3,337 ± 549 0.26
mated body composition in 186 neonates using anthro- FFM (g) 2,962 ± 405 2,975 ± 408 .74
pometry. Fat-free mass, which comprised 86 percent of Fat mass (g) 436 ± 206 362 ± 198 .0002
mean birth weight, accounted for 83 percent of the vari- Body fat 12.4 ± 4.6 10.4 ± 4.6 .0001
ance in birth weight, and fat mass, which comprised only FFM, fat-free mass; GDM, gestational diabetes mellitus; NGT,
14 percent of birth weight, accounted for 46 percent of normal glucose tolerance.
the variance in birth weight. There was also significantly
greater fat-free mass in male as compared with female
infants. Using independent variables such as maternal these children at age 1 to 9 years and in adolescents aged
height, pregravid weight, weight gain during pregnancy, 14 to 16 years. Silverman and colleagues115 have reported
parity, paternal height and weight, neonatal sex and ges- that there is a strong correlation between amniotic fluid
tational age, the authors accounted for 29 percent of the insulin levels and increased body mass index (wt/ht2)
variance in birth weight, 30 percent of the variance in in 14- to 17-year-old children, indicating an association
fat-free mass and 17 percent of the variance in fat mass.112 between islet cell activation in utero and development
Including estimates of maternal insulin sensitivity in 16 of childhood obesity. This obesity present in childhood
additional subjects, they were able to explain 48 percent then predisposes to obesity in the adult. Pettitt and col-
of the variance in birth weight, 53 percent in fat-free mass leagues116 have shown that infants born to Pima Indian
and 46 percent in fat mass.113 Studies by Caruso et al.114 women with impaired glucose tolerance were more obese
have corroborated these findings, reporting that women as children than infants of women with normal glucose
with unexplained fetal growth restriction had greater tolerance, even when they developed diabetes later in life.
insulin sensitivity as compared with a control group of These data suggest that there are both in utero maternal
women whose infants were appropriate weight for gesta- metabolic factors as well as genetic factors in the later
tional age. The potential mechanisms for this relate to the development of type 2 diabetes and obesity.
possibility that maternal circulating nutrients for glucose,
free fatty acids, and amino acids available for placental
transport to the fetus are decreased because of the relative Hypoglycemia
increase in maternal insulin sensitivity. A positive cor-
relation between birth weight and weight gain has been Neonatal hypoglycemia, a blood glucose less than 35
observed in women with normal glucose tolerance. The to 40 mg/dl during the first 12 hours of life, results from
correlation was strongest in women who were lean before a rapid drop in plasma glucose concentrations following
conception and became progressively weaker as pregravid clamping of the umbilical cord. Hypoglycemia is par-
weight for height increased.77 In women with GDM, there ticularly common in macrosomic newborns, in which
were no significant correlations between maternal weight rates exceed 50 percent. With near-physiologic control
gain and birth weight, irrespective of pregravid weight for of maternal glucose levels during pregnancy, overall rates
height. These studies emphasize the role of the maternal of 5 to 15 percent have been reported.108,109 The degree of
metabolic environment and fetal growth. hypoglycemia may be influenced by at least two factors:
Normalization of birth weight in infants of women (1) maternal glucose control during the latter half of
with GDM, however, may in itself not achieve optimal pregnancy, and (2) control of maternal glycemia control
growth. In a study of approximately 400 infants of women during labor and delivery.117 Prior poor maternal glucose
with normal glucose tolerance and GDM, Catalano control can result in fetal β-cell hyperplasia, leading to
et al.,79 showed that the infants of women with GDM had exaggerated insulin release following delivery. IDMs
increased fat mass but not lean body mass or weight as exhibiting hypoglycemia have elevated cord C-peptide
compared with a control group even after adjustment for and free insulin levels at birth and an exaggerated pan-
potential confounding variables (Table 37-3). Similarly, creatic response to glucose loading.118
when only infants who were appropriate-for-gestational
age (i.e., between the 10th and 80th percentiles) were
examined, the infants of the women with GDM had sig- Respiratory Distress Syndrome
nificantly greater fat mass and percent body fat but had
less lean mass as compared with the control group but no The precise mechanism by which maternal diabetes
difference in birth weight. Of note, in the infants of the effect pulmonary development remains unknown. Exper-
women with GDM, the strongest correlates with fat mass imental animal studies have focused primarily on the
were fasting glucose and gestational age. This accounted effects of hyperglycemia and hyperinsulinemia on pulmo-
for 17 percent of the variance in infant fat mass. nary surfactant biosynthesis. An extensive review of the
In addition to the perinatal association with fetal mac- literature confirms that both of these factors are involved
rosomia in the infants of women with abnormal glucose in delayed pulmonary maturation in the IDM.119
tolerance, there are significant long-term risks. The In vitro studies have documented that insulin can
increase in birth weight of these infants tends to nor- interfere with substrate availability for surfactant bio-
malize by 1 year of age before increasing again in early synthesis.120,121 Smith121 has postulated that insulin
childhood.115 There is an increase in the risk of obesity in interferes with the normal timing of glucocorticoid-induced
14. Chapter 37 Diabetes Mellitus Complicating Pregnancy 989
pulmonary maturation in the fetus. Cortisol apparently proposed to explain these clinical findings, the pathogen-
acts on pulmonary fibroblasts to induce synthesis of esis of hyperbilirubinemia remains uncertain. In the past,
fibroblast-pneumocyte factor, which then acts on type the jaundice observed in the IDM often was attributed to
II cells to stimulate phospholipid synthesis.122 Carlson prematurity. Studies that have analyzed morbidity care-
and coworkers123 demonstrated that insulin blocks fully, according to gestational age, however, have rejected
cortisol action at the level of the fibroblast by reducing this concept.131
the production of fibroblast-pneumocyte factor. Although severe hyperbilirubinemia may be observed
Clinical studies investigating the effect of maternal dia- independent of polycythemia, a common pathway for
betes on fetal lung maturation have produced conflicting these complications most likely involves increased red
data. The role of amniocentesis in determining fetal lung blood cell production, which is stimulated by increased
maturity is discussed with timing and mode of delivery. erythropoietin in the IDM. Presumably, the major
With the introduction of protocols that have empha- stimulus for red cell production is a state of relative
sized glucose control and antepartum surveillance until hypoxia in utero, as described previously. Although
lung maturity has been established, respiratory distress cord erythropoietin levels generally are normal in IDMs
syndrome (RDS) has become a less common occurrence whose mothers demonstrate good glycemic control
in the IDM. Several studies agree that in well-controlled during gestation, Shannon and colleagues found that
diabetic women delivered at term, the risk of RDS is no hemoglobin A1c (HbA1c) values in late pregnancy were
higher than that observed in the general population.124,125 significantly elevated in mothers of hyperbilirubinemic
Kjos et al.125 studied the outcome of 526 diabetic gesta- infants.130,132
tions delivered within 5 days of amniotic fluid fetal lung
maturation testing and reported HMD in five neonates
(0.95 percent), all of whom were delivered before 34 MATERNAL CLASSIFICATION AND
weeks’ gestation. Mimouni et al.126 compared outcomes RISK ASSESSMENT
of 127 IDMs with matched controls and have concluded
that diabetes in pregnancy as currently managed is not a Priscilla White133 first noted that the patient’s age at
direct risk factor for the development of RDS. Yet, cesar- onset of diabetes, the duration of the disease, and the
ean delivery not preceded by labor and prematurity, both presence of vasculopathy significantly influenced perina-
of which are increased in diabetic pregnancies, clearly tal outcome. Her pioneering work led to a classifica-
increase the likelihood of neonatal respiratory disease. tion system that has been widely applied to pregnant
With cesarean delivery, most of these cases represent women with diabetes.133 A modification of this scheme
retained lung fluid or transient tachypnea of the newborn, is presented in Table 37-1. Counseling a patient and
which usually resolves within the first days of life. formulating a plan of management requires assessment
of both maternal and fetal risk. The White classification
facilitates this evaluation.
Calcium and Magnesium Metabolism Class A1 diabetes mellitus includes those patients who
have demonstrated carbohydrate intolerance during a
Neonatal hypocalcemia, with serum levels below 7 mg 100-g 3-hour oral glucose tolerance test (GTT); however,
per dl, occurs at an increased rate in the IDM when their fasting and 2-hour postprandial glucose levels are
one controls for predisposing factors such as prematu- maintained within physiologic range by dietary regulation
rity and birth asphyxia.127 With modern management, alone. Class A2 includes gestational diabetic women who
the frequency of neonatal hypocalcemia is less than 5 require insulin or oral hypoglycemic therapy in response
percent in the infants of diabetic women.127 Hypocal- to repetitive elevations of fasting or postpartum glucose
cemia in the IDM has been associated with a failure levels following dietary intervention.
to increase parathyroid hormone synthesis following The Second and Third International Workshop Confer-
birth.128 Decreased serum magnesium levels have also ences on Gestational Diabetes sponsored by the American
been documented in pregnant diabetic women as well as Diabetes Association in cooperation with the American
their infants. Mimouni et al.128 described reduced amni- College of Obstetricians and Gynecologists (ACOG)
otic fluid magnesium concentrations in women with type recommended that the term gestational diabetes rather
1 diabetes mellitus. These findings may be explained by a than Class A diabetes be used to describe women with
drop in fetal urinary magnesium excretion, which would carbohydrate intolerance of variable severity with onset
accompany a relative magnesium deficient state. Mag- or recognition during the present pregnancy.134,135 The
nesium deficiency paradoxically then may inhibit fetal definition applies whether insulin or only diet modi-
parathyroid hormone secretion. fication is used for treatment and whether or not the
condition persists after pregnancy. It does not exclude
the possibility that unrecognized glucose intolerance
Hyperbilirubinemia and Polycythemia may have antedates or begun with pregnancy. The term
gestational diabetes fails to specify whether the patient
Hyperbilirubinemia is frequently observed in the IDM. requires dietary adjustment alone or treatment with diet
Neonatal jaundice has been reported in as many as 25 to and insulin. This distinction is important because those
53 percent of pregnancies complicated by pregestational patients who are normoglycemic while fasting appear
diabetes mellitus and 38 percent of pregnancies with to have a significantly lower perinatal mortality rate.136
GDM.127,129,130 Although several mechanisms have been Women with GDM who require insulin are at greater risk