SlideShare a Scribd company logo
1 of 21
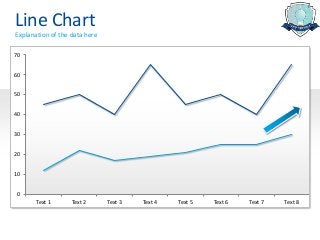
Line Chart
Explanation of the data here

70


60


50


40


30


20


10


 0
       Text 1      Text 2      Text 3   Text 4   Text 5   Text 6   Text 7   Text 8
Column Chart
Explanation of the data here


70

60                                       65                                  65

50
                    50                                     50
40      45                                        45
                                40                                  40
30

20

10

 0
      Text 1       Text 2      Text 3   Text 4   Text 5   Text 6   Text 7   Text 8
3D Column Chart
Explanation of the data here


                               65
      45        50


                          40                       65
                                    45   50
                                              40
Bar Chart
Explanation of the data here


 Description 1                      45

 Description 2                           50

 Description 3                 40

 Description 4                                65

 Description 5                      45

 Description 6                           50

 Description 7                 40

 Description 8                                65

 Description 9                      45

Description 10                           50

Description 11                 40

Description 12                                65
Bubble Chart
Explanation of the data here

                5
                                                   Y-Values
                4


                3


                2


                1


                0
                    0          1   2   3   4   5          6
Star Chart
Explanation of the data here

                6
                                                   Data A
                5                                  Data B

                4

                3

                2

                1

                0
                    0          1   2   3   4   5            6
Histogram
Explanation of the data here


40


                                                    34
30
                                              29          29


20                                      22                      22


                                  14                                  14
10
                            11                                              11
                      8                                                           8

                4                                                                       4
 0         2                                                                                  2
          200   250   300   350   400   450   500   550   600   650   700   750   800   850   900
Conditional Line Charts
     = above target
     = below target

56

54

52

50

48

46

44

42

40
         1      2     3   4   5   6   7   8   9   10   11   12
Pareto Chart
Explanation of the data here


500                                                                100%


400                                                                80%


300                                                                60%


200        220                                                     40%
                               190

100                                                                20%

                                         60
 0
                                                  30       20      0%
          Data 1               Data 2   Data 3   Data 4   Data 5
Multiple Area and Line Charts
Explanation of the data here


 18     Data 1                          Data 2                           Data 3
 16                                                A
 14             A                                                                  A
 12
 10
  8
  6
  4                 B                          B
  2                                                                                 B
  0


                           For example, regardless of the data set, A is always greater than B
Arrow graph
Explanation of the data here

                       1.20
                                         1.00
                       1.00                                0.95

                                                                    0.80
                       0.80
                                                  0.70

                       0.60
                                0.50
                       0.40

                       0.20

                       0.00
                               data 1   data 2   data 3   data 4   data 5
Combination Stacked Bar Chart
Explanation of the data here


 900
                                                       2012 Target
 800         453
                    400                                2012 Hours
 700                                                   2011 Target
 600                                                   2011 Hours
                                           325   300
 500
 400                           252
             402    400                                214
 300                                             325
                                           307
 200                                 125                     150
                               198                     206
 100                                 125                     125
    0
               Data 1           Data 2      Data 3      Data 4
Waterfall graph
Explanation of the data here

  2500


  2000


  1500


  1000


    500

                                                          100
             2000      1500    500   -100   -400   -100         338   338
       0
             Old        A      B      C     D       E     F     G     New
   -500
Broken column
Explanation of the data here

         25                                    Label Name


         20
         10


          0
                   A           B   C   D   E         F
Box Plot / Whisker Plot
Explanation of the data here


80
70
60
50
40
30
20
10
 0
        A         B        C   D   E   F   G   H   I   J
Box Plot / Whisker Plot v2
Explanation of the data here


100
              87                          86                  87
80
                                                     71
60                             64
                                                              58        56
              45
40
                               31.5       33.5       30                 27.5
20
                                                                        12
 0                             -2                    -5
              -15                                             -18
-20

-40                                       -37

-60
         Row 1           Row 2        Row 3      Row 4    Row 5     Row 6
Multiple Bubble Chart
Explanation of the data here
                                                       Data 1    Data 2   Data 3     Data 4      Data 5


    Aug 11 Sep 11 Oct 11 Nov 11 Dec 11 Jan 12 Feb 12 Mar 12 Apr 12 May 12 Jun 12   Jul 12   Aug 12 Sep 12
Thermometer & Gauges
Explanation of the data here

                                           100   100

             80
                                           80    80

                               Target      60    60

                               Last year
                                           40    40
                               Actual
                                           20    20
                                                       Increase
                                            0    0     Mercury
Bullet table
Year to date report


YTD Report
                       Target         Ranges                     Normalised
         YTD    2012   2013     Poor       OK       YTD   2012     Target     Poor   OK   Bullet Graph
Data 1   1100   1000   1200     600        900      18     17       20        10     15   ────────────────┼─
Data 2   2182   711    3200     500        2700     14     4        20         3     17   ───┼──────────
Data 3   172    171     400     250        350       9     9        20        13     18   ────────┼
Data 4    13     59     100      75            90    3     12       20        15     18   ───            │
Data 5   840    309    1800     1200       1500      9     3        20        13     17   ──┼──────
Data 6   2876   1950   10000    4000       6000      6     4        20         8     12   ───┼──
Data 7    8      0      30       20            25    5     0        20        13     17   ─────
Data 8   504    1418   2375     1800       2200      4     12       20        15     19   ────           │
Dot table
How to create a dot table using the REPT function


                                Data       Dot Chart
               Data 1            2           l
               Data 2            4                l
               Data 3            5                      l
               Data 4            2             l
               Data 5            6                          l
               Data 6            12                                             l
               Data 7            11                                         l
               Data 8            4                  l
               Data 9            7                              l
               Data 10           10                                     l
               Data 11           9                                  l
               Data 12           7                              l
Data driven
Graphs & Charts
 Alesandra Blakeston

More Related Content

More from Alesandra Blakeston

More from Alesandra Blakeston (8)

Six thinking hats
Six thinking hatsSix thinking hats
Six thinking hats
 
Lean 6sigma and DMAIC
Lean 6sigma and DMAICLean 6sigma and DMAIC
Lean 6sigma and DMAIC
 
Your Favourite Quotes
Your Favourite QuotesYour Favourite Quotes
Your Favourite Quotes
 
6 steps to effect and embrace change in the workplace
6 steps to effect and embrace change in the workplace6 steps to effect and embrace change in the workplace
6 steps to effect and embrace change in the workplace
 
Training, learning and development quotes
Training, learning and development quotesTraining, learning and development quotes
Training, learning and development quotes
 
How to Make Great PowerPoint Slides
How to Make Great PowerPoint SlidesHow to Make Great PowerPoint Slides
How to Make Great PowerPoint Slides
 
What is 5s
What is 5sWhat is 5s
What is 5s
 
Bubbles
BubblesBubbles
Bubbles
 

Recently uploaded

8447779800, Low rate Call girls in Kotla Mubarakpur Delhi NCR
8447779800, Low rate Call girls in Kotla Mubarakpur Delhi NCR8447779800, Low rate Call girls in Kotla Mubarakpur Delhi NCR
8447779800, Low rate Call girls in Kotla Mubarakpur Delhi NCRashishs7044
 
Global Scenario On Sustainable and Resilient Coconut Industry by Dr. Jelfina...
Global Scenario On Sustainable  and Resilient Coconut Industry by Dr. Jelfina...Global Scenario On Sustainable  and Resilient Coconut Industry by Dr. Jelfina...
Global Scenario On Sustainable and Resilient Coconut Industry by Dr. Jelfina...ictsugar
 
Future Of Sample Report 2024 | Redacted Version
Future Of Sample Report 2024 | Redacted VersionFuture Of Sample Report 2024 | Redacted Version
Future Of Sample Report 2024 | Redacted VersionMintel Group
 
MAHA Global and IPR: Do Actions Speak Louder Than Words?
MAHA Global and IPR: Do Actions Speak Louder Than Words?MAHA Global and IPR: Do Actions Speak Louder Than Words?
MAHA Global and IPR: Do Actions Speak Louder Than Words?Olivia Kresic
 
PSCC - Capability Statement Presentation
PSCC - Capability Statement PresentationPSCC - Capability Statement Presentation
PSCC - Capability Statement PresentationAnamaria Contreras
 
Buy gmail accounts.pdf Buy Old Gmail Accounts
Buy gmail accounts.pdf Buy Old Gmail AccountsBuy gmail accounts.pdf Buy Old Gmail Accounts
Buy gmail accounts.pdf Buy Old Gmail AccountsBuy Verified Accounts
 
Marketplace and Quality Assurance Presentation - Vincent Chirchir
Marketplace and Quality Assurance Presentation - Vincent ChirchirMarketplace and Quality Assurance Presentation - Vincent Chirchir
Marketplace and Quality Assurance Presentation - Vincent Chirchirictsugar
 
Cybersecurity Awareness Training Presentation v2024.03
Cybersecurity Awareness Training Presentation v2024.03Cybersecurity Awareness Training Presentation v2024.03
Cybersecurity Awareness Training Presentation v2024.03DallasHaselhorst
 
8447779800, Low rate Call girls in Tughlakabad Delhi NCR
8447779800, Low rate Call girls in Tughlakabad Delhi NCR8447779800, Low rate Call girls in Tughlakabad Delhi NCR
8447779800, Low rate Call girls in Tughlakabad Delhi NCRashishs7044
 
Call US-88OO1O2216 Call Girls In Mahipalpur Female Escort Service
Call US-88OO1O2216 Call Girls In Mahipalpur Female Escort ServiceCall US-88OO1O2216 Call Girls In Mahipalpur Female Escort Service
Call US-88OO1O2216 Call Girls In Mahipalpur Female Escort Servicecallgirls2057
 
Traction part 2 - EOS Model JAX Bridges.
Traction part 2 - EOS Model JAX Bridges.Traction part 2 - EOS Model JAX Bridges.
Traction part 2 - EOS Model JAX Bridges.Anamaria Contreras
 
Digital Transformation in the PLM domain - distrib.pdf
Digital Transformation in the PLM domain - distrib.pdfDigital Transformation in the PLM domain - distrib.pdf
Digital Transformation in the PLM domain - distrib.pdfJos Voskuil
 
NewBase 19 April 2024 Energy News issue - 1717 by Khaled Al Awadi.pdf
NewBase  19 April  2024  Energy News issue - 1717 by Khaled Al Awadi.pdfNewBase  19 April  2024  Energy News issue - 1717 by Khaled Al Awadi.pdf
NewBase 19 April 2024 Energy News issue - 1717 by Khaled Al Awadi.pdfKhaled Al Awadi
 
Kenya’s Coconut Value Chain by Gatsby Africa
Kenya’s Coconut Value Chain by Gatsby AfricaKenya’s Coconut Value Chain by Gatsby Africa
Kenya’s Coconut Value Chain by Gatsby Africaictsugar
 
India Consumer 2024 Redacted Sample Report
India Consumer 2024 Redacted Sample ReportIndia Consumer 2024 Redacted Sample Report
India Consumer 2024 Redacted Sample ReportMintel Group
 
Pitch Deck Teardown: Geodesic.Life's $500k Pre-seed deck
Pitch Deck Teardown: Geodesic.Life's $500k Pre-seed deckPitch Deck Teardown: Geodesic.Life's $500k Pre-seed deck
Pitch Deck Teardown: Geodesic.Life's $500k Pre-seed deckHajeJanKamps
 
Independent Call Girls Andheri Nightlaila 9967584737
Independent Call Girls Andheri Nightlaila 9967584737Independent Call Girls Andheri Nightlaila 9967584737
Independent Call Girls Andheri Nightlaila 9967584737Riya Pathan
 
2024 Numerator Consumer Study of Cannabis Usage
2024 Numerator Consumer Study of Cannabis Usage2024 Numerator Consumer Study of Cannabis Usage
2024 Numerator Consumer Study of Cannabis UsageNeil Kimberley
 

Recently uploaded (20)

8447779800, Low rate Call girls in Kotla Mubarakpur Delhi NCR
8447779800, Low rate Call girls in Kotla Mubarakpur Delhi NCR8447779800, Low rate Call girls in Kotla Mubarakpur Delhi NCR
8447779800, Low rate Call girls in Kotla Mubarakpur Delhi NCR
 
Global Scenario On Sustainable and Resilient Coconut Industry by Dr. Jelfina...
Global Scenario On Sustainable  and Resilient Coconut Industry by Dr. Jelfina...Global Scenario On Sustainable  and Resilient Coconut Industry by Dr. Jelfina...
Global Scenario On Sustainable and Resilient Coconut Industry by Dr. Jelfina...
 
Japan IT Week 2024 Brochure by 47Billion (English)
Japan IT Week 2024 Brochure by 47Billion (English)Japan IT Week 2024 Brochure by 47Billion (English)
Japan IT Week 2024 Brochure by 47Billion (English)
 
Future Of Sample Report 2024 | Redacted Version
Future Of Sample Report 2024 | Redacted VersionFuture Of Sample Report 2024 | Redacted Version
Future Of Sample Report 2024 | Redacted Version
 
MAHA Global and IPR: Do Actions Speak Louder Than Words?
MAHA Global and IPR: Do Actions Speak Louder Than Words?MAHA Global and IPR: Do Actions Speak Louder Than Words?
MAHA Global and IPR: Do Actions Speak Louder Than Words?
 
PSCC - Capability Statement Presentation
PSCC - Capability Statement PresentationPSCC - Capability Statement Presentation
PSCC - Capability Statement Presentation
 
Buy gmail accounts.pdf Buy Old Gmail Accounts
Buy gmail accounts.pdf Buy Old Gmail AccountsBuy gmail accounts.pdf Buy Old Gmail Accounts
Buy gmail accounts.pdf Buy Old Gmail Accounts
 
Marketplace and Quality Assurance Presentation - Vincent Chirchir
Marketplace and Quality Assurance Presentation - Vincent ChirchirMarketplace and Quality Assurance Presentation - Vincent Chirchir
Marketplace and Quality Assurance Presentation - Vincent Chirchir
 
No-1 Call Girls In Goa 93193 VIP 73153 Escort service In North Goa Panaji, Ca...
No-1 Call Girls In Goa 93193 VIP 73153 Escort service In North Goa Panaji, Ca...No-1 Call Girls In Goa 93193 VIP 73153 Escort service In North Goa Panaji, Ca...
No-1 Call Girls In Goa 93193 VIP 73153 Escort service In North Goa Panaji, Ca...
 
Cybersecurity Awareness Training Presentation v2024.03
Cybersecurity Awareness Training Presentation v2024.03Cybersecurity Awareness Training Presentation v2024.03
Cybersecurity Awareness Training Presentation v2024.03
 
8447779800, Low rate Call girls in Tughlakabad Delhi NCR
8447779800, Low rate Call girls in Tughlakabad Delhi NCR8447779800, Low rate Call girls in Tughlakabad Delhi NCR
8447779800, Low rate Call girls in Tughlakabad Delhi NCR
 
Call US-88OO1O2216 Call Girls In Mahipalpur Female Escort Service
Call US-88OO1O2216 Call Girls In Mahipalpur Female Escort ServiceCall US-88OO1O2216 Call Girls In Mahipalpur Female Escort Service
Call US-88OO1O2216 Call Girls In Mahipalpur Female Escort Service
 
Traction part 2 - EOS Model JAX Bridges.
Traction part 2 - EOS Model JAX Bridges.Traction part 2 - EOS Model JAX Bridges.
Traction part 2 - EOS Model JAX Bridges.
 
Digital Transformation in the PLM domain - distrib.pdf
Digital Transformation in the PLM domain - distrib.pdfDigital Transformation in the PLM domain - distrib.pdf
Digital Transformation in the PLM domain - distrib.pdf
 
NewBase 19 April 2024 Energy News issue - 1717 by Khaled Al Awadi.pdf
NewBase  19 April  2024  Energy News issue - 1717 by Khaled Al Awadi.pdfNewBase  19 April  2024  Energy News issue - 1717 by Khaled Al Awadi.pdf
NewBase 19 April 2024 Energy News issue - 1717 by Khaled Al Awadi.pdf
 
Kenya’s Coconut Value Chain by Gatsby Africa
Kenya’s Coconut Value Chain by Gatsby AfricaKenya’s Coconut Value Chain by Gatsby Africa
Kenya’s Coconut Value Chain by Gatsby Africa
 
India Consumer 2024 Redacted Sample Report
India Consumer 2024 Redacted Sample ReportIndia Consumer 2024 Redacted Sample Report
India Consumer 2024 Redacted Sample Report
 
Pitch Deck Teardown: Geodesic.Life's $500k Pre-seed deck
Pitch Deck Teardown: Geodesic.Life's $500k Pre-seed deckPitch Deck Teardown: Geodesic.Life's $500k Pre-seed deck
Pitch Deck Teardown: Geodesic.Life's $500k Pre-seed deck
 
Independent Call Girls Andheri Nightlaila 9967584737
Independent Call Girls Andheri Nightlaila 9967584737Independent Call Girls Andheri Nightlaila 9967584737
Independent Call Girls Andheri Nightlaila 9967584737
 
2024 Numerator Consumer Study of Cannabis Usage
2024 Numerator Consumer Study of Cannabis Usage2024 Numerator Consumer Study of Cannabis Usage
2024 Numerator Consumer Study of Cannabis Usage
 

Make your charts look amazing

  • 1. Line Chart Explanation of the data here 70 60 50 40 30 20 10 0 Text 1 Text 2 Text 3 Text 4 Text 5 Text 6 Text 7 Text 8
  • 2. Column Chart Explanation of the data here 70 60 65 65 50 50 50 40 45 45 40 40 30 20 10 0 Text 1 Text 2 Text 3 Text 4 Text 5 Text 6 Text 7 Text 8
  • 3. 3D Column Chart Explanation of the data here 65 45 50 40 65 45 50 40
  • 4. Bar Chart Explanation of the data here Description 1 45 Description 2 50 Description 3 40 Description 4 65 Description 5 45 Description 6 50 Description 7 40 Description 8 65 Description 9 45 Description 10 50 Description 11 40 Description 12 65
  • 5. Bubble Chart Explanation of the data here 5 Y-Values 4 3 2 1 0 0 1 2 3 4 5 6
  • 6. Star Chart Explanation of the data here 6 Data A 5 Data B 4 3 2 1 0 0 1 2 3 4 5 6
  • 7. Histogram Explanation of the data here 40 34 30 29 29 20 22 22 14 14 10 11 11 8 8 4 4 0 2 2 200 250 300 350 400 450 500 550 600 650 700 750 800 850 900
  • 8. Conditional Line Charts = above target = below target 56 54 52 50 48 46 44 42 40 1 2 3 4 5 6 7 8 9 10 11 12
  • 9. Pareto Chart Explanation of the data here 500 100% 400 80% 300 60% 200 220 40% 190 100 20% 60 0 30 20 0% Data 1 Data 2 Data 3 Data 4 Data 5
  • 10. Multiple Area and Line Charts Explanation of the data here 18 Data 1 Data 2 Data 3 16 A 14 A A 12 10 8 6 4 B B 2 B 0 For example, regardless of the data set, A is always greater than B
  • 11. Arrow graph Explanation of the data here 1.20 1.00 1.00 0.95 0.80 0.80 0.70 0.60 0.50 0.40 0.20 0.00 data 1 data 2 data 3 data 4 data 5
  • 12. Combination Stacked Bar Chart Explanation of the data here 900 2012 Target 800 453 400 2012 Hours 700 2011 Target 600 2011 Hours 325 300 500 400 252 402 400 214 300 325 307 200 125 150 198 206 100 125 125 0 Data 1 Data 2 Data 3 Data 4
  • 13. Waterfall graph Explanation of the data here 2500 2000 1500 1000 500 100 2000 1500 500 -100 -400 -100 338 338 0 Old A B C D E F G New -500
  • 14. Broken column Explanation of the data here 25 Label Name 20 10 0 A B C D E F
  • 15. Box Plot / Whisker Plot Explanation of the data here 80 70 60 50 40 30 20 10 0 A B C D E F G H I J
  • 16. Box Plot / Whisker Plot v2 Explanation of the data here 100 87 86 87 80 71 60 64 58 56 45 40 31.5 33.5 30 27.5 20 12 0 -2 -5 -15 -18 -20 -40 -37 -60 Row 1 Row 2 Row 3 Row 4 Row 5 Row 6
  • 17. Multiple Bubble Chart Explanation of the data here Data 1 Data 2 Data 3 Data 4 Data 5 Aug 11 Sep 11 Oct 11 Nov 11 Dec 11 Jan 12 Feb 12 Mar 12 Apr 12 May 12 Jun 12 Jul 12 Aug 12 Sep 12
  • 18. Thermometer & Gauges Explanation of the data here 100 100 80 80 80 Target 60 60 Last year 40 40 Actual 20 20 Increase 0 0 Mercury
  • 19. Bullet table Year to date report YTD Report Target Ranges Normalised YTD 2012 2013 Poor OK YTD 2012 Target Poor OK Bullet Graph Data 1 1100 1000 1200 600 900 18 17 20 10 15 ────────────────┼─ Data 2 2182 711 3200 500 2700 14 4 20 3 17 ───┼────────── Data 3 172 171 400 250 350 9 9 20 13 18 ────────┼ Data 4 13 59 100 75 90 3 12 20 15 18 ─── │ Data 5 840 309 1800 1200 1500 9 3 20 13 17 ──┼────── Data 6 2876 1950 10000 4000 6000 6 4 20 8 12 ───┼── Data 7 8 0 30 20 25 5 0 20 13 17 ───── Data 8 504 1418 2375 1800 2200 4 12 20 15 19 ──── │
  • 20. Dot table How to create a dot table using the REPT function Data Dot Chart Data 1 2 l Data 2 4 l Data 3 5 l Data 4 2 l Data 5 6 l Data 6 12 l Data 7 11 l Data 8 4 l Data 9 7 l Data 10 10 l Data 11 9 l Data 12 7 l
  • 21. Data driven Graphs & Charts Alesandra Blakeston