11.[40 49]an application of multivariate techniques in plankton study of a freshwater body in the niger delta
•
1 j'aime•526 vues

IISTE-call for paper www.iiste.org/Journals

Recommandé
Recommandé
Contenu connexe
Tendances
Tendances (20)
Similaire à 11.[40 49]an application of multivariate techniques in plankton study of a freshwater body in the niger delta
Similaire à 11.[40 49]an application of multivariate techniques in plankton study of a freshwater body in the niger delta (20)
Plus de Alexander Decker
Plus de Alexander Decker (20)
Dernier
Dernier (20)
11.[40 49]an application of multivariate techniques in plankton study of a freshwater body in the niger delta
- 1. Journal of Natural Sciences Research www.iiste.org ISSN 2224-3186 (Paper) ISSN 2225-0921 (Online) Vol.2, No.2, 2012 An Application of Multivariate Techniques in Plankton Study of a Freshwater Body in the Niger Delta Dike Henry Ogbuagu1* Adedolapo Abeke Ayoade2 1. Department of Environmental Technology, Federal University of Technology, PMB 1526, Owerri, Nigeria 2. Hydrobiology & Fisheries Unit, Department of Zoology, University of Ibadan, Ibadan, Nigeria * E-mail of the corresponding author: henrydike2002@yahoo.com Abstract We utilized the principal components analysis (PCA) and hierarchical cluster analysis (HCA) to organize and interpret numerical abundances of phyto- and zoo-plankton biotypes of the middle course of the Imo River in a southeastern locality in Nigeria. PCA was used for data reduction while HCA was used to reveal natural groupings within data set of numerical abundances. Phytoplankton taxa abundance was dominated by bacillariophyceae (diatoms) (53.25%), while zooplankton was dominated by Cladocera (25.87%). Two plankton taxa PCs which accounted for about 76.30% variability in original 14 variables correlated most with Rotifera and fish eggs and larvae. HCA revealed chrysophyceans, euglenophyceans, cyanophyceans and chlorophyceans, as well as Crab larvae, fish eggs and larvae, beetle larvae and Copepoda forming the first and richest phytoplankton and zooplankton clusters, respectively. Results reveal that both extraction and clustering outputs utilized underlying criteria (such as seasonality and climatic variability) rather than numerical abundances in their classifications. Keywords: Plankton taxa, PCA, HCA, multivariate analysis, numerical abundance 1. Introduction Several plankton population studies have utilized endogenous, non-linear density-dependent factors to draw conclusions, even as few others have emphasized the utilization of exogenous forces in linearity studies (Belgrano et al., 2004). The application of multivariate techniques in a variety of disciplines, ranging from the Arts, through the Humanities to the Sciences has also made them suitable for capturing observed population oscillations in the ecosystems better, depending on the objective of the study in question. According to Khattree and Naik (1999), the subject of multivariate analysis deals with the statistical analysis of data collected on more than one variable, which may be correlated with each other, and their statistical dependence is often taken into account when analyzing such data. Plankton studies therefore could utilize multivariate techniques in the organization and interpretation of ensuing data, given the fact that different taxa could be taken to represent composite multivariables needed to prompt analyses runs. Of these techniques, the current study utilized the principal components analysis (PCA) extraction method of factor analysis and the hierarchical cluster analysis (HCA) for data reduction and revelation of natural groupings within a data set of numerical abundance of plankton, respectively. According to the PEC (2008), the purpose of data reduction is to remove redundant (highly correlated) variables from the data file, 40
- 2. Journal of Natural Sciences Research www.iiste.org ISSN 2224-3186 (Paper) ISSN 2225-0921 (Online) Vol.2, No.2, 2012 perhaps replacing the entire data file with a smaller number of uncorrelated variables. On the other hand, HCA is an exploratory tool designed to reveal natural groupings (clusters) within a data set that would otherwise not be apparent. Through these techniques, one can make certain conclusions necessary for understanding less explored relationships existing in the ecosystems of bioindicators. 2. Materials and Methods 2.1 Study Area Plankton sampling was conducted within the middle reaches of the Imo River in Etche Local Government Area (LGA) of Rivers State, Nigeria, between longitude 06˚ 05' and 07˚ 14'E and latitude 05˚ 08' and 04˚ 45' N (Figure 1). The climate of the area is typical of the tropical rainforest zone, annual rainfall is between 160-236cm in about 300 rain days especially during March-November, temperature ranges are between 24 and 38 ºC, and humidities of up to 90% are usually recorded during the wet season (SPDC, 1998). Sampling was done once monthly for 24 months (March 2007-February 2009) at 7 sampling locations along the course of the river. In-stream sand mining was ongoing at all the sampling locations during the study period. 2.2 Field Sampling Plankton samples were collected with plankton net of mesh size 55µm which was hauled horizontally along the river course for 5 minutes at each sampling location according to the methods of Grant (2002) and Anene (2003). Collected samples were later fixed in 4 % formalin solution in labeled plastic containers according to the method of Boney (1983) and Anene (2003) and taken to the laboratory. 2.3. Laboratory Analysis Samples were homogenized by inverting the containers a few times. With a wide-mouthed pipette, 1ml of the plankton subsample was withdrawn from the field samples, placed on a Sedge-wick rafter-counting chamber and observed by direct microscopy. Keys provided by Whitford and Schumacher (1973), Needham and Needham (1974), Cole (1978), Maosen (1978), Jeje and Fernando (1986; 1991), Egborge (1994), and APHA (1998) were used for species identifications. Counts were made in triplicates and their averages taken and expressed as either cells/ml for the phytoplankton or organisms/ml for the zooplankton biotypes. 2.4. Statistical analysis Multivariate statistics as provided by the SPSS Version 17.0 (PEC, 2008) was used. The factor analysis procedure, using principal components analysis (PCA) extraction method for data reduction was used to remove redundant (highly correlated) plankton taxa (variables) from the data file and replacing the entire data file with a smaller number of uncorrelated variables (factor). Factor rotation for the transformation of extracted components to a new position for interpretation was achieved with the Varimax method. The magnitudes of the eigenvalues and 75% (0.75) rule for variance contribution were used for factor selection (Manly, 1986). The hierarchical cluster analysis (HCA) was used to explore and reveal natural groupings (or clusters) within the plankton assemblages that would otherwise not be apparent. 41
- 3. Journal of Natural Sciences Research www.iiste.org ISSN 2224-3186 (Paper) ISSN 2225-0921 (Online) Vol.2, No.2, 2012 3. Results 3.1 Plankton composition and abundance A total of 2292 plankton cells and organisms/ml of water were counted in the river during the study period. Out of this, 1859 cells/ml were phytoplankton while 433 organisms/ml were zooplankton species. Seven taxa each were recorded for the phytoplankton and zooplankton biotypes. 3.2. Principal components analysis (PCA) The extracted components represent the plankton taxa well as the communalities were all high. The initial eigenvalue reveals that the first two PCs formed the extraction solution with eigenvalues greater than 1. The extracted components explain about 76% of the variability in the original 14 taxa, with only about 24% loss of information (Table 1). The first component alone explained about 60.31% and the second 15.99% of the variability. The rotation also maintains the cumulative percentage of variation explained by the extracted components, with that variation spread more evenly over the components (Table 2). This is an indication that the rotated component matrix will be easier to interpret than the unrotated one. The scree plot shows that the extracted components which contributed about 76.30% are on the steep slope, while the components on the shallow slope contributed little to the solution. The last big drop occurred between the second and third components (Figure 2). The rotated component matrix reveals that the first component is most highly correlated with the rotifers (0.933) and the second with fish eggs and larvae (0.914) (Table 3). The scatterplot matrix of the component scores revealed a slightly skewed distribution in the two extracted components (Figure 3). 3.3. Hierarchical cluster analysis (HCA) The hierarchical cluster analysis, using the complete linkage classification produced the coefficient column that reveals three major clusters occurring between stages 18 and 19, 20 and 21, and 22 and 23. The dendrogram (Figure 4) confirms the three main clusters, with Chrysophyceae, Euglenophyceae, Cyanophyceae and Chlorophyceae belonging to the first cluster, Pyrrophyceae and Xanthophyceae belonging to the second, and Bacillariophyceae belonging to the third cluster. This indicates a richer species abundance and diversity in the first cluster and single diversity in the third cluster. For the zooplankton assemblage, the coefficient column reveals classification into four major clusters, as confirmed by the dendrogram (Figure 5). The clusters occurred in stages 19 and 20, 20 and 21, 21 and 22, and 22 and 23. The first cluster, with richer plankton abundance and diversity contained crab larvae, fish eggs and larvae, beetle larvae, and Copepoda. The second and third clusters contained the lone rotifers and cladocerans each, while the last cluster contained the lone protozoans. 4. Discussion 4.1 Principal components analysis (PCA) The two zooplankton taxa PCs that were extracted (rotifer and fish eggs and larvae) accounted for high variability of 76.30% in the original 14 variables (plankton taxa). The exclusion of phytoplankton representative in the PCs indicates absence of the common ecological trophic relationships that exists 42
- 4. Journal of Natural Sciences Research www.iiste.org ISSN 2224-3186 (Paper) ISSN 2225-0921 (Online) Vol.2, No.2, 2012 between the plant and animal plankton in the extraction criteria utilized. The PC taxa were composed of moderately abundant (rotifers) to sparsely abundant and low diverse plankton biotypes (fish eggs and larvae); with the latter taxa (which though contributed much lesser variability) showing significant seasonal variability. This implicates seasonality as an exogenous determinant force in the population dynamics of this study. 4.2. Hierarchical cluster analysis (HCA) Three major assemblages were observed. They were: • A blend of both highly diverse and high densities blue-green and green algae (phytoplankton) and the crustacean Copepoda (zooplankton), and sparsely diverse and low densities Euglenophyceae (phytoplankton) and crab larvae, fish eggs and larvae, and beetle larvae (zooplankton) taxa. • A cluster of low densities and sparsely diverse Pyrrophyceae and Xanthophyceae (phytoplankton) taxa with comparatively low spatio-temporal distributions, and • Lone clusters of very high densities and most diverse diatoms (phytoplankton) and Cladocera, Rotifera and Protozoa (zooplankton) taxa, with high seasonal and high spatio-temporal distributions. These clustering patterns make it expedient to agree with the suggestion of Belgrano et al. (2004) that exogenous forces exert significant influences on observed non-linearity outcomes in (marine) plankton population systems dynamics. They explained that both non-linear endogenous (i.e. feedback structures) and exogenous (e.g. climatic factors) responses are relevant for understanding how climate variability could affect natural systems in the environment. 5. Conclusion Forty three (43) genera of phytoplankton, with a mean density of 1859 cells/ml were identified. The numerical order of dominance of the taxa was Bacillariophyceae> Cyanophyceae> Chlorophyceae> Chrysophyceae> Pyrrophyceae> Xanthophyceae> Euglenophyceae. Zooplankton was made up of 7 taxa and a mean density of 433 organisms/ml, with order of dominance as Cladocera> Copepoda> Protozoans> Rotifera> fish eggs and larvae> Crab larvae> Beetle larvae. Two plankton taxa PCs which accounted for high variability (76.30%) correlated most with the rotifers and fish eggs and larvae, with slightly skewed distribution patterns. The HCA revealed that the chrysophyceans, euglenophyceans, cyanophyceans and chlorophyceans (phytoplankton), as well as Crab larvae, fish eggs and larvae, beetle larvae, and Copepoda (zooplankton) formed the first and richest clusters, while the Bacillariophyceae, Rotifera and Cladocera each formed lone clusters. Results of both PCA and HCA indicate that outputs must have utilized other underlying criteria (such as seasonality and climatic variability) than numerical abundances in their classifications. References American Public Health Association (APHA) (1998), Standard Methods for the Examination of Water and Wastewater. 20th ed. APHA/AWWA/WEF: Washington DC. Anene, A. (2003), Techniques in Hydrobiology. In: Research Techniques in Biological and Chemical 43
- 5. Journal of Natural Sciences Research www.iiste.org ISSN 2224-3186 (Paper) ISSN 2225-0921 (Online) Vol.2, No.2, 2012 Sciences. E.N. Onyeike & J.O. Osuji (eds.), Owerri: Springfield Publishers Ltd., 174-189. Belgrano, A., Lima, M. & Stensseth, N.C. (2004), Non-linear dynamics in marine phytoplankton population systems. Marine Ecology Progress Series MEPS 273, 281-289. Boney, A.D. (1983), Phytoplankton Publication. Photo Books (Bristol) Ltd., 1-82. Cole, A. (1978), A Text Book of Limnology. London: Longman. 426pp. Egborge, A.B.M. (1994), Water Pollution in Nigeria Vol. 1: Biodiversity and Chemistry of Warri River. Ben Miller Books Nig. Ltd., pp. 313. Grant, I.F. (2002), Aquatic invertebrates. In: Ecological Monitoring Methods for the Assessments of Pesticide impact in the Tropics. I.F. Grant & C.C.D. Tingle, (eds.), London: The University of Greenwich, p.183-193. Jeje, C.Y. & Fernando, C.H. (1986), A practical guide to the identification of Nigerian zooplankton (Cladocera, copepoda and rotifera). Kainji Lake Research Institute. Jeje, C.Y. & Fernando, C.H. (1991), An illustrated guide to identification of Nigerian freshwater rotifers. Nigerian Journal of Science, 25, 77-95. Khattree, R. & Naik, D.N. (1999). Applied Multivariate Statistics with SAS® Software. 2nd Ed., SAS Institute Inc. and John Wiley & Sons, Inc., 363pp. Manly, F.J. (1986), Multivariate statistical methods: A primer. Chapman and Hall, London, p. 42-125. Maosen, H. (1978), Illustration of Freshwater Plankton. Agricultural Press, 171pp. Needham, J.G. & Needham, P.R. (1974), A Guide to the study of freshwater Biology. Holde-Day Publishers, San Francisco. Polar Engineering and Consulting (PEC) (2008), SPSS Statistics 17.0 Release 17.0.0. Retrieved from http://www.spss.com/sm/spssserver (August 15, 2011). Shell Petroleum Development Company of Nigeria Limited (SPDC) (1998), Environmental Impact Assessment of Obigbo Node Associated Gas Gathering Project: Final Report by Tial Trade Limited. Whitford, L.A. & Schumacher, G.J. (1973), A Manual of fresh-water algae. Sparks Press, Raleigh. 324pp. Dike Henry Ogbuagu is a doctorate degree student with the Hydrobiology and Fisheries Unit of the Department of Zoology, University of Ibadan, Ibadan, Nigeria. He is also a lecturer with the Department of Environmental Technology, Federal University of Technology, Owerri, Nigeria. Article is part of his PhD research work. Adedolapo Abeke Ayoade is a doctorate degree holder and supervisor to the corresponding author. She is a senior lecturer in the Hydrobiology and Fisheries Unit, Department of Zoology, University of Ibadan, Ibadan, Nigeria. 44
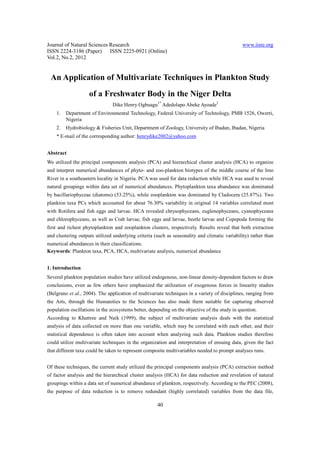
- 6. Journal of Natural Sciences Research www.iiste.org ISSN 2224-3186 (Paper) ISSN 2225-0921 (Online) Vol.2, No.2, 2012 Figure 1. Location map showing the sampling locations on Imo River in Etche LGA Figure 2. Scree plot of eigenvalues of initial component 45
- 7. Journal of Natural Sciences Research www.iiste.org ISSN 2224-3186 (Paper) ISSN 2225-0921 (Online) Vol.2, No.2, 2012 Fig. 3. Scatterplot matrix of component scores of the plankton taxa 46
- 8. Journal of Natural Sciences Research www.iiste.org ISSN 2224-3186 (Paper) ISSN 2225-0921 (Online) Vol.2, No.2, 2012 Dendrogram using Complete Linkage Rescaled Distance Cluster Combine C A S E 0 5 10 15 20 25 Label Num +---------+---------+---------+---------+---------+ Chrysophyceae 4 -+ Euglenophyceae 5 -+ Cyanophyceae 2 -+ Chlorophyceae 3 -+ 10 -+-+ 11 -+ | Pyrrophyceae 6 -+ | 19 -+ +---------+ 22 -+ | | Xanthophyceae 7 -+ | | 20 -+-+ | 8 -+ | 9 -+ +-----------------------------------+ 17 -+---+ | | 21 -+ +-+ | | Bacillariophyceae 1 -+-+ | | | | 23 -+ +-+ | | | 14 -+ | +-----+ | 18 -+-+ | | 16 -+ | | 15 -------+ | 12 -+-----------+ | 13 -+ +-----------------------------------+ 24 -------------+ Figure 4. Dendrogram showing hierarchical clustering of phytoplankton of Imo River in Etche LGA 47
- 9. Journal of Natural Sciences Research www.iiste.org ISSN 2224-3186 (Paper) ISSN 2225-0921 (Online) Vol.2, No.2, 2012 Dendrogram using Complete Linkage Rescaled Distance Cluster Combine C A S E 0 5 10 15 20 25 Label Num +---------+---------+---------+---------+---------+ Other Crustaceans 3 -+ Fish eggs/larvae 4 -+ Beetle larvae 5 -+ Copepoda 2 -+-+ 15 -+ | 16 -+ +-+ 10 ---+ +---+ 14 ---+ | | Rotifera 6 -+---+ | 18 -+ +---+ 11 -+ | | 22 -+ | | 17 -+---+ | | Cladocera 1 -+ +---+ | 8 -+-+ | +-----------+ 9 -+ +-+ | | 20 -+-+ | | 21 -+ | +-----------------------+ 13 -+-----+ | | | 23 -+ +-----+ | | 12 -------+ | | Protozoans 7 -------+-----------------+ | 19 -------+ | 24 -------------------------------------------------+ Figure 5. Dendrogram showing hierarchical clustering of zooplankton of Imo River in Etche LGA Table 1. Total variance explained in extracted component of the plankton taxa of Imo River in Etche LGA Components Extraction sums of squared loadings Total % of variance Cumulative % 1 8.444 60.311 60.311 2 2.238 15.987 76.299 48
- 10. Journal of Natural Sciences Research www.iiste.org ISSN 2224-3186 (Paper) ISSN 2225-0921 (Online) Vol.2, No.2, 2012 Table 2. Rotated total variance explained of the plankton taxa of Imo River in Etche LGA Components Rotation sums of squared loadings Total % of variance Cumulative % 1 8.191 58.510 58.510 2 2.490 17.789 76.299 Table 3. Rotated component matrix of the plankton taxa of Imo River in Etche LGA Parameters Components 1 2 Rotifers 0.933 Fish eggs and larvae 0.914 49
- 11. International Journals Call for Paper The IISTE, a U.S. publisher, is currently hosting the academic journals listed below. The peer review process of the following journals usually takes LESS THAN 14 business days and IISTE usually publishes a qualified article within 30 days. Authors should send their full paper to the following email address. More information can be found in the IISTE website : www.iiste.org Business, Economics, Finance and Management PAPER SUBMISSION EMAIL European Journal of Business and Management EJBM@iiste.org Research Journal of Finance and Accounting RJFA@iiste.org Journal of Economics and Sustainable Development JESD@iiste.org Information and Knowledge Management IKM@iiste.org Developing Country Studies DCS@iiste.org Industrial Engineering Letters IEL@iiste.org Physical Sciences, Mathematics and Chemistry PAPER SUBMISSION EMAIL Journal of Natural Sciences Research JNSR@iiste.org Chemistry and Materials Research CMR@iiste.org Mathematical Theory and Modeling MTM@iiste.org Advances in Physics Theories and Applications APTA@iiste.org Chemical and Process Engineering Research CPER@iiste.org Engineering, Technology and Systems PAPER SUBMISSION EMAIL Computer Engineering and Intelligent Systems CEIS@iiste.org Innovative Systems Design and Engineering ISDE@iiste.org Journal of Energy Technologies and Policy JETP@iiste.org Information and Knowledge Management IKM@iiste.org Control Theory and Informatics CTI@iiste.org Journal of Information Engineering and Applications JIEA@iiste.org Industrial Engineering Letters IEL@iiste.org Network and Complex Systems NCS@iiste.org Environment, Civil, Materials Sciences PAPER SUBMISSION EMAIL Journal of Environment and Earth Science JEES@iiste.org Civil and Environmental Research CER@iiste.org Journal of Natural Sciences Research JNSR@iiste.org Civil and Environmental Research CER@iiste.org Life Science, Food and Medical Sciences PAPER SUBMISSION EMAIL Journal of Natural Sciences Research JNSR@iiste.org Journal of Biology, Agriculture and Healthcare JBAH@iiste.org Food Science and Quality Management FSQM@iiste.org Chemistry and Materials Research CMR@iiste.org Education, and other Social Sciences PAPER SUBMISSION EMAIL Journal of Education and Practice JEP@iiste.org Journal of Law, Policy and Globalization JLPG@iiste.org Global knowledge sharing: New Media and Mass Communication NMMC@iiste.org EBSCO, Index Copernicus, Ulrich's Journal of Energy Technologies and Policy JETP@iiste.org Periodicals Directory, JournalTOCS, PKP Historical Research Letter HRL@iiste.org Open Archives Harvester, Bielefeld Academic Search Engine, Elektronische Public Policy and Administration Research PPAR@iiste.org Zeitschriftenbibliothek EZB, Open J-Gate, International Affairs and Global Strategy IAGS@iiste.org OCLC WorldCat, Universe Digtial Library , Research on Humanities and Social Sciences RHSS@iiste.org NewJour, Google Scholar. Developing Country Studies DCS@iiste.org IISTE is member of CrossRef. All journals Arts and Design Studies ADS@iiste.org have high IC Impact Factor Values (ICV).