11.mahoney.et al 0104www.iiste.org call for_paper-130
1. Issues in Social and Environmental Accounting
Vol. 2, No. 1 June 2008
Pp. 104-130
Corporate Social Performance, Financial
Performance for Firms that Restate
Earnings
Lois Mahoney
College of Business
Eastern Michigan University, USA
William LaGore
College of Business
Eastern Michigan University, USA
Joseph A. Scazzero
College of Business
Eastern Michigan University, USA
Abstract
This study examines corporate social performance (CSP) in firms that restate their financial
statements and, using a match pair design, compares their performance to firms that do not
restate their financial statements. Utilizing a randomized block design (two years prior to the
restatement and two years after the restatement) for a sample of 44 U.S. firms, we found that
CSP Strengths, CSP Weaknesses, CSP People Strengths, and CSP People Weaknesses all in-
creased after restatement though weaknesses increased at a greater rate than strengths. Addi-
tionally, using panel data and a match pair design we found, we found that restating firms had
a greater increase in CSP Strengths, CSP Weaknesses, CSP Product Strengths, CSP People
Strengths and a greater decrease in Total CSP People than non-restating firms after the restate-
ment period. When comparing the relationships between CSP and financial performance (FP),
we found that the positive relationship between ROA and CSP Strengths is greater for restate-
ment firms than non-restating firms. In particular, we find that this positive relationship is a
result of the People dimension of CSP, in particular CSP People Strengths.
Key Words: financial restatements, corporate social performance, financial performance,
Lois Mahoney is Associate Professor of Accounting in the Department of Accounting and Finance College of Busi-
ness Eastern Michigan University, USA, email: lois.mahoney@emich.edu. William LaGore is assistant professor,
accounting and finance in the Department of Accounting and Finance College of Business Eastern Michigan Univer-
sity, USA, email: william.lagore@emich.edu. Joseph A. Scazzeroa Professor of Decision Sciences in the Department
of Accounting and Finance at Eastern Michigan University College of Business, USA, email: jscazzero@emich.edu
2. L. Mahoney, W. LaGore, J. A. Scazzaro / Issues in Social and Environmental Accounting 1 (2008) 104-130 105
CORPORATE SOCIAL PERFORM-
ANCE AND THE ISSUE OF FINAN-
CIAL RESTATEMENTS
The quality of financial reporting has
come under increased scrutiny in recent
years because of high-profile financial
reporting failures, such as Enron and
WorldCom, and the significant increase
in the number of financial restatements.
An October 2002 General Accounting
Office (GAO) report documents that the
number of financial restatements has
increased 145 percent from 1997 to 2001
and that publicly traded companies lost
billions in market capitalization in the
days and months following a restatement
announcement. The GAO report further
concludes that the increase in restate-
ments has negatively impacted investor
confidence. For example, the GAO’s
October 4, 2002 letter to Senator Paul
Sarbanes states the following:
“The growing number of restate-
ments and mounting questions
about certain corporate account-
ing practices appear to have
shaken investors’ confidence in
our financial reporting system...
empirical research studies and
academic experts generally sug-
gest accounting issues have nega-
tively affected overall investor
confidence and raised questions
about the integrity of U.S. mar-
kets.”
Lawsuits against firms resulted in nearly
a 1% loss in market value (Bhagat et al.,
1998), in which an estimated one-third
of this loss is attributed to harmed firm
reputation (Karpoff and Lott, 1993).
The problem does not end with the pas-
sage of Sarbanes-Oxley Act (SOX) but
its continuation has implication for lack
of stakeholder confidence in financial
markets (Donoher et al., 2007) as well as
a firm’s corporate social performance
(CSP). According to Carroll (1979),
CSP considers a variety of factors, in-
cluding discretionary responsibility to
the community, economic responsibility
to investors and consumers, ethical re-
sponsibilities to society and legal re-
sponsibility to the government or the
law. In this turbulent environment, these
firms need to devise strategies that will
enable them to survive and prosper in
this environment in which stakeholders
demand both financial performance (FP)
and effective stakeholder responsiveness
(Johnson and Greening, 1999). These
firms may need to keep in mind CSP as
they pursue superior performance
through being responsive to the environ-
ment, maintaining product quality and
being responsive to the communities in
which it operates and the people it em-
ploys (Turban and Greening, 1997).
Though research concerning the nature
of the relationship between CSP and FP
continues to be mixed (See Griffin and
Mahon, 1997; Roman et al., 1999), a
number of findings indicate a positive
association (Worrell et al., 1991; Preston
and O’Bannon, 1997; Frooman, 1997;
Roman et al., 1999; Orlitzky and Benja-
min, 2001; Murphy, 2002; Simpson and
Kohers, 2002). Furthermore, most of
these findings are derived from compa-
nies that are not experiencing financial
reporting failures. The objectives of this
paper are twofold: First, we address the
question of whether firms that restate
financial statements have different levels
of CSP than non-restating firms. Sec-
ond, we address the questions on
whether the relationship between CSP
and FP is different between restating
firms and non-restating firms. This re-
3. 106 L. Mahoney, W. LaGore, J. A. Scazzaro / Issues in Social and Environmental Accounting 1 (2008) 104-130
search study will contribute to the ac-
counting research stream investigating
financial restatements, as well as the
ethics research of CSP, and extends the
debate on the link between CSP and FP.
The remainder of the paper is organized
as follows. First, we examine the back-
ground, theory and hypotheses. Second,
we explain our research methods and
third, we present the results. The final
section includes our summary, discus-
sion and conclusions.
BACKGROUND, THEORY AND
HYPOTHESES
Financial Reporting Failures
Financial reporting failures include both
frauds and restatements. During the pe-
riod of 1987-1996, the SEC found that a
majority of frauds involved financial
statement fraud (Beasley et al., 1999).
These frauds included sham sales, re-
cording conditional sales as finalized
and recording revenues early. Thus, for
the purpose of this study, we examine
only accounting restatements. Restate-
ments are an admission that previously
issued financial statements were not in
accordance with GAAP (Palmrose and
Scholz, 2004). Early research focused
on characteristics of restating firms. For
example, Kinney and McDaniel (1989)
find restatement firms are smaller, less
profitable, have higher debt, and are
slower growing. DeFond and Jiambalvo
(1991) find earnings overstatements are
more likely for firms with diffuse own-
ership and lower growth in earnings, and
less likely for firms with audit commit-
tees.
Recent studies document significant
negative economic consequences related
to financial reporting failures. Palmrose
et al. (2004) find a mean abnormal re-
turn of -9.2% in the two-day window
(day 0, 1) around a restatement an-
nouncement, with more negative returns
for restatements involving fraud (-20%).
Palmrose and Scholz (2004) find the
negative market reaction is greater for
restatements of core earnings (i.e. pre-
tax earnings from primary operations)
than for non-core earnings (i.e. all other
earnings). Anderson and Yohn (2002)
document the long-term economic con-
sequences of restatements by finding
average cumulative abnormal returns of
-7.97% for the period from three days
before the restatement announcement
through three days after the restatement
filing with the SEC.
There are also legal consequences to a
financial reporting failure. In the Palm-
rose and Scholz (2004) study, 38 percent
of the companies in their restatement
sample subsequently faced civil litiga-
tion. They found that companies with
restatements of core earnings (primarily
revenue restatements) and pervasive re-
statements (i.e. more than one account-
ing item restated) are more likely to be
subject to litigation.
A financial reporting failure also dam-
ages the reputation of the firm, auditors,
management, and the board of directors.
For example, Srinivasan (2005) found
that outside board members experience
significant reputational costs following
accounting restatements. Srinivasan
finds significant turnover of board mem-
bers in the three years following the re-
statement, including director turnover
for 48 percent of firms that restate earn-
ings downward. The likelihood of direc-
tor turnover increases if the board mem-
ber is also on the audit committee. The
4. L. Mahoney, W. LaGore, J. A. Scazzaro / Issues in Social and Environmental Accounting 1 (2008) 104-130 107
study also finds outside directors lose
positions on other boards following a
restatement.
Another study, Desai et al. (2006), ex-
amined the reputational penalties to
managers of restating firms and found
that 60% of restating firms experience
management turnover in the two years
following a restatement as compared
with 35 percent for a control sample.
An audit firm’s reputation can be dam-
aged by a financial reporting failure, as
evidenced by the demise of Arthur An-
dersen. Barton (2005) examines the de-
mand for auditor reputation by examin-
ing the client defections from Arthur
Andersen. Barton (2005) finds firms
that are more visible in the capital mar-
kets switched sooner to another Big 5
auditor, as they were concerned about
their auditor’s reputation and the credi-
bility of their financial reporting.
Accounting numbers used in contracts
(e.g. compensation and debt contracts)
must be verifiable for the contract to be
enforceable in court (Watts, 2003).
Based on prior literature, it is reasonable
to assume that a financial reporting fail-
ure leads to greater uncertainty about the
reliability and verifiability of the ac-
counting numbers used in contracts. As
a restatement casts doubt on the quality
of the financial reports and increases the
risk to the contracting parties, sharehold-
ers and lenders will demand an increased
risk premium following a reporting fail-
ure. For example, empirical studies find
that frauds and accounting restatements
lead to an increased cost of capital (e.g.,
Dechow et al., 1996; Hribar and Jenkins,
2004). Investors demand a higher rate
of return to compensate for the per-
ceived riskiness of the firm due to less
reliable accounting numbers following a
financial reporting failure.
As for debt contracts, Sengupta (1998)
suggests that quality of financial report-
ing is likely used by lenders in calculat-
ing default risk. Sengupta (1998) found
that firms with high disclosure quality
ratings from financial analysts are
charged a lower cost of debt, and the
importance of disclosure is greater when
there is greater market uncertainty as
measured by the variance of stock re-
turns. Thus, lenders likely demand a
higher risk premium following a report-
ing failure in part due to the perceived
decrease in quality of the accounting
reports.
The risk premium demanded by share-
holders and debt holders also increases
following a reporting failure because of
the increased uncertainty about the fu-
ture profitability and economic prospects
of restatement firms. Palmrose et al.
(2004) found a significant downward
revision in earnings forecasts following
restatements and a significant increase in
analyst forecast dispersion (a proxy for
uncertainty). Hribar and Jenkins (2004)
found accounting restatements lead to
decreases in expected future earnings.
In summary, restatements can have nu-
merous negative effects. These include
economic losses to investors; damage to
the reputations of the firm, auditors,
management, and the board of directors;
an increase in the cost of capital; and a
negative impact on future earnings
power.
CSP and FP
Research on the relationship between
CSP and FP has resulted in positive
(Wokutch and Spencer, 1987; McGuire
5. 108 L. Mahoney, W. LaGore, J. A. Scazzaro / Issues in Social and Environmental Accounting 1 (2008) 104-130
et al., 1988, 1990; Waddock and Graves,
1997; Simpson and Kohers, 2002; Or-
litzky and Benjamin, 2001; Mahoney
and Roberts, 2007; Hill et al., 2007),
negative (Waddock and Graves, 1997,
Preston and O’Bannon, 1997; Patten,
2002) and neutral results (Alexander and
Buchholz, 1978; Aupperle et al., 1985;
Ullman, 1985; Cochran and Wood,
1984; Shane and Spicer, 1983; Fauzi,
forthcoming; Moore, 2001; Fauzi et al.,
2007). The negative view on the rela-
tionship between CSP and FP argues
that firms incur costs to improve social
performance and by doing so, they re-
duce profits and shareholder wealth.
The positive view argues that better CSP
is viewed as positive by various stake-
holders, leading to improved FP (Jones,
1995; Jones and Wicks, 1999). Those
who support the neutral relationship ar-
gue that the direct relationship between
CSP and FP does not exists due to the
complexity of the environment in which
firms and society operate in (Mahoney
and Roberts, 2007)
The problem of measuring CSP is ar-
gued by Waddock and Graves (1997) as
the primary reason for the conflicting
results found regarding the relationship
between CSP and FP. Waddock and
Graves (1997) found a positive relation-
ship between CSP and FP when using an
improved measurement of CSP, the
KLD index. The KLD index provides
access to a wide range of independent,
consistently applied ratings of U.S. firms
across a number of important social per-
formance attributes that were determined
by a knowledgeable group of individuals
not connected with the firms (Waddock
and Graves, 1997). KLD evaluates each
company traded on the U. S. stock ex-
change over the dimensions of commu-
nity, corporate governance, diversity,
employee relations, environment, human
rights, and product. The KLD index
ratings are based upon data gathered
from a broad range of sources; both in-
ternal and external to the firm (see Wad-
dock and Graves, 1995 for further de-
tails). Subsequently, this multidimen-
sional index has been regarded as one of
the best information sources available to
researchers studying CSP (Hillman and
Keim, 2001) and has been used in many
subsequent studies (McGuire et al.,
2003; Hillman and Keim, 2001; Albin-
ger and Freeman, 2000, Greening and
Turban, 2000; Mahoney and Roberts,
2007; Mahoney et al., 2008; Johnson
and Greening, 1999).
Research Questions
CSP: As discussed previously, there are
significant negative economic, legal,
reputational, and contractual conse-
quences to a financial reporting failure.
A financial reporting failure is evidence
that previously issued accounting reports
were incorrect, thus creating uncertainty
about the credibility and verifiability of
financial reports after the reporting fail-
ure. In response to financial reporting
failures, studies find firms take steps to
improve corporate governance mecha-
nisms following a fraud or restatement
in order to restore credibility and trans-
parency in their financial reporting. For
example, Farber (2005) finds fraud firms
increase the number of audit committee
meetings and the number and percentage
of outside board members in the three-
year period following the fraud. LaGore
(2008) finds restating firms significantly
increase the number of outside directors
on the board, the number of audit com-
mittee meetings, and the number of out-
side directors and financial experts on
the audit committee in the three-year
6. L. Mahoney, W. LaGore, J. A. Scazzaro / Issues in Social and Environmental Accounting 1 (2008) 104-130 109
period following a restatement an-
nouncement. These changes in corpo-
rate governance may be mechanisms
that constrain management’s opportunis-
tic behavior and lead to more transparent
reporting. However, it is unclear how
this improvement in corporate govern-
ance following a fraud or restatement
affects a firm’s CSP.
Prior research finds a positive relation-
ship between disclosure level and CSP
(Gelb and Strawser, 2001). Mahoney et
al. (2008) examine CSP and executive
compensation before and after the Sar-
banes-Oxley Act (SOX) and find that the
improvements in corporate governance
required by SOX may be resulting in
increased transparency regarding the
measurement of CSP and an increase in
accountability, as firms appear to be
structuring compensation to promote
CSP. Gelb and Strawser (2001) also
find that more extensive disclosures are
provided by firms with higher CSP rat-
ings. Given that measures of CSP tend
to rely on publicly available information,
it may be that firms before the restate-
ment would have been reluctant to make
factors that are encapsulated in CSP
weaknesses (bad news) available to the
public. It follows that if improvements
in corporate governance following a re-
statement encourage revelation and
transparency, the resulting increase in
information available may influence
CSP in a negative direction. Further-
more, following the restatement period,
firms may feel need to be more account-
able, thus influencing CSP in a positive
direction. However, it would be difficult
to theoretically determine the net direc-
tional change in CSP as a result of re-
statement. Therefore, the first research
question tested is:
H1: CSP (Total, Product and People)
before restatement is different than CSP
after restatement.
CSP and FP: As discussed before, em-
pirical results concerning the nature of
the relationship, if any, between CSP
and FP, continues to be mixed (See Grif-
fin and Mahon, 1997; Roman et al.,
1999). Researchers have hypothesized
and have given rational theoretical justi-
fication for negative, positive, and neu-
tral links between CSP and FP. Wad-
dock and Graves (1997) argue that the
fundamental reason for the uncertainty
between the CSP and FP relationship is
the problem of measuring CSP. Hence,
Waddock and Graves (1997) used the
KLD database as an improved measure
of CSP and found a significant relation-
ship. Orlitzky (2008) found that there is
an overall positive, but highly variable
relationship between CSP and FP and
noted that the large variability of find-
ings in previous research is party due to
primary study artifacts. As studies find
financial restatements negatively affect
firm performance and lead to increased
uncertainty about the future profitability
and economic prospects of restatement
firms, it would be interesting to compare
the association between CSP and FP
between restating firms and non-
restating firms. Based upon these incon-
sistencies in prior research, it is unclear
how the negative effects of restatements
on firm performance will impact CSP.
Thus, since we are unable to predict a
directional effect, the second research
question tested is as follows:
H2: The relationship between CSP and
FP is different for restating firms than
non-restating firms.
7. 110 L. Mahoney, W. LaGore, J. A. Scazzaro / Issues in Social and Environmental Accounting 1 (2008) 104-130
METHODS
Sample Selections
Data on restating firms was obtained
from the GAO-03-395R Financial State-
ment Restatement Database for the pe-
riod of January 1, 1996 to June 30, 2002.
Of the initial sample of 919 restating
firms, 40 firms were eliminated because
no ticker symbol or CNUM could be
found. Ninety-three firms were deleted
because of multiple restatements. The
initial collection of financial data found
that 153 firms were missing the required
financial data. Furthermore, 174 firms
were missing financial data in the post-
restatement period only, 200 firms were
missing financial data in the pre-
restatement period only, and 48 firms
were missing financial data in both the
pre- and post-restatement periods. The
missing data does not appear to be clus-
tered in either the pre- or post-
restatement period. The number of
firms with missing Compustat data in
the pre-restatement period is comparable
to the post-restatement period, with 200
and 174 firms, respectively. Therefore,
approximately 63 percent (575 firms) of
the initial restatement sample of 919
firms did not have sufficient financial
data from Compustat to be included in
the final sample. This study requires
financial data for the two years prior to
and the two years following the restate-
ment announcement year. A likely ex-
planation for the loss of these firms is
due to the fact that many restating firms
declare bankruptcy or are delisted fol-
lowing the restatements. This could po-
tentially lead to a survivorship bias,
which may prevent the results from gen-
eralizing to the overall set of publicly
traded firms. Finally, 15 firms were
eliminated because their returns and
earnings data are considered outliers
with studentized residuals greater than
the absolute value of three. Outliers are
observations that are extreme or appear
inconsistent with the remaining data.
This resulted in a final sample of 196
firms that had restated their financial
statements. Missing CSP data for two
years prior and two years after the re-
statements reduced the final sample size
to 44 firms. These 44 firms were
matched based upon SIC code to firms
that had not restated their financial state-
ments. Thirty-one companies were
matched based upon the four-digit SIC
code, five companies were matched
based upon the last 3 digits of the SIC
code and eight companies were matched
based upon the last two digits of the SIC
code. The final sample consisted four
years of data for 44 restating firms and
44 non-restating firms, for a total num-
ber of 88 firms with 352 observations.
The Model
To test hypotheses 1, a randomized
block design was used to determine the
effect, if any, of restatement on the CSP.
To test hypotheses 2, panel data analysis
was used to examine the impact of re-
statement firms on the association be-
tween the dependent variable CSP and
the independent variable FP (ROA) with
firm size, firm leverage and firm indus-
try as control variables. In order to cap-
ture omitted factors that may lead to a
difference in CSP levels between the
prestatement years and the postatement
years, the indicator variable (as denoted
by Post) is included as a separate inde-
pendent control. Additionally, in order
to capture the difference between restat-
ing firms and non-restating firms, the
indicator variable (as denoted by Match)
is also included as a separate independ-
8. L. Mahoney, W. LaGore, J. A. Scazzaro / Issues in Social and Environmental Accounting 1 (2008) 104-130 111
ent variable. Two-factor interaction
terms are added to the model to allow
the effect of an independent variable on
the dependent variable to vary by the
level of another independent variable.
For example, the interaction term
ROA*Post allows the effect of ROA on
the dependent variable CSP to differ for
the prestatement years and the postate-
ment years. The three-factor interaction
term ROA*Post*Match is added to the
model to allow the ROA*Post interac-
tion to differ between restating and non-
restating firms. Hypotheses two is tested
through the following regression equa-
tion:
i: firm
t: year
k: 1-7 (number of SIC codes minus
one)
CSP = Corporate Social Perform-
ance Score Value for Total,
People, Product, Strengths and
Weaknesses
Post = 1 if one or two years after
restatement, 0 if otherwise
Match = 0 if restatement firm, 1 oth-
erwise
ROA =Return on Assets
Debt-to-Equity = Total Debt/Total Eq-
uity
Industryk = 1 if industry k, 0 otherwise
Measures
Dependent Variables
Measurement of CSP
As prior research points out, there is no
history of systematic social reporting
(Gray et al., 1995) and there are no gen-
erally accepted social reporting stan-
dards (Wallage, 2000). Because of this,
data for empirical research on CSP origi-
nates from voluntary disclosures by
firms or from external monitors. The
absence of standardized reporting is at
least partially responsible for the mixed
results found regarding the characteris-
tics of reporting firms, the quality of
their reporting, and the relationship be-
tween social performance and economic
performance (Roberts, 1992; Gray et al.,
1995).
Shane and Spicer (1983) was one of the
first published empirical studies to rely
on externally produced ratings of CSP,
using data developed by the U.S. Coun-
cil on Economic Priorities (CEP). They
argued that externally produced data was
superior to voluntary disclosure when
performing cross-sectional studies, stat-
ing:
In the absence of mandated dis-
closure and reporting standards,
voluntary disclosures tend to be
inconsistent and non-comparable
from firm to firm, even in the
same industry. On the other hand,
externally produced data (at least
as produced by the CEP) was
gathered using consistent proce-
dures for collection and reporting
across firms. Comparisons across
firms are thereby possible and
potentially meaningful (p. 523).
Subsequent accounting studies also
made use of CEP ratings (e.g., Cowen et
al., 1987; Roberts, 1992).
CSPi,t+1 = b0 +b1ROAit + b2Matchit + b3Postit + b4ROA*Matchit +
b5ROA*Postit + b6Match*Postsit + b7ROA*Post*Matchit
+ b8Debt-to-Equityit + b9Assetsit + b10Industrykit
(1)
9. 112 L. Mahoney, W. LaGore, J. A. Scazzaro / Issues in Social and Environmental Accounting 1 (2008) 104-130
In 1994, several U.S. researchers began
to address the major problems in CSP
measurement by using the Kinder,
Lydenberg, Domini (KLD) database as a
measurement of CSP. KLD rates over
650 corporations traded on the U.S.
stock exchanges on various dimensions
considered important to social perform-
ance. Because the KLD database was
developed and maintained by an inde-
pendent rating service that assessed CSP
across a range of dimensions related to
stakeholder concerns, researchers argued
that the KLD database brought a new
and improved consistent measurement of
CSP for United States companies
(Waddock and Graves, 1997). U.S. re-
search flourished with this new measure-
ment assessment (Graves and Waddock,
1994; Waddock and Graves, 1997; Grif-
fin and Mahon, 1997; Bendheim et al.,
1998; Berman et al., 1999; Johnson and
Greening, 1999; Greening and Turban,
2000; Albinger and Freeman, 2000; Ruf
et al., 2001). The KLD database has
been recognized as the best information
available for researchers studying CSP
in the U.S. (Hillman and Keim, 2001).
Therefore, we use KLD’s ratings of so-
cial performance to measure CSP.
Following previous research (Johnson
and Greening, 1999; Mahoney and
Thorne, 2005), we use several different
measurements of CSP that consider To-
tal CSP, Total CSP Product, and Total
CSP People across the dimensions of
strengths and weakness. CSP Strengths
are positive aspects of CSP; examples
include positive union relations, strong
community giving, and environmental
planning. CSP Weaknesses are negative
aspects of CSP; examples include safety
problems, human rights violations, and
environment fines. Figure 1 summarizes
the different measures of CSP employed
in this study.
Total CSP Variable CSP Strengths
Variable
CSP Weaknesses
Variable
Total CSP
(Community, Diversity, Em-
ployee Relations, Environ-
ment, International, Product
and Business Practices and
Other)
Total CSP Total CSP Product Total CSP People
Product Dimension (Product
and Business Practices and
Environment)
Total CSP Product CSP Product
Strengths
CSP Product
Weaknesses
People Dimension
(Community, Diversity and
Employee Relations
Total CSP People CSP People
Strengths
CSP People
Weaknesses
Figure 1
Summary of CSP Measures
*Per Mahoney and Thorne (2005)
10. L. Mahoney, W. LaGore, J. A. Scazzaro / Issues in Social and Environmental Accounting 1 (2008) 104-130 113
Each company is given a Total CSP rat-
ing by KLD along seven dimensions:
community, diversity, employee rela-
tions, environment, `international, prod-
uct and business practices, and other [].
Each of these dimensions is given a
strength rating and a weakness rating on
a scale of zero to two. A rating of 0 indi-
cates no strengths or no weaknesses
while a rating of 2 represents a major
strength or a major weakness. CSP
Strengths are calculated by summing the
strength ratings across all seven dimen-
sions for each company while CSP
Weaknesses are calculated by summing
the weakness ratings across all seven
dimensions. Finally, Total CSP is calcu-
lated by taking CSP Strengths and sub-
tracting CSP Weaknesses.
Our second measure of CSP is a sub-
dimension of Total CSP: Total CSP
Product. Total CSP Product attempts to
capture the extent to which a firm is
committed to quality products and prac-
tices sound environmental policies. For
example, executives concerned with
consistent returns over time may likely
avoid the imposition of costly environ-
mental fines (Johnson and Greening,
1999; Silverstein, 1994). Total CSP
Product is comprised of KLD’s product
and business practices and environment
dimensions that relate to product and
service quality and to the firm’s stance
toward the natural environment. This
classification is consistent with ISO
standards that require firms to establish a
series of management subsystems, stan-
dards, and guidelines to ensure product
quality as well as safe and environmen-
tally responsible practices (Uzumeri,
1997).
Our third measure of CSP is a sub-
dimension of Total CSP: Total CSP Peo-
ple. Total CSP People captures the con-
tributions firms make to communities
through their hiring of women and mi-
norities and their treatment of employ-
ees. Executives may interpret the costs
of hiring minorities as unnecessary
short-term expenses; however, they may
recognize the long-term benefits of pro-
active employment policies when con-
sidering the long-term avoidance of
costly fines (Mahapatra, 1984). Further-
more, signaling theory suggests that hir-
ing underrepresented groups sends a
positive signal regarding a firm’s reputa-
tion and legitimacy (Turban and Green-
ing, 1997). Total CSP People is com-
posed of KLD’s dimensions of commu-
nity, employee relations, and diversity.
Corporate governance would be ex-
pected to have bearing and an associa-
tion on aspects or sub-dimensions of
CSP that could be directly impacted by
executives’ decisions while other sub-
dimensions may be more impacted by
the general business or cultural context
in which a firm operates. For example, a
firm’s diversity may be primarily im-
pacted by the labor pool that is available,
while its product dimensions may be
more easily impacted by executive’s
attention to control and safety aspects in
product development. In fact, previous
research has found differential associa-
tions between some aspects of corporate
governance and the people/product as-
pects of CSP. For example, a positive
relationship for U.S. firms between top
executive equity and the total product
dimension of CSP has been found
(Johnson and Greening, 1999), without
comparable associations on the people
aspect of CSP.
As discussed before, firms take steps to
improve corporate governance mecha-
11. 114 L. Mahoney, W. LaGore, J. A. Scazzaro / Issues in Social and Environmental Accounting 1 (2008) 104-130
nisms following a fraud or restatement
in order to restore the credibility of their
financial reports. In addition, it is ex-
pected that corporate governance would
have bearing and an association on as-
pects or sub-dimensions of CSP that
could be directly impacted by execu-
tives’ decisions. Thus it follows that
improvements in corporate governance
following a financial restatement may
affect certain aspects or sub-dimensions
of CSP, particularly those that could be
directly affected by executive decisions.
Independent Variables for Panel Data
Analysis
Following previous research, return on
assets (ROA) was used to measure a
firm’s FP (Waddock and Graves, 1997,
Roman et al., 1999, Mahoney and Rob-
erts, 2007; Fauzi, et al., 2007). Follow-
ing the works of prior research
(Waddock and Graves, 1997; Mahoney
and Roberts, 2007), data on CSP was
collected for the year following the year
ROA was reported to provide an oppor-
tunity for capturing a lag between CSP
and FP. Information on ROA was ob-
tained from the Compustat database.
Control Variables. Consistent with prior
research, we control for firm size, debt
level and industry as previous research
noted that they may cause differences in
FP (Waddock and Graves, 1997; Graves
and Waddock, 1994; Mahoney and Rob-
erts, 2007). Consistent with prior re-
search, total assets is used as a proxy for
size of the firm (Mahoney and Roberts,
2007; Graves and Waddock, 1994; Wad-
dock and Graves, 1997) and debt-to-
equity (Mahoney and Thorne, 2006) is
used to represent debt level. Informa-
tion on total assets and debt-to-equity
are obtained from the Compustat data-
base. Industries are represented by
dummy variables and were broken down
by four-digit Standard Industrial Classi-
fication (SIC) code per Graves and Wad-
dock (1994).
Panel Data Models
In summary, we investigate the behavior
of CSP and its relation to FP by running
nine separate regressions using panel
data—three regressions using CSP as
our dependent variable measure for To-
tal CSP, Total CSP Product, and Total
CSP People; three regressions using
CSP Strengths for Total CSP Strengths,
CSP Product Strengths, and CSP People
Strengths and three regressions using
CSP Weaknesses for Total CSP Weak-
nesses, CSP Product Weaknesses, and
CSP Weaknesses, all with ROA as the
independent variable.
RESULTS
Descriptive Statistics and Correlation
Analysis
Table 1 shows the means, standard de-
viations, and correlations for our inde-
pendent, dependent, and control vari-
ables for the entire sample consisting of
non-restating and restatement firms.
The means for Total CSP, CSP
Strengths, and CSP Weaknesses are .15,
2.99, and 2.84 respectively. The means
for Total CSP Product, CSP Product
Strengths, and CSP Product Weaknesses
are -.61, .50, and 1.11 respectively. The
means for Total CSP People, CSP Peo-
ple Strengths, and CSP People Weak-
nesses are 1.53, 2.39, and .86 respec-
tively. The mean ROA is 6.07% and is
significantly positively correlated with
Total CSP, Total CSP Product, and Total
14. L. Mahoney, W. LaGore, J. A. Scazzaro / Issues in Social and Environmental Accounting 1 (2008) 104-130 117
CSP People and significantly negatively
correlated with CSP Weaknesses, CSP
Product Weaknesses, and CSP People
Weaknesses. The means for debt-to-
equity is 58.05% and for assets are
$12,357 million.
Table 2 shows the means, standard de-
viations, and correlations for our inde-
pendent, dependent, and control vari-
ables for restatement firms only. The
means for Total CSP, CSP Strengths,
and CSP Weaknesses are .27, 3.11, and
2.84 respectively. The means for Total
CSP Product, CSP Product Strengths,
and CSP Product Weaknesses are -.68,
.49, and 1.18 respectively. The means
for Total CSP People, CSP People
Strengths, and CSP People Weaknesses
are 1.69, 2.49, and .80 respectively. The
mean ROA is 5.48% and is significantly
positively correlated with Total CSP and
Total CSP Product and significantly
negatively correlated with CSP Product
Weaknesses. The mean debt-to-equity is
59.7% and the mean assets are $11,000
million.
Table 3 shows the means, standard de-
viations, and correlations for our inde-
pendent, dependent, and control vari-
ables for non-restating firms only. The
means for Total CSP, CSP Strengths,
and CSP Weaknesses are .03, 2.87, and
2.84 respectively. The means for Total
CSP Product, CSP Product Strengths,
and CSP Product Weaknesses are -.55,
.51, and 1.05 respectively. The means
for Total CSP People, CSP People
Strengths, and CSP People Weaknesses
are 1.37, 2.28, and .91 respectively. The
mean ROA is 6.64%. Similar to non-
restating firms, ROA is significantly
positively correlated with Total CSP and
Total CSP Product and significantly
negatively correlated with CSP Product
Weaknesses. Unlike non-restating
firms, ROA for restatement firms is also
significantly positively related to Total
CSP People and CSP People Strengths
along with being significantly negatively
related to CSP Weaknesses and CSP
People Weaknesses. Additionally, the
mean debt-to-equity is 56.4 % and the
mean assets are $13,713 million for non-
restating firms. Overall, restatement
firms tend to have a higher level of Total
CSP, CSP Strengths, and CSP People
Strengths and CSP Weaknesses while
non-restatement firms have a higher
level of CSP People Strengths and CSP
Product Weaknesses.
Hypothesis 1
To test hypothesis 1 a randomized block
design, equivalent to a paired t-test, was
used to determine the effect, if any, of a
restatement on Total CSP, CSP
Strengths, and CSP Weaknesses; Total
CSP Product, CSP Product Strengths,
and CSP Product Weaknesses; and Total
CSP People, CSP People Strengths, and
CSP People Weaknesses. The depend-
ent variable consisted of CSP scores
which were compared at different time
periods, i.e., one year before and after
restatement and two years before and
after restatement. Table 4 summarizes
the average Total, Strengths, and Weak-
nesses CSP scores for these time periods
and indicates which differences are sta-
tistically significant. Note that the aver-
age total for a score is equal to the dif-
ference between the corresponding aver-
age strength and average weakness.
Most of the significant differences are
found by looking at two years before
and two years after restatement. CSP
Strengths and CSP Weaknesses signifi-
cantly increased at p<.01 in the period
16. L. Mahoney, W. LaGore, J. A. Scazzaro / Issues in Social and Environmental Accounting 1 (2008) 104-130 119
following restatement though CSP
Weaknesses increased by a greater
amount than CSP Strengths. This sig-
nificance appears to be driven by the
People dimensions of CSP as both CSP
People Strengths and CSP People Weak-
nesses significantly increased at p<.01.
Also, CSP People Weaknesses increased
by a greater amount than CSP People
Strengths. When looking at one year
before and one year after restatement,
we do find that Total CSP significantly
decreased and CSP Weaknesses signifi-
cantly increased at p<.01. Additionally,
Total CSP Product significantly de-
creased at p<.05.
Hypothesis 2
Because we have cross-sectional and
time series data, we used panel data
analyses to further investigate the
change in CSP and test hypothesis two.
In all equations, size, debt-to-equity ra-
tio, and industry were included as con-
trol variables. Consistent with prior lit-
erature, a one-year lag between the FP
variable and the dependent and control
variables was used.
Table 5 presents the results of our three
panel data regressions that include Total
CSP, CSP Strengths, and CSP Weakness
as our dependent variable and ROA as
our independent variable. For Total
CSP, similar to the results found in the
randomized block design, the Post vari-
able was significantly negatively related
at p<.05, indicating that CSP signifi-
cantly declined for all firms in the two
years following the restatement period.
For the regression with CSP Strengths as
the independent variable, we found that
the Post variable was significantly posi-
Dependent One Year Two Years
Variable Before After Difference Before After Difference
Total CSP 0.523 -0.136 0.659** 0.545 0.136 0.409
CSP Strengths 3.068 3.114 -0.045 2.773 3.477 -0.705**
CSP Weaknesses 2.545 3.250 -0.705** 2.227 3.341 -1.114**
Total CSP Product -0.614 -0.841 0.227* -0.591 -0.682 0.091
CSP Product
Strengths
0.500 0.477 0.023 0.477 0.523 -0.046
CSP Product Weak-
nesses
1.114 1.318 -0.205 1.068 1.205 -0.136
Total CSP People 1.773 1.636 0.136 1.705 1.636 0.068
CSP People Strengths 2.455 2.523 -0.068 2.205 2.773 -0.568**
CSP People Weak-
nesses
0.682 0.886 -0.205 0.500 1.136 -0.636**
Table 4
Restating Firms Average CSP, Product, and People Scores for One
and Two Year Time Periods
*p<.05
**p<.01
17. 120 L. Mahoney, W. LaGore, J. A. Scazzaro / Issues in Social and Environmental Accounting 1 (2008) 104-130
tively related at p<.05 indicating that
CSP Strengths are higher after the re-
statement period for all firms, which is
consistent with our results found in the
randomized block design. Additionally,
we found the interaction term of
Match*Post was significantly negatively
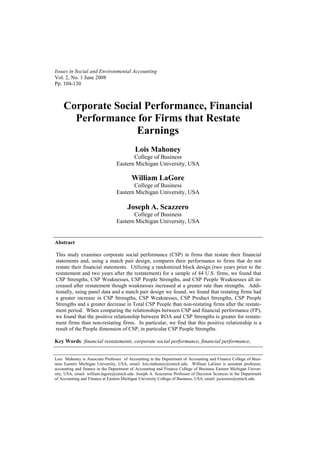
at p< .01. As shown in Figure 2, though
CSP Strengths increased for all firms
after the restatement period the increase
was higher for restatement firms than
non-restatement firms, suggesting that
restatement firms may be more account-
able after the period of restatement by
managing their CSP Strengths. The in-
teraction term of ROA*Match is signifi-
cantly negatively related at p<.01 indi-
cating that the effect of ROA on CSP
Strengths is greater for restatement firms
than non-restating firms, supporting hy-
pothesis 2. The interaction term of
ROA*Post*Match was significantly
positively related to CSP Strengths at
p<.01 indicating that the effect of ROA
on CSP Strengths also varies in the peri-
ods prior and after restatement. For the
regression using CSP Weaknesses as the
dependent variable, we found the Post
variable was significantly positively re-
lated at p<.01, indicating that for all
firms the average CSP Weakness in-
creased in the period following the re-
statement. These results are also consis-
tent with our findings in the randomized
block design. Also the interaction term
of Match*Post was significantly nega-
tively related at p<.05. As shown in Fig-
ure 3, restatement firms had a greater
increase in CSP Weaknesses than non-
restatement firms. This is consistent
with increased transparency following
the restatement period as more negative
information concerning the firm is made
available.
Table 6 presents the results of our three
Dependent Total CSP CSP Strengths CSP Weakness
Independent
ROA -.015 .025 .009 .016 .025 .018
Match .293 .669 .483 .498 .184 .431
Post -.653 .272* .396 .180* 1.053 .195**
ROA*Match -.074 .039 -.084 .026** -.009 .028
ROA*Post .024 .034 -.012 .023 -.038 .025
Match*Post -.426 .400 -1.124 .266** -.732 .286*
ROA*Post*Match .073 .046 .103 .031** .032 .033
Control
Debt-to-Equity -.184 1.169 .609 .804 1.009 .802
Assets -.001 .000 .001 .000** .001 .000**
R2
.151 .284 .464
Wald chi-square 40.3** 66.8** 133.46**
Panel data model type
Number of Firms 88 88 88
Number of Observations 352 352 352
*p<.05
**p<.01
Table 5
Coefficient (Standard Error) of Panel Data Analysis for CSP Using a One Year
Lag between the Dependent Variable and Independent Variables
18. L. Mahoney, W. LaGore, J. A. Scazzaro / Issues in Social and Environmental Accounting 1 (2008) 104-130 121
2.5
2.6
2.7
2.8
2.9
3.0
3.1
3.2
3.3
3.4
Prior to
Restatement
After
Restatement
Time Period
CSP
Strengths
Restatement
Firms
Non-
Restatement
Firms
Figure 2
CSP Strengths
2.0
2.2
2.4
2.6
2.8
3.0
3.2
3.4
Prior to
Restatement
After Restatement
Time Period
C
S
P
W
eakn
esses
Restatement Firms
Non-Restatement
Firms
Figure 3
CSP Weaknesses
19. 122 L. Mahoney, W. LaGore, J. A. Scazzaro / Issues in Social and Environmental Accounting 1 (2008) 104-130
panel data regressions that include Total
CSP Product, CSP Product Strengths,
and CSP Product Weakness as our de-
pendent variable and ROA as our inde-
pendent variable. For Total CSP Prod-
uct, we found no significant relation-
ships. For the regression with CSP
Product Strengths as the dependent vari-
able, we found that the interaction term
of Match*Post was significantly nega-
tively related at p<.05. As shown in Fig-
ure 4, restatement firms showed a slight
increase in CSP Product Strengths in the
period following restatement while non-
Dependent Total CSP Product CSP Product
Strengths
CSP Product Weak-
ness
Independent
ROA -.009 .011 -.004 .005 .005 .009
Match .219 .319 .066 .152 -.155 .297
Post -.181 .118 .026 .057 .206 .104*
ROA*Match -.003 .017 -.000 .008 .004 .015
ROA*Post .010 .015 -.005 .007 -.015 .013
Match*Post .057 .174 -.168 .083* -.218 .153
ROA*Post*Match -.004 .020 .009 .010 .013 .018
Control
Debt-to-Equity -.306 .522 -.132 .250 .124 .467
Assets -.001 .000** .001 .000 .001 .000**
R2
.3363 .177 .407
Wald chi-square 62.72** 26.26** 74.52**
Panel data model type
Number of Firms 88 88 88
Number of Observations 352 352 352
Table 6
Coefficient (Standard Error) of Panel Data Analysis for CSP Using a One Year
Lag between the Dependent Variable and Independent Variables
*p<.05
**p<.01
restatement firms showed a decrease.
Again, suggesting that restatement firms
may be more accountable after the pe-
riod of restatement and managing their
CSP Product Strengths. For the regres-
sion using CSP Product Weaknesses as
the dependent variable, only the Post
term was significantly positively related
at p<.05 indicating that CSP Product
Weaknesses increased for all firms in the
period following the restatement.
Table 7 presents the results of our three
panel data regressions that include Total
CSP People, CSP People Strengths, and
CSP People Weakness as our dependent
variable and ROA as our independent
variable. For our regression with Total
CSP People, the interaction term of
ROA*Match is significantly negatively
related at p<.01 indicating that the effect
of ROA on Total CSP People is greater
for restatement firms than non-restating
firms, supporting hypothesis 2. The in-
teraction term of ROA*Post*Match is
also significantly positively related to
Total CSP People at p<.01 indicating
that the effect of ROA on CSP Strengths
20. L. Mahoney, W. LaGore, J. A. Scazzaro / Issues in Social and Environmental Accounting 1 (2008) 104-130 123
also varies in the periods prior and after
restatement. The interaction term of
Match*Post is significantly negatively
related at p<.05. Per figure 5, restate-
ment firms had a bigger decrease in To-
tal CSP People after restatement than
non-restatement firms. For the regres-
sion using CSP People Strengths as the
dependent variable, we found that the
Post variable is significantly positively
related at p>.05 indicating that for all
firms CSP People Strengths significantly
increased in the two years following the
restatement period. We also found that
the interaction term of ROA*Match is
significantly negatively related at p<.01,
indicating that the effect of ROA on
CSP People Strengths is greater for re-
statement firms than non-restating firms,
supporting hypothesis 2. The interaction
term of ROA*Post*Match is also sig-
nificantly positively related to CSP Peo-
ple Strengths at p<.01, indicating that
the effect of ROA on CSP People
Strengths also varies in the periods prior
and after restatement. The interaction
term of Match*Post is significantly
negatively related at p<.05. Per figure 6,
restatement firms had a bigger increase
in CSP People Strengths after restate-
ment than non-restatement firms, again
suggesting the restatement firms may be
more accountable in the period follow-
ing restatement by focusing in on CSP
strengths. For our CSP People Weak-
nesses regression, the only significant
variable that we found was the Post vari-
able at p<.01, indicating that for all
firms CSP People Weaknesses signifi-
cantly increased in the two years follow-
ing the restatement period.
SUMMARY AND DISCUSSION
This study was undertaken to investigate
CSP in restatement firms along with in-
vestigating the relationship of CSP to FP
0.30
0.35
0.40
0.45
0.50
0.55
0.60
Prior to
Restatement
After Restatement
Time Period
C
SP
P
ro
d
u
c
t
Stre
n
g
th
s
Restatement Firms
Non-Restatement
Firms
Figure 4
CSP Product Strengths
21. 124 L. Mahoney, W. LaGore, J. A. Scazzaro / Issues in Social and Environmental Accounting 1 (2008) 104-130
for these same firms. Consistent with
prior research on accountability and dis-
closure (Mahoney et al., 2008), we
found Total CSP after restatement of
earnings was significantly lower than the
average Total CSP before restatement.
In particular, even though CSP Strengths
increased, it was offset by a greater in-
crease in CSP Weaknesses. This in-
crease in strengths may be due to the
efforts by the firms to be accountable
and improve the reputation of the firm.
However, this may have been offset by
the negative impact of transparency sur-
rounding financial restatement. These
findings support hypothesis 1 for Total
CSP which differs before and after re-
statement.
We also compared restatement firms
with matched non-restating firms in our
panel data analysis. We found that CSP
Strengths, CSP Weaknesses, and CSP
People Strengths for restatement firms
showed a greater increase than non-
restatement firms. For Total CSP Peo-
ple, we found that restatement firms
showed a greater decrease than non-
restatement firms. For CSP Product
Strengths, we found that while restate-
ment firms increased slightly, non-
restating firms showed a significant de-
crease. These findings are consistent
with prior research on reporting failure
that show that restating firms take steps
to improve corporate governance mecha-
nisms following restatement in order to
restore credibility and transparency
Dependent Total CSP People CSP People
Strengths
CSP People Weak-
ness
Independent
ROA .021 .018 .015 .014 -.006 .011
Match .268 .446 .431 .394 .214 .202
Post -.042 .197 .324 .153* .378 .128**
ROA*Match -.093 .028** -.084 .022** .001 .018
ROA*Post -.015 .025 -.007 .019 .005 .016
Match*Post -.715 .290* -.881 .225** -.212 .188
OA*Post*Match .107 .034** .093 .026** -.010 .022
Control
Debt-to-Equity .213 .821 .793 .668 .576 .419
Assets .001 .000* .001 .000** .001 .000**
R2
.166 .283 .203
Wald chi-square 41.06** 80.66* 54.03**
Panel data model type
Number of Firms 88 88 88
Number of Observa-
tions 352 352 352
Table 7
Coefficient (Standard Error) of Panel Data Analysis for CSP Using a One Year
Lag between the Dependent Variable and Independent Variables
*p<.05
**p<.01
22. L. Mahoney, W. LaGore, J. A. Scazzaro / Issues in Social and Environmental Accounting 1 (2008) 104-130 125
(Farber, 2005; LaGore, 2008) and pro-
vide addition support for hypothesis 1.
We also find support for hypothesis 2,
since a stronger positive relationship
exists between ROA on CSP Strengths
for restatement firms than non-restating
firms. In particular, we find that this
effect is a result of the People dimension
of CSP with significant relationships for
Total CSP People and CSP People
Strengths while no relationship was
found for any dimension of CSP Prod-
uct. These results provide further sup-
port for the previous literature on the
positive relationship between CSP and
FP and that CSP and FP may be mutu-
ally reinforcing organizational activities
(Orlitzky, 2008).
Like all research, ours has limitations
associated with the measures, methodol-
ogy and sample size. The use of KLD
ratings to measure CSP are questionable
(Chatterji and Levine, 2006; Chatterji, et
al., forthcoming; Orlitzky and Swanson,
2008; Porter and Kramer, 2006) since
they are determined by an independent
firm and are the result of Kinder, Lyden-
berg, Domini Research & Analytics’
definition and evaluations of CSP. Pre-
vious research has found that while KLD
weakness ratings are a good summary of
past environmental performance, KLD
strengths do not accurately predict pollu-
tion levels or compliance violations
(Chatterji et al., forthcoming). Research
has also found that KLD is not optimally
using publicly available data (Chatterji
et al., forthcoming). Furthermore, the
equal weighting and content of each di-
mension of CSP is another limitation
(Chatterji and Levine, 2006). Future
research on the investigation of the con-
struction validity of KLD, the impact of
equal weighting of dimension and cri-
tiques of KLD’s perspective on CSP
would aid in the development of this
research stream.
The sample selection bias is also a po-
tential alternative explanation of the re-
sults. There are some possible selection
biases in our final sample of restatement
firms since the research design requires
each sample firm to have data for a con-
secutive 5-year period, the two years
before and after the restatement an-
nouncement. Thus, the final sample
tends to include surviving and larger
firms that may be perceived as more re-
liable. Therefore, the external validity
of the study may be in question as the
results may not generalize to the overall
population of publicly traded companies.
On the other hand, larger firms receive
more media coverage and regulatory
attention than smaller firms and there-
fore may be under more pressure to
change financial reporting and corporate
social performance following a restate-
ment in order to restore the public’s trust
in their financial reporting. The results
of this analysis are encouraging because
the prospect of a positive CSP and FP
ownership links means that even restate-
ment firms can be socially responsible
and financially successful following the
period of restatement.
REFERENCES
Albinger, H. S. & Freeman, S. J. (2000)
“Corporate Social Performance
and Attractiveness as an Em-
ployer to different job seeking
populations”, Journal of Business
Ethics, Vol. 28, No. 3, pp. 243-
253.
Alexander, G. & Buchholz, R. (1978)
“Corporate Social Responsibility
23. 126 L. Mahoney, W. LaGore, J. A. Scazzaro / Issues in Social and Environmental Accounting 1 (2008) 104-130
and Stock Market Performance”,
Academy of Management Journal,
Vol. 21, No. 3, pp. 479-486.
Anderson, K. & Yohn, T. (2002) “The
Effect of 10-K Restatements on
Firm Value, Information Asym-
metries, and Investors’ Reliance
on Earnings”, Working Paper,
Georgetown University.
Aupperle, K.E., Carroll, A.B. & Hat-
field, J.D. (1985) “An Empirical
Examination of the Relationship
between Corporate Social Re-
sponsibility and Profitability”,
Academy of Management Journal,
Vol. 28, No. 2, pp. 446-463.
Barton, J. (2005) “Who Cares About
Auditor Reputation?” Contempo-
rary Accounting Research, Vol.
22, No. 3, pp. 549-586.
Beasley, M.S., Carcello, J.V. & Herman-
son, D.R. (1999) “Just say ‘No’”,
Strategic Finance, Vol. 80, No.
11, pp. 52-57.
Bendheim, C.L., Waddock, S.A. &
Graves, S.B. (1998) “Determining
Best Practice in Corporate-
Stakeholder Relations Using Data
Envelopment Analysis”, Business
and Society, Vol. 37, No. 3, pp.
305-338.
Berman, S.L., Wicks, A.C., Kotha, S. &
Jones, T.M. (1999) “Does Stake-
holder Orientation Matter? The
Relationship between Stakeholder
Management Models and Firm
Financial Performance”, Academy
of Management Journal, Vol. 42,
No. 5, pp. 488-506.
Bhagat, S., Bizjak, J. & Coles, J.L.
(1998) “The Shareholder Wealth
Implications of Corporate Law-
suits”, Financial Management,
Vol. 27, No. 4, pp. 5-27.
Carroll, A. (1979)“A Three-Dimensional
Conceptual Model of Corporate
Performance”, Academy of Man-
agement Review, Vol. 4, No. 4,
pp. 497-505.
Chatterji, A.K., & Levine, D. (2006)
“Breaking Down the Wall of
Codes: Evaluating Non-Financial
Performance Measurement”. Cali-
fornia Management Review, 48
(2): 29-51.
Chatterji, A. K., Levine, D. & M.W.
Toffel. (Forthcoming). “How
Well do Social Ratings Actually
Measure Corporate Social Re-
sponsibility?” Journal of Econom-
ics and Management Strategy.
Cochran, F.L. & Wood, R.A. (1984)
“Corporate Social Responsibility
and Financial Performance”,
Academy of Management Journal,
Vol. 27, No. 1, pp. 42-56.
Cowen, S., Ferreri, L. & Parker, L.
(1987) “The Impact of Corporate
Characteristics on Social Respon-
sibility Disclosure: A Typology
and Frequency-Based Analysis”,
Accounting, Organizations & So-
ciety, Vol. 12, No. 2, pp. 111-122.
Dechow, P., Sloan, R. & Sweeney, A.
(1996) “Causes and Consequences
of Earnings Manipulations: An
Analysis of Firms Subject to En-
forcement Actions by the SEC”
Contemporary Accounting Re-
search, Vol. 13, No. 1, pp. 1-36.
DeFond, M. & Jiambalvo, J. (1991)
“Incidence and Circumstances of
Accounting Errors”, The Account-
ing Review, Vol. 66, No. 3, pp.
643-655.
Desai, H., Hogan, C. & Wilkins, M.
(2006) “The Reputational Penalty
for Aggressive Accounting: Earn-
ings Restatements and Manage-
ment Turnover”, The Accounting
Review, Vol. 81, No. 1, pp. 83-
112.
24. L. Mahoney, W. LaGore, J. A. Scazzaro / Issues in Social and Environmental Accounting 1 (2008) 104-130 127
Donoher, W.J., Reed, R. & Storrud-
Barnes, S.F. (2007) “Incentive
Alignment, Control and the Issue
of Mislead Financial Disclosures’.
Journal of Management, 33
(4):547-569.
Farber, D. (2005) “Restoring Trust after
Fraud: Does Corporate Govern-
ance Matter?” The Accounting
Review, Vol. 80, No. 2, pp. 539-
561.
Fauzi, H., Mahoney, L. (forthcoming).
“Identifying and Analyzing the
Level of Practices of Company’s
Social Responsibility in Improv-
ing Financial Performance”, Jour-
nal of Business and Management.
________, ________, & Rahman, A. A.
(2007) “The Link between Corpo-
rate Social Performance and Fi-
nance Performance: Evidence
from Indonesian Companies”,
Issues in Social and Environ-
mental Accounting, Vol. 1, No. 1,
pp. 149-159.
Frooman, J. (1997) “Socially Irresponsi-
ble and Illegal Behavior and
Shareholder Wealth”, Business
and Society, Vol. 36, No. 3, pp.
221-249.
Gelb, D. S. & Strawser, J. S. (2001)
“Corporate Social Responsibility
and Financial Disclosures: An
Alternative Explanation for In-
creased Disclosure”, Journal of
Business Ethics, Vol. 33, pp. 1-13.
General Accounting Office (2002)
“Financial Statement Restate-
ments: Trends, Market Impacts,
Regulatory Responses, and Re-
maining Challenges”. GAO-03-
138.
Graves, S.B., & Waddock, S.A. (1994)
“Institutional Owners and Corpo-
rate Social Performance”, Acad-
emy of Management Journal, Vol.
37, No. 4, pp. 1034-1046.
Gray, R., Kouhy, R. & Lavers, S. (1995)
“Corporate Social and Environ-
mental Reporting: A Review of
the Literature and a Longitudinal
Study of UK Disclosure”, Ac-
counting, Auditing & Account-
ability Journal, Vol. 8, No. 2, pp.
47-77.
Greening, D.W. & Turban, D. B. (2000)
“Corporate Social Performance as
a Competitive Advantage in At-
tracting a Quality Workforce”,
Business and Society, Vol. 39, No.
3, pp. 254-280.
Griffin, J.J. & Mahon, J.F. (1997) “The
Corporate Social Performance and
Corporate Financial Performance
Debate” Business and Society,
Vol. 36, No. 1, pp. 5-31.
Hill, R.P., Ainscough, T., Shank, T. &
Manullang, D. (2007) “Corporate
Social Responsibility and Socially
Responsible Investing: A Global
Perspective”, Journal of Business
Ethics, Vol. 70, No. 2, pp. 165–
174.
Hillman, A.J. & Keim, G.D. (2001)
“Shareholder Value, Stakeholder
Management, and Social Issues:
What’s the Bottom Line?” Strate-
gic Management Journal, Vol. 22,
No. 2, pp. 125-139.
Hribar, P. & Jenkins, N. (2004) “The
Effect of Accounting Restate-
ments on Earnings Revisions and
the Estimated Cost of Capital”,
Review of Accounting Studies,
Vol. 9, pp. 337-356.
Johnson, R.A. & Greening, D.W. (1999)
“The Effects of Corporate Gov-
ernance and Institutional Owner-
ship Types on Corporate Social
Performance”, Academy of Man-
agement Journal, Vol. 42, No. 5,
pp. 564-576.
25. 128 L. Mahoney, W. LaGore, J. A. Scazzaro / Issues in Social and Environmental Accounting 1 (2008) 104-130
Jones, T.M. (1995) “Instrumental Stake-
holder Theory: A Synthesis of
Ethics and Economics”, Academy
of Management Review, Vol. 20,
No. 2, pp. 404-437.
_______ & Wicks, A.C. (1999)
“Convergent Stakeholder The-
ory”, Academy of Management
Review, Vol. 24, No. 2, pp. 206-
221.
Karpoff, J.M. & Lott, J.R. (1993) “The
Reputational Penalty Firms Bear
for Committing Criminal Fraud”,
Journal of Law and Economics,
Vol. 36, pp. 757-802.
Kinney, W. & McDaniel, L. (1989)
“Characteristics of Firms Correct-
ing Previously Reported Quarterly
Earnings”, Journal of Accounting
and Economics, Vol. 11, No. 1,
pp. 71-93.
LaGore, W.D. (2008) “Conditional and
Unconditional Conservatism Fol-
lowing a Financial Reporting Fail-
ure: An Empirical Study”, Disser-
tation, Florida State University.
Mahapatra, S. (1984) “Investor Reaction
to a Corporate Social Account-
ing”, Journal of Business, Fi-
nance & Accounting, Vol. 11, No.
1, pp. 29-40.
Mahoney, L.S. & Roberts, R. (2007)
“Corporate Social Performance,
Financial Performance and Insti-
tutional Ownership in Canadian
Firms”, Accounting Forum, Vol.
31, No. 3, pp. 233-253.
_________ & Thorne, L. (2005)
“Corporate Social Responsibility
and Long-term Compensation:
Evidence from Canada”, Journal
of Business Ethics, Vol. 57, No. 3,
pp. 241-253.
_________ & _______ (2006) “An Ex-
amination of the Structure of Ex-
ecutive Compensation and Corpo-
rate Social Responsibility: A Ca-
nadian Investigation”, Journal of
Business Ethics”, Vol. 69, No. 2,
pp. 149-162.
_________, Roush, P. & Thorne, L.
(2008) “An Empirical Investiga-
tion of the Relationship of Corpo-
rate Social Responsibility and Ex-
ecutive Compensation: U.S. ver-
sus Canada”, Working Paper.
McGuire, J.B., Schneeweis, T. &
Branch, B. (1990) “Perceptions
of Firm Quality: A Cause or Re-
sult of Firm Performance”, Jour-
nal of Management, Vol. 16, No.
1, pp. 167-180.
__________, ________ & Sundgren, A.
(1988) “Corporate Social Respon-
sibility and Firm Financial Per-
formance”, Academy of Manage-
ment Journal, Vol. 31, No. 4, pp.
854-872.
__________, Dow, S. & Argheyd, K.
(2003) “CEO Incentives and Cor-
porate Social Performance”, Jour-
nal of Business Ethics, Vol. 45,
pp. 341-359.
Moore, G. (2001) “Corporate Social and
Financial Performance: An Inves-
tigation in the UK Supermarket
Industry”, Journal of Business
Ethics, Vol. 34, No. 3/4, pp. 299-
315.
Murphy, E. (2002) “Best Corporate Citi-
zens Have Better Financial Per-
formance”, Strategic Finance,
Vol. 83, No. 7, pp. 20-21.
Orlitzky, M. (2008) “Corporate Social
Performance and Financial per-
formance: A Research Synthesis”
In A. Crane, A. McWilliams, D.
Matten, J. Moon & D. Siegel
(Eds.), The Oxford Handbook of
CSR (pp. 113-134). Oxford, UK:
Oxford University Press.
_________, & Benjamin, J.D. (2001)
26. L. Mahoney, W. LaGore, J. A. Scazzaro / Issues in Social and Environmental Accounting 1 (2008) 104-130 129
“Corporate Social Performance
and Firm Risk: A Meta-Analytic
Review”, Business and Society,
Vol. 40, No. 4, pp. 369-396.
_________, & Swanson, D.L. (2008)
Toward integrative corporate citi-
zenship: Research advances in
corporate social performance.
London: Palgrave Macmillan.
Palmrose, Z., Richardson, V. & Scholz,
S. (2004) “Determinants of Mar-
ket Reactions to Restatement An-
nouncements”, Journal of Ac-
counting and Economics, Vol. 37,
No. 1, pp. 59-89.
_________ & Scholz, S. (2004) “The
Circumstances and Legal Conse-
quences of non-GAAP Reporting:
Evidence from Restatements”,
Contemporary Accounting Re-
search, Vol. 21, No. 1, pp. 139-
180.
Patten, D.M. (2002) “The Relation be-
tween Environmental Perform-
ance and Environmental Disclo-
sure: A Research Note”, Account-
ing Organizations and Society,
Vol. 27, No. 8, pp. 763.
Porter, M. E., & Kramer, M.R. (2006)
“Strategy and Society: The Link
between Competitive Advantage
and Corporate Social Responsibil-
ity”, Harvard Business Review,
Vol. 84, No. 12, pp. 78-92.
Preston, L.E. & O’Bannon, D.P. (1997)
“The Corporate Social-Financial
Performance Relationship”, Busi-
ness and Society, Vol. 36, No. 4,
No. 419-429.
Roberts, R.W. (1992) “Determinants of
Corporate Social Responsibility
Disclosure: An Application of
Stakeholder Theory”, Accounting,
Organizations & Society, Vol. 17,
No. 6, pp. 595-612.
Roman, R.M., Hayibor, S. & Agle, B.R.
(1999) “The Relationship between
Social and Financial Perform-
ance”, Business and Society, Vol.
38, No. 1, pp. 109-125.
Ruf, B.M., Muralidhar, K., Brown,
R.M., Janney, J.J. & Paul, K.
(2001) “An Empirical Investiga-
tion of the Relationship between
Change in Corporate Social Per-
formance and Financial Perform-
ance: A Stakeholder Theory Per-
spective”, Journal of Business
Ethics, Vol. 32, No. 2, pp. 143-
156.
Sengupta, P. (1998) “Corporate Disclo-
sure Quality and the Cost of Debt.
The Accounting Review, Vol. 73,
No. 4, pp. 459-474.
Shane, P.B. & Spicer, B.H. (1983)
“Market Response to Environ-
mental Information Produced Out-
side the Firm”, The Accounting
Review, Vol. 58, No. 3, pp. 521-
536.
Silverstein, K. (1994) “Pension Funds
Increase Presence in Board-
rooms”, Pension World, Vol. 30,
No. 5, pp. 4.
Simpson, W.G. & Kohers, T. (2002)
“The Link between Corporate So-
cial and Financial Performance:
Evidence from the Banking Indus-
try”, Journal of Business Ethics,
Vol. 35, No. 2, pp. 97-109.
Srinivasan, S. (2005) “Consequences of
Financial Reporting Failure for
Outside Directors: Evidence from
Accounting Restatements and Au-
dit Committee Members” Journal
of Accounting Research, Vol. 43,
No. 2, pp. 291-334.
Turban, D.B. & Greening, D.W. (1997)
“Corporate Social Performance
and Organizational Attractiveness
to Prospective Employees”, Acad-
emy of Management Journal, Vol.
27. 130 L. Mahoney, W. LaGore, J. A. Scazzaro / Issues in Social and Environmental Accounting 1 (2008) 104-130
40, No. 3, pp. 658-672.
Ullman, A. (1985) “Data in Search of a
Theory: A Critical Examination
of the Relationships among Social
Performance, Social Disclosure,
and Economic Performance of
U.S. Firms”, Academy of Manage-
ment Review, Vol. 10, No. 3, pp.
540-557.
Uzumeri, M. V. (1997) “ISO 9000 and
Other Metastandards: Principles
for Management Practice”, Acad-
emy of Management Executives,
Vol. 11, No. 1, pp. 21-36.
Waddock, S.A. & Graves, S.B. (1995)
“Attraction or Repulsion: How
Institutional Owners React to Cor-
porate Social Performance”, Man-
agement Research News, Vol. 18,
No. 2, pp. 20-24.
________ & ______ (1997) “The Cor-
porate Social Performance-
Financial Performance Link”,
Strategic Management Journal,
Vol. 18, No. 4, pp. 303-319.
Wallage, P. (2000) “Assurance on Sus-
tainability Reporting: An Audi-
tor’s View”, Auditing: A Journal
of Practice and Theory, Vol. 19
(Supplement), pp. 53-65.
Watts, R. (2003) “Conservatism in Ac-
counting Part I: Explanations and
Implications”, Accounting Hori-
zons, Vol. 17, No. 3, pp. 207-221.
Wokutch, R.E. & Spencer, B.A. (1987)
“Corporate Saints and Sinners:
The Effects of Philanthropic and
Illegal Activity on Organizational
Performance”, California Man-
agement Review, Vol. 29, No. 2,
pp. 62-78.
Worrell, D.L., Davidson III, W.N., &
Sharma, V.M. (1991) “Layoff
Announcements and Stockholder
Wealth”, Academy of Manage-
ment Journal, Vol. 34, No. 3, pp.
662-678.
28. International Journals Call for Paper
The IISTE, a U.S. publisher, is currently hosting the academic journals listed below. The peer review process of the following journals
usually takes LESS THAN 14 business days and IISTE usually publishes a qualified article within 30 days. Authors should
send their full paper to the following email address. More information can be found in the IISTE website : www.iiste.org
Business, Economics, Finance and Management PAPER SUBMISSION EMAIL
European Journal of Business and Management EJBM@iiste.org
Research Journal of Finance and Accounting RJFA@iiste.org
Journal of Economics and Sustainable Development JESD@iiste.org
Information and Knowledge Management IKM@iiste.org
Developing Country Studies DCS@iiste.org
Industrial Engineering Letters IEL@iiste.org
Physical Sciences, Mathematics and Chemistry PAPER SUBMISSION EMAIL
Journal of Natural Sciences Research JNSR@iiste.org
Chemistry and Materials Research CMR@iiste.org
Mathematical Theory and Modeling MTM@iiste.org
Advances in Physics Theories and Applications APTA@iiste.org
Chemical and Process Engineering Research CPER@iiste.org
Engineering, Technology and Systems PAPER SUBMISSION EMAIL
Computer Engineering and Intelligent Systems CEIS@iiste.org
Innovative Systems Design and Engineering ISDE@iiste.org
Journal of Energy Technologies and Policy JETP@iiste.org
Information and Knowledge Management IKM@iiste.org
Control Theory and Informatics CTI@iiste.org
Journal of Information Engineering and Applications JIEA@iiste.org
Industrial Engineering Letters IEL@iiste.org
Network and Complex Systems NCS@iiste.org
Environment, Civil, Materials Sciences PAPER SUBMISSION EMAIL
Journal of Environment and Earth Science JEES@iiste.org
Civil and Environmental Research CER@iiste.org
Journal of Natural Sciences Research JNSR@iiste.org
Civil and Environmental Research CER@iiste.org
Life Science, Food and Medical Sciences PAPER SUBMISSION EMAIL
Journal of Natural Sciences Research JNSR@iiste.org
Journal of Biology, Agriculture and Healthcare JBAH@iiste.org
Food Science and Quality Management FSQM@iiste.org
Chemistry and Materials Research CMR@iiste.org
Education, and other Social Sciences PAPER SUBMISSION EMAIL
Journal of Education and Practice JEP@iiste.org
Journal of Law, Policy and Globalization JLPG@iiste.org
New Media and Mass Communication NMMC@iiste.org
Journal of Energy Technologies and Policy JETP@iiste.org
Historical Research Letter HRL@iiste.org
Public Policy and Administration Research PPAR@iiste.org
International Affairs and Global Strategy IAGS@iiste.org
Research on Humanities and Social Sciences RHSS@iiste.org
Developing Country Studies DCS@iiste.org
Arts and Design Studies ADS@iiste.org
Global knowledge sharing:
EBSCO, Index Copernicus, Ulrich's
Periodicals Directory, JournalTOCS, PKP
Open Archives Harvester, Bielefeld
Academic Search Engine, Elektronische
Zeitschriftenbibliothek EZB, Open J-Gate,
OCLC WorldCat, Universe Digtial Library ,
NewJour, Google Scholar.
IISTE is member of CrossRef. All journals
have high IC Impact Factor Values (ICV).