Demand response for caborhydrate and food insecurity dynamics in imo state, nigeria
•
1 j'aime•333 vues

International peer-reviewed academic journals call for papers, http://www.iiste.org

Recommandé
Recommandé
Contenu connexe
Tendances
Tendances (20)
En vedette
En vedette (7)
Similaire à Demand response for caborhydrate and food insecurity dynamics in imo state, nigeria
Similaire à Demand response for caborhydrate and food insecurity dynamics in imo state, nigeria (20)
Plus de Alexander Decker
Plus de Alexander Decker (20)
Dernier
Dernier (20)
Demand response for caborhydrate and food insecurity dynamics in imo state, nigeria
- 1. Journal of Economics and Sustainable Development ISSN 2222-1700 (Paper) ISSN 2222-2855 (Online) Vol.4, No.15, 2013 www.iiste.org Demand Response for Caborhydrate and Food Insecurity Dynamics in Imo State, Nigeria *Ehirim, N C.1, U. S. Okoro2 , M.A.C.A. Odii1, S.C. Onyemauwa1, and E. O. Okoli1 1.Department of Agricultural Economics, Federal University of Technology Owerri, Imo State 2.Department of Agricultural Economics, Akwa Ibom State University. *Corresponding author: ehinadykus@yahoo.com Abstract Demand for cabohydrate food stuffs responds its accesibility and unsteady price regime, thus food insecurity dynamics in Imo State. The study investigated a cheap and steady market demand for carbohydate foodstuffs in the state using 50 weekly observations on mean own prices, quantities demanded of both gari and rice as substitute from the management of Owerri Market Traders Assocition (OMATA) between January to December 2012. Data were analysed using simple decriptive statistics, charts and econometric tools. In general terms gari had a normal demand behaviour between June and August but abnonormal during festival periods. All the Error correction vectors -0.0545, -0.444 and -0.425 for Ekeonunwa, Relief and Ihiagwa demand models respectively were statistically significant ( = 0.05). Therefore, the speed of adjustment of lagged prices to long-run actual demand were completed in the next period, hence food insecurity flunctuates. Lagged own price of gari is negative and inelastic in all the models except that of Ihiagwa market (1.277). Gari is thus a normal goods in all the markets but has a more than 0.28% proportionate increase in demand with a unit decrease in its own price in Ihiagwa market. Therefore, food security will be achieved if there is a more effort to reduce the price of gari in Ihiagwa market. Rice is better subtitute to gari in Relief than the rest of the markets, hence increase in supply of rice in Relief market is imperative for food security in the area. The study therefore, recommends a steady reduced price conditions in both Relief and Ihiagwa markets for rice and gari respectively to ensure increased returns and supply for sellers and steady food security in the state. Keywords: Demand, Response, Food Security, Carbohydrate, Markets and Error Correction Vector 1. Introdution Food is a basic human need that contains some nutrients needed for body building and healthy living therefore, its adequate demand and utilization is imperative (USAID, 1992). Food nutrients provide the body with energy, body tissue and other things that the body requires for healthy living. Nutrients in food fall into three major classes: proteins, fats, and carbohydrates. Carbohydrate (the largest in proportion) is a common source of energy that occurs in two main forms of sugars (such as fructose, glucose, and lactose) and starches. Starch, a major nutrient consumed in Nigeria is derived mainly from cereals and tubers (Ogundele, and Okoruwa, 2006). The body is capable of breaking down the starch (or converts) into the sugar glucose, which later finds its way into the bloodstream and later to body cells, which are late catabolized to released energy body activities. The persistent rise in the price of food especially carbohydrates has been fingered to cause households’ food demand instability in Nigeria. Price of foods increased dramatically from 2005 following a limited global food reserve and amplified demand (FAO, 2008). Removal of some import prohibition and input subsidy to improve domestic food production and supply as well as export during the era of Structural Adjustment Programme (SAP) seemed to a way out but for the sever economic pressure on supply of cabohydrate following the ban on rice. Mkpado and Arene (2012) opined that the economic pressure is more severe when the people prefer imported goods to domestic ones. Hence, foreign policy becomes exogeneous to the responsiveness of food demand to food prices and security in Nigeria Arene and Mkpado (2004). Food security is a fundamental objective of development policy and achieving it is still a major problem for households in most rural areas of Nigeria. Many different definitions have tried to detail food security. World Bank (1986), defined it as an access by all people at all times to afford sufficient food for an active and healthy life while FAO (1986) sees it as the physical and economic access to adequate food for all household members. Food can be available with little access or affordability by the people. International Conference on Nutrition (ICN) stated that food security is a state of affairs where all people at all times have access to safe and nutritious food to maintain a healthy and active life. This is further butressed by Life Sciences Research to include the availability and affordability of nutritionally adequate and safe foods in socially acceptable ways without resorting to emergency food supplies, scavenging, stealing or other coping strategies. In short, adequate household demand guarantees food security because it adequatly affords the households with food needed meet the body’s needs. Increasing population has put a challange to carbohydrate demand. Achike (2004) noted that the rapid growth of Nigerian’s population at the rate of 3 percent per annum with sluggish food growth rate at 1.0 percent 143
- 2. Journal of Economics and Sustainable Development ISSN 2222-1700 (Paper) ISSN 2222-2855 (Online) Vol.4, No.15, 2013 www.iiste.org per annum is a serious threat to food insecurity and expanded competetion on available food. There is a drastic increase in carbohydrate food prices as the prefrence for either rice or gari (a dry granullar product from cassava root) depends not only on the its own price but also on the price of the subtitutes (Olukosi, 2005; Chinemelu, 1991). The two products are substitues to each other becuse they are common edible carbohydrates Chinemelu, 1991). It has been noted also that adequate demand for carbohydrate foodstuffs has slipped into a system decline in Imo State, particularly with the flunctuations in demand and concomitant shortage in energy supply to the body, the unhealthy competetion that surrunds the foodstuffs or a shift to other food sources with a pesistent rise in prices. The need to condition household food security in the state through achieving a long run dynamic equlibrium demand for carbohydrate foodstuffs has instigated this study. Information on the distability in demand of carbohydrate caused by the cyclical movement in prices of different carbohydrates foodstuffs is totally lacking, hence the need for this study. The study is centered on the analysis of demand responsiveness of households to slight changes in unit prices of cardohydrates. The foodstuff sellers benefits from this study as they can supply the actual quantity that brings a steady price and at any point in time in the market and creates a sense of direction for a steady state of demand of the products. The study tested the null hypothesis that there is no significant changes in both quantity demanded and prices of the foodstuffs in the state. 2. Methodology 2.1 Study Area The study was done in Imo State, which lies within latitudes 4°45'N and 7°15'N, and longitude 6°50'E and 7°25'E with a total area of 5,100 sq km. The state is bordered by Abia State to the East, River Niger and Delta State to the west, Anambra State to the north and Rivers State to the south. The area has an annual rainfall range of 1,500mm-2,200mm, with average annual temperature and relative humidity of 23 °C and 75% respectively. The state has three agricultural zones; Owerri, Orlu and Okigwe zones. Owerri zone was purposively selected for this study because of its well established food markets and availability of data with their managements. Sample for the study was drawn from some markets in the zone; Eke-Onunwa in Owerri Municipal, Relief Market in Owerri North and Ihiagwa Market in Owerri West. 2.2 Sample Selection and Sampling Techniques The sample comprises of time series data from record office of Owerri Market Traders Assocition (OMATA). The choice of the two common carbohydrate foodstuffs in this study was due to their wide range of consumption as staple foods by many households in Nigeria (Wudiri and Fatoba, 1992) and their behaviour as substitute to each other. The data include 50 weekly observations generated between January to December 2012 on weekly unit own prices and quantities demanded of both gari and rice from consumers selected at random from different sellers in the market. 2.3 Analytical Procedures Data were analysed using decriptives and econometric tools. The percentage change in monthly prices and quantities were described using relative frequency and graphs. Again, the effect of own price and priceses of subtitutes of gari on quantity demanded of gari were estimated using ordinary least square regression analysis and error correction mechanism (ECM). The actual quantity of gari demanded from the three market, lagged own prices and lagged prices of their substitutes are all time series data, which were fitted into a Cob-Dauglas model. The choice of the model is based on its simplicity as their parameters are themselves elasticities (Oguoma et.al., 2010 and Ehirim et. al., 2010). The model is expressed thus: = ln + (1) (# ) !" + $ ( ) !" + # Where; Mean weekly quantity demanded of the gari in jth market (in kilogramme) ( ) !" is the mean lagged unit weekly price of gari in jth market (in naira). (# ) !" is the mean lagged unit weekly price of substitute (rice) in jth market (in naira). & is the stochastic error variable of ith demand model of jth market. Estimation and or predictions from series of this nature without accounting for its stationarity may lead to a spurious estimation (Newbold and Granger, 1974; Olayemi and Onyenweaku, 1998; Omonona et al., 2004 and Ehirim et. al., 2007). Ther is a stochastic process or random walk of the series that may make them nonstationary (Olayemi, 1998), thus subjecting such series to a technical relatonship at their level gives a spurious estimates with misleading predictions. The procedure for making such series exhibit suitable dynamic properties include determining the order of integration of the series through stationarity test on each of them with Augumented Dicker-Fuller (ADF) test (Engle and Granger, 1981). This is otherwise called a unit root test and a series becomes stationary when at a certain level of differencing, it is invariant with respect to time (Omotor, 2006 and Ehirim et al., 2007). The series have a constant variance and mean and cannot display any random walk with time at that level of differencing. All the included variables are expected to be stationary at the same 144
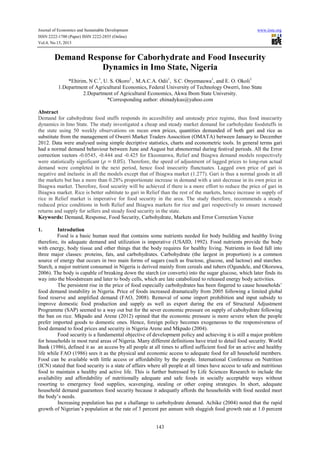
- 3. Journal of Economics and Sustainable Development ISSN 2222-1700 (Paper) ISSN 2222-2855 (Online) Vol.4, No.15, 2013 www.iiste.org level defferencing befor a technical relationship is established using ordinary least square regression (OLS) (Newbold and Granger, 1974). However, there is a problem if a process ( = '" !" + … + ') !) + * + + ), with deterministic term vt, has a unit root and is hence integrated at a particular level of differencing if ' (1) = 1 − '" − … − ') = 0. The objective includes to test this null hypothesis of no stationary process against the alternative of stationary process (ie ' (1) > 0 ). For this purpose the model with. ∆ = 0 )!" !" + 12 ∆ 3" !" + * + + (2) 0 = − ' (1) and 2 = −5' 6" + ⋯ + ') 8 with the ADF test as noted by Fuller (1976) Dickey-Fuller (1979) on a pair of hypothesis 9 :0=0 9" ∶ 0 < 0 will be based on the t-statistics on the coefficient 0 from an OLS estimation. This followed by a cointegration modelling using Johanson test. Cointegration is a concept for modelling equilibrium or long-run relations of economic variables (Johanson, 1988). Establishing a long-run demand response of carbohydrate foodstuff is built around investigation of the number of cointegration relations, estimate their parameters and place appropraite restrictions. This is finally follwed by designing the complete model (in equation 1.0), assess the quality of the model by adjusting the error mechanism for further investigation and or prediction. 3 3.1 Result and Discussion Market Demand Structure of Carbohydrates in Imo State The market demand curve for gari in Fig. 1, showed that the demand gari inceased with price at the begining of the year (January to March) before the cluster in April. This is because of the bulk buying at the begining of the year due to the numerous festiviies within that period. The positivly sloping demand curve within that period was due to consumers response to price changes affected by festivities. This abnormal market demand curves may not follow to the end of the yearas as the price of gari gradually dropped to N35/Kg in August from N82.89/Kg in June with a rise in demand to 197.51Kg/Household from 172.22Kg/Household within the same period. This inverse relationship with price later continued to September before it responded positively again to the price. The fall in price within the mid part of the year was probably due to the market glut from excess production and supply of gari during cassava harvest. Households usually take advantage of this low price regime to make bulk purchases against the recession that may set in later October. This price drop accompanied with high purchases returned the market demand to a normal behaviour but was short-lived due to the perishability of the raw materials and lack of storage facilities to take up the market surplus. Hence the product quickly changes its normal behaviour to an abnomal type. 90 80 Mean Monthly price 70 60 50 40 30 20 10 0 0 50 100 150 200 250 Monthly Market price of Gari (Kg) Fig 1. Mean Monthly Market Demand for Gari in Imo State. Contrastingly, the demand curve of rice in Fig 2., behaved abnormally through out the year. Increase in price from N134.98 to N152.83 resulted to an increase in demand 15.94Kg/household to 30.89Kg/household between 145
- 4. Journal of Economics and Sustainable Development ISSN 2222-1700 (Paper) ISSN 2222-2855 (Online) Vol.4, No.15, 2013 www.iiste.org March and April respectively and droped slightly again to 26.9 Kg/household with a decrease in unit monthly price of N140.30 in May. In the same way, between Novemebr and December, the unit price and quantity of rice demanded increased from from N173.47 to N174.41 and 40.69Kg/household to 45.73Kg/household respectively. Such abnomal demand behaviour could be due to foreign influence or exchange rate effect on domestic price of rice Average Monthly Price of Gari (N) Market demand 50 45 40 35 30 25 20 15 10 5 0 0 50 100 150 200 Mean Monthly demand for Rice (Kg) Fig 2. Mean Monthly Market Demand for Rice in Imo State. This finding showed that despite the price varitions in both gari and rice, affodability of the products is quite high apparently during festival since an increse in price the households can still afford higher quantities of these products in the area. However, consumers showed that more gari is affordable when the price dropped to the minimum in August therefoer gari may behave like a normal goods than rice within the year. Table 1. showed demand and price flunctuations of gari and rice as well as their percentage changes. It could be deduced from the result that though there is a positive change in demand for the product during festive period in April (86.9%), November (121.2%) and December (147.0%), it is still relatively higher in other months in Ekeonunwa than what is experienced in Relief and Ihiagwa markets. The percentage change in demand for rice dropped to -88.2% and -81.1% in Ihiagwa and Relief markets in the month of August, when it is as as high as 50.4% in Ekeonuwa market within the same period. Relief and Ihiagwa markets showed better perfomance in gari market in terms of changes in quantities bought and prices. 3.2 Determinants of Carbohydrate Demand Response and Error Correction Mechanism • Unit Root Test on the Series The unit root test on Table 2. showed that at their level, lagged owned prices of gari are stationary at their level 1(0) in all the market while lagged prices of the subtittute (ie rice) are not statioanry in all the markets except Ihiagwa market. The same result but in all the market is recorded with lagged quantity demanded of gari. At first difference 1(1) however, all the series in the three markets were stationary except the lagged prices of the substitutes in Ekeonunwa and Ihiagwa market. The series were all stationary at the second difference 1(2). This showed the level when the series do not have any random walk but displayed unit root and hence, integrated at this level. • The Cointegration Test The result of Johanson cointegration test in Table 3 showed that there are different cointegrating vectors with series in the individual markets. In Ekeonunwa for instance, there are two cointegrating vectors as the trace statistics of 4.985 grater than the critical value ( = 0.05) of 3.341. The altenative hypothesis at ( = 2) was accepted. This implies that model will converge at equilibrium in the long run equilibrium. In Relief market, it appears that only one cointegrating vector with the trace statistics of 15.820 greater than a critical value ( = 0.05) of 15.495 as shown in the table below. Hence, the alternative hypothesis was accepted as the null was rejected. The fact that at least one cointegrating equation is established implies that the short run dynamics of the demand model from that market must converge. The same result is obtained with Ihiagwa market with only one cointegrating equation. The establisment of at least one cointegrating equation from each of the market implies that the non stationarity due to unit root can be brought back to stationarity by linear trasnsformation. Hence the short run dynamics of the series can converge at equilibium and the speed of converging will be adjusted using the error correction mechanism. 146
- 5. Journal of Economics and Sustainable Development ISSN 2222-1700 (Paper) ISSN 2222-2855 (Online) Vol.4, No.15, 2013 www.iiste.org 3.3 Carbohydrate Foodstuff Demand Responsiveness to Own and Substitutes Prices The ECM values of -0.0545, -0.444 and -0.425 are all negative and statistically significant ( = 0.05) in Ekeonunwa, Relief and Ihiagwa Markets respectively. This means that the speed of short-run lagged prices adjustment of 5.45% will be completed in the next period. Again, the co-efficienct of multiple determination of 0.553, 0.648 and 0.497 were obtained from Ekeonunwa, Relief and Ihiagwa demand models respectively. This also means that variations in actual demand for carbohydrate food stuff (gari) can be accounted for by variations in lagged own price and price of its substitutes in Ekeonunwa market. It can be deduced from the model that there is a normal demand behaviour for gari in Ekeonunwa Market going by the negative sign of its lagged own price but an inelastic complementry behaviour with its substitute (rice). A previous week increase in the price of gari will lead to a fall in actual quantity of gari demanded the preceeding week. An interesting outcome of this result is the inelastic nature of this commodity as the value of lagged own price less than unity (1). Table 1. Monthly Changes in Quantity Demanded and Prices of Carbohydrate Foodstuff in Some Markets in Imo State Market Variables Ekeonuwa Market Price of Gari (N) % Change Qtydd of Gari (kg) % Change Price of Rice (N) % Change Qtydd of Rice (kg) % Change Price of Gari (N) % Change Qtydd of Gari (kg) % Change Price of Rice (N) % Change Qtydd of Rice (kg) % Change Price of Gari (N) % Change Qtydd of Gari (kg) % Change Price of Rice (N) % Change Qtydd of Rice (kg) % Change (N) Kg Relief Market Ihiagwa Market Grand Mean Price & Qtydd of Gari Grand Mean Price & Qtydd of Rice Months Jan 67.30 (0) Feb 60.14 (-10.6) 145.3 144.08 (-0.8) 27.16 32.30 (18.9) 69.10 61.19 (-11.4) 156.33 158.67 21.01 166.67 (6.6) 141.09 (-11.1) 4.53 (-78.4) 66.78 52.40 (-21.5) 170.70 166.71 (-2.3) 160.00 141.78 (-11.4) 18.66 1.80 (-90.4) 67.73 142.75 Sept 56.70 (-15.8) Oct 58.78 (-12.7) Nov 70.56 (4.8) Dec 72.44 (7.6) 149.99 (50.0) 166.60 (66.6) 136.11 (36.1) 159.22 (59.2) 164.36 (64.4) 133.38 (-8.2) 147.62 (1.6) 147.81 (1.7) 148.12 (1.9) 152.01 (4.6) 166.30 (14.5) 169.20 (16.4) 40.05 (47.5) 38.15 (36.8) 40.02 (47.3) 40.84 (50.4) 43.28 (59.4) 49.42 (82.0) 60.07 (121.2) 67.08 (147.0) 69.55 (0.7) 72.37 (4.7) 76.32 (10.4) 83.59 (21.0) 34.32 (-50.3) 50.12 (-27.5) 53.23 (-23.0) 65.82 (-4.7) 70.10 (1.4) 168.14 (7.6) 176.43 (12.9) 184.47 (18.28) 180.91 (15.7) 189.79 (21.4) 171.76 (9.9) 170.18 (8.9) 175.24 (12.1) 179.69 (14.9) 154.34 (-2.7) 151.14 (-4.7) 148.89 (-6.2) 149.37 (-5.8) 153.29 (3.4) 158.54 (-0.08) 162.34 (2.3) 177.12 (1.8) 179.8 (13.3) 22.89 (8.9) 20.35 (-3.1) 13.7 (-34.8) 8.30 (-60.5) 4.06 (-81.1) 8.95 (-57.4) 33.34 (58.7) 37.31 (77.6) 78.24 (17.2) 75.38 (12.9) 67.80 (-6.6) 57.89 (-13.3) 33.78 (49.4) 6.08 (71.06) 59.00 (11.7) 69.91 (4.7) 79.42 (18.9) 71.05 (6.4) 220.00 (28.9) 220.80 (29.3) 183.30 (7.4) 176.70 (3.5) 225.00 (31.8) 233.30 (36.5) 178.12 (4.3) 170.30 (-0.2) 171.60 (0.5) 173.30 (1.5) 151.45 (-5.3) 149.91 (-6.3) 155.75 (-2.7) 147.20 (-8.0) 152.58 (4.6) 153.30 (4.2) 158.70 (-0.8) 163.00 (1.9) 177.00 (10.6) 180.90 (13.1) 2.02 (-89.2) 19.00 (1.8) 19.80 (6.1) 12.50 (-33.0) 10.31 (44.7) 2.21 (-88.2) 13.87 (-25.7) 15.89 (-14.8) 28.67 (53.6) 32.81 (75.8) 76.14 171.78 77.31 166.58 82.89 172.22 79.92 185.3 35.00 197.51 55.27 172.16 60.64 158.86 71.93 168.69 71.20 172.45 134.98 15.94 77.77 (-23.2) Aug 36.83 (45.27) 169.45 (69.45) 78.45 170.81 101.21 March 94.81 (40.8) April 80.68 (19.8) May 84.19 (25.09) June 97.60 (45.0) July 98.28 (46.5) 119.43 (18.0) 126.39 (24.9) 139.72 (39.7) 148.89 (48.9) 128.62 (-11.5) 154.42 (6.3) 114.03 (-21.5) 39.92 (47.0) 50.77 (86.9) 67.54 (-2.3) 173.0 (10.7) 152.89 30.89 140.30 26.73 143.16 21.45 149.86 19.54 151.47 15.70 155.12 21.08 113.45 24.75 173.47 40.69 174.44 45.73 124.87 (-21.3) 5.90 (-71.6) 73.01 (9.3) 57.91 137.05 (N) Kg 154.66 22.28 142.32 12.87 Souce: Computer Printout 2012; Note: The percentage changes in unit monthly prices and quantity demanded per housed are in paranthesis The inelastic nature of gari in the area suggest that increase in its lagged own price by 1% will give a less than 0.626% reduction in actual quantity of gari demanded. This implies that consumers in Ekeonunwa markets show a less than proportion interest in the quantity demanded of gari with to increased lagged own price in the market. ∗ ∗∗ ∗∗ = 0.035 − 0.626 (3) = > ?@ (#) !" DEF = −0.0545 ( ) !" − 0.535 I J = 0.631, (0.037) (0.226) KLM IJ = 0.553, 147 NO ( 0.303) (0.0247) P QP lagged = 8.718∗∗∗ Again, price of
- 6. Journal of Economics and Sustainable Development ISSN 2222-1700 (Paper) ISSN 2222-2855 (Online) Vol.4, No.15, 2013 www.iiste.org subtitute (rice) of gari is also negative and inelastic as the value is less than unity. This showed that a lagged increase in price of gari will reduce the actual quantity demanded of rice in the market. This implies that buyers of carbohydrate foodstuff in Ekeonunwa market may have rice and gari as complements rather than substitutes. The need to overcome food insecurity in the area may be deafeted with these increased lagged own price and price of substitute that can lead to a fall in actual quantity demanded of gari from the market. This finding revealed two things. Ekeonunwa market appears to be large market with some varieties of carbohydrate food stuffs that can act better and cheaper substitute to gari other than rice. Again consumers can shop for for cheaper gari within the area apart from Ekeonunwa market to meet up with household food security demand. In Relief market, the dynamic market behaviour is the the same but with a sluggish speed of adjustment of 44.4% as shown by the ECM value. Again, about 64.8% variations in actual quantity of gari demanded will be explained by the lagged own price and price of its subtitute (rice). Just as it is in Ekeonunwa market, lagged own price is nagative and inelastic but differs with the sign of gari substitute. Increase in previous week’s price of gari therefore, can lead to a less than proportionate decline in actual quantity demanded of gari though might increase the demand with a rise in lagged price of the substitute. This implies that gari is a normal goods with rice as a its close substitutes to it in that market. ∗∗∗ ∗∗∗ ∗∗ = 0.013 − 0.416 (4) # S T (#) !" DEF = −0.444 ( ) !" + 0.176 (0.015) (0.131) ( 0.055) (0.180) KLM IJ = 0.648, NO P QP = 11.602∗∗∗ I J = 0.710, This contrasting demand response behaviour in the two markets (Ekeonunwa and Relief) suggest a slight different roles by the markets in galvanizing food insecurity in the area. Ekeonunwa appeared to have a faster speed of short-run adjustement with varieties of better carbohydrate food stuff as substitute to gari than Relief. Relief market has rice as a better substitute for gari though the speed of adjustment is sluggish Implying that rice may be cheaper in that market. This could be due to the strategic location of the market rhat makes it comand prices and larger market control than other markets in the area.. Ihiagwa showed the same dynamic demand behaviour with Relief in carbohydrate food stuff market. The speed of short-run adjusment of 0.425 is also sluggish as 42.5% adjusment in the lagged prices of gari and its subtitutes will be made in the following week. The model showed that lagged own price of gari and that of its subtitute (rice) have about 49.7% variation in actual demand for gari in the market. Lagged own price is negative but greater than unity (1) while that of the substitute is still negative but inelastic. Hence, gari is a normal goods with elastic demand behaviour in the very shor-run in the market while rice is rather complementry. ∗∗∗ ∗∗ ∗∗ = −0.0008 − 1.277 (5) U V@ (#) !" DEF = −0.425 ( ) !" − 0.475 (0.03) (0.548) ( 0.145) (0.170) I J = 0.562, KLM IJ = 0.497, NO P QP = 8.571∗∗∗ This demand behaviour suggest that a fall in price of gari will lead to a more than proportionate increase in its demand while a rise in price of its substitute will lead to less than proportionate decrease in its demand in the market. Ihiagwa is a local feeder market that supplies gari to the rest of the market, hence consumers take advantage of it large supply and cheaper pries to expand purchases of gari. This market therefore play a significant role in food security of the area as it can supply gari at a cheaper rate than the rest of the market. The behaviour may not be the same with rice as increase in priice of gari cannot shift the demand to rice. 4 Conclusion and Recommendations Cabohydrate demand response is contibuting to food insecurity in the state. Lagged own price and price of substitutes differential with accebility to the products and its substitute were major stimuli to demand dynamics, hence measures controlling food insecurity. The two local markets showed a sluggished speed of shor-run adjusment than the market in the municipal suggesting that but can complete there adjusment within the next week. Previous week pirce of gari is found to be negative and inelastic in all the markets except the local feeder market (Ihiagwa) were it is elastic while lagged price of substitute is through out inelastic in all the market but has a complementary behaviour in both Ekeonunwa and Ihiagwa market. Gari has a normal demand behaviour in all the markets but has rice as a close subtitute in Relief market alone. It may play a complement in Ihiagwa and Ekeonunwa markets. Demand response for gari in the area can solve food security if the demand continues to respond to own price in Ihiagwa and price of substitutes in Relief markets. References Achike, A.I. (2004). Macro-economic Picture of Nigerian Agriculture: Strategic Analysis of Development Constraints and Priorities in Southern Nigeria. Updates on Agriculture and conflict July, USAID Mission Abuja Pp. 3-14 148
- 7. Journal of Economics and Sustainable Development ISSN 2222-1700 (Paper) ISSN 2222-2855 (Online) Vol.4, No.15, 2013 www.iiste.org Arene, C.J., & Mkpado, M. (2004). Counter Urbanization and Agricultural Production in Nigeria Journal of Rural Development. 23(1): 73-81. Chinemelu, C.A. (1991). Macro-Economic Analysis. Douglas Press Owerri, Nigeria limited Ehirim NC, M.A.Y. Rahji and P.M. Deustop-Nguezet (2007). Determinants of Groundnuts Supply in Nigeria 1960-2003, An Error Correction Model Approach. International journal of Agriculture and Rural Development, Vol 10, No.1, pp. 46-52. Engle, R.F. and C.W.J. Granger (1987). Co-integration and Error Correction Representation, Estimating and Testing. Econometrics, Vol. 55, pp. 251-276. Food and Agricultural Organization, (2008). An Opportunity for Smallholders in Low-income, AgriculturalBased Countries? Paper prepared for the Round Table organized during the Thirty-first session of IFAD's Governing Council, 14 February 2008. Food and Agricultural Organization, (1986). Food and Agricultural Statistics in the context of national information system Johanson, S. (1988). Statistical Analysis of Cointegration Vectors. Journal of Economic Dynamics and Control, (12) pp. 231-234 Mkpado, M. and C.J. Arene (2012). Trade Liberalization, Exchange Rate Changes, and the Competitiveness of Carbohydrate Staple Markets in Nigeria International Journal of Agricultural Management & Development (IJAMAD) Available online on: www.ijamad.com ISSN: 2159-5852 Ogundele, O.O., & Okoruwa, O.V. (2006). Technical Efficiency Differentials in Rice Production Technologies in Nigeria. AERC Research paper 154. Oguoma, N. N. O., N. C. Ehirim, G. N. Benchendo, I. Nnadi and E. N. Okoronkwo (2010). Determinants of aggregate household demand for edible oils in Imo State. African Journal of Agricultural Research Vol. 5(15), pp. 1932-1936, Available online at http://www.academicjournals.org/AJAR DOI: 10.5897/AJAR09.081 ISSN 1991-637X Academic Journals Olarinde, L. O. and F. A. Kuponiyi (2005). Rural Livelihood and Food Consumption Patterns Among Households in Oyo State, Nigeria: Implications for Food Security and Poverty Eradication in a Deregulated Economy Department of Agricultural Economics and Extension, Ladoke Akintola University of Technology, Ogbomoso Oyo State, Nigeria. Kama-Raj 2005 J. Soc. Sci., 11(2): 127-132 Olayemi, J.K. (1998). Elements of Applied Econometrics. El’shaddai Global Ventures Ltd Ibadan, Nigeria Pp117-131 Olayemi, J.K. and C.E. Onyenweaku (1999). Quantitative methods for business decisions. Ibadan: Bosude Press Ltd. Olukosi, J.O, S.U. isitor and O.M. Ode (2005). Introduction to Agricultural marketing and Prices, Principle and Application. G.U publishers Abuja Omonona BT, Yusuf SH, Udoh EJ and Ohmourra O. C. (2004). Determinants of output supply Response of selected cereals in Nigeria. Nigerian Journal of Agricultural food And environment vol 1, n0 1 PP 52-62. Omotor D (2006). causally test of the Relationship between savings And economic growth Evidence From Nigeria. Oceanic bank and Business journal Vol 1 issue 1. Newbold, P. and C.W.J. Granger (1974). Experience with forecasting univariate time series and the combination of forecasts, J. R. Statist. Sot. A 137, forthcoming. Reid, D.J., 1969 United State Agency for International Development, (1992). USAID Policy Determination: Definition of Food Security. Microlink- Microenterprise learning Information and Knowledge Sharing World Bank (1986). The Hasitant Recovery and Prospect for Sustained Growth, Trade and Pricing Policy in World Agriculture. World Development Indicators, oxford university Press Wudiri, B.B and I.O. Fatoba (1992). Cereals in Food Economy of Nigeria. In Recent Development in Cereal production in Nigeria (eds) S. Lawani and T. Babalaye (1992). Media Forum for Agriculture, IITA, ibadan. 149
- 8. Journal of Economics and Sustainable Development ISSN 2222-1700 (Paper) ISSN 2222-2855 (Online) Vol.4, No.15, 2013 www.iiste.org Table 2. Unit Root Test Markets Ekeonuwa Relief Market Ihiagwa Market Variables Ln lagged Qty Demanded Ln lagged Price Ln Laged Price of Substitute Ln lagged Qty Demanded Ln lagged Price Ln Laged Price of Substitute Ln lagged Qty Demanded Ln lagged Price Ln laged Price of Substitute Ekeonunwa Market Relief Market Ihiagwa Market Source: 2012 Remark -2.927 -4.979 -3.472 Non Stationary Stationary Non Stationary -5.171 -0.438 -4.758 Stationary Non Stationary Stationary -1.844 -6.354 -4.994 Non Stationary Stationary Stationary Augmented Dickey-Fuller At 1st Remark Diff. -6.278 Stationary -7.551 Stationary -3.781 Non Stationary -7.348 Stationary -6.688 Stationary -5.375 Stationary -9.739 -7.311 -3.346 Stationary Stationary Non Stationary At 2nd Diff. Remark -6.251 -4.184 -6.181 Stationary Stationary Stationary -6.915 -5.784 -4.786 Stationary Stationary Stationary -7.238 -6.004 -5.581 Stationary Stationary Stationary Note that the ADF Critical Value @ = 0.01 under two tailed is -3.878 Source: 2012 Markets At level Null Hypothesis [=0 [ ≤1 [ ≤2 [=0 [ ≤1 [ ≤2 [=0 [ ≤1 [ ≤2 Table 3. Cointegration Test Alt. Eigen Trace Hypothesis Value Statistics 0.530 31.031 [=0 0.250 16.172 [=1 0.181 4.985 [=2 0.631 39.036 [=0 0.447 15.820 [=1 0.019 0.489 [≥2 0.518 33.536 [=0 0.331 15.315 [=1 0.090 5.264 [=2 150 Critical Value (X = Y. YZ) 29.797 15.495 3.341 29.797 15.495 3.841 33.538 15.135 3.341
- 9. This academic article was published by The International Institute for Science, Technology and Education (IISTE). The IISTE is a pioneer in the Open Access Publishing service based in the U.S. and Europe. The aim of the institute is Accelerating Global Knowledge Sharing. More information about the publisher can be found in the IISTE’s homepage: http://www.iiste.org CALL FOR JOURNAL PAPERS The IISTE is currently hosting more than 30 peer-reviewed academic journals and collaborating with academic institutions around the world. There’s no deadline for submission. Prospective authors of IISTE journals can find the submission instruction on the following page: http://www.iiste.org/journals/ The IISTE editorial team promises to the review and publish all the qualified submissions in a fast manner. All the journals articles are available online to the readers all over the world without financial, legal, or technical barriers other than those inseparable from gaining access to the internet itself. Printed version of the journals is also available upon request of readers and authors. MORE RESOURCES Book publication information: http://www.iiste.org/book/ Recent conferences: http://www.iiste.org/conference/ IISTE Knowledge Sharing Partners EBSCO, Index Copernicus, Ulrich's Periodicals Directory, JournalTOCS, PKP Open Archives Harvester, Bielefeld Academic Search Engine, Elektronische Zeitschriftenbibliothek EZB, Open J-Gate, OCLC WorldCat, Universe Digtial Library , NewJour, Google Scholar