SlideShare une entreprise Scribd logo
1  sur  13
Télécharger pour lire hors ligne
Journal of Environment and Earth Science
ISSN 2224-3216 (Paper) ISSN 2225
Vol. 3, No.4, 2013
Impact of contaminants on groundwater quality in Patcham,
Egbuna Chukwuemeka Kingsley
1. Department of Civil Engineering,
2. Department of Geology, University of Brig
* E-mail of the corresponding author:
Abstract
This paper investigated the impact o
groundwater in Patcham, South-East England. Data, obtained from the Campbell scientific weather station
installed in the Patcham catchment and Schlumberger Water Services (SWS), were used to i
mechanism and potential contaminant flow paths through the Chalk unsat
deployed in three boreholes present within the catchment. Laboratory and analytical techniques such as Raman
spectroscopy, Hach Spectrophotometer and YSI Multimeter equipped with Ion selective electrode were used to
investigate the influence of these contaminates on groundwater flow chemistry and quality from the seven
boreholes sites was studied. This research used the data obtained f
the field to analyse and examine the quality trend observing for major environmental pollutants. Results showed
that all the water parameters analysed were within the WHO guideline values, thus indicating that the
this area is quite safe for usage.
Keywords: Contaminants, groundwater, Chalk, water table, water chemistry
1. Introduction
Groundwater is a great natural resource. It is estimated that universally, over 2 billion people depend mainly on
groundwater for their daily need (Chaplin, 2001; Kemper, 2004: Egbuna and Duvbiama, 2013). Majority of the
world’s industries as well as large number of world’s agriculture and irrigation mostly depend on groundwater.
In regions like Tunisia, with prominent dry
agricultural development is widely considered (Ravi
groundwater to life. Groundwater is known to usually have a suitable quality (Nola
Egbuna, 2012) although depending on the hydrological condition it may also be of poor condition.
The Chalk aquifer is an important source of water in North West Europe, particularly in the United Kingdom,
Belgium, North of France and Germany. In south east of England, the Chalk aquifer provides about 40% of all
potable water and about 80% of total water (Pinault
of UK groundwater-abstracted drinking water (Howden
60% of the chalk aquifer recharge are extracted and used as water supply in the UK. However, the sustainability
of groundwater reduces by the day all over the world, problems of depletion due to use without
salinization and pollution or other human activities affects groundwater. In a study by Lunzhang (1994) in the
Henan province of China, results showed a decline of 0.75
monitoring the water table from 358 observation wells in approximately 2million hectares of irrigated lands.
Chalk aquifers are usually karstic in nature, which means that they contain holes otherwise known as swallow
(sink) holes that may allow infiltration of surface pollutants
factors such as increasing population and development, personal water consumption increase, impacts of
pollution (hydrocarbon) and climate change have put the groundwater from the English chalk aquifer under gre
pressure (Edmunds, 2008). Figure 1 shows the outcrop of the UK chalk aquifer
The chalk has proven to be a good aquifer due its porosity and permeability, but the karstic nature of it makes it
quite easy for surface contaminants to infiltrate into the a
in nature, this solubility makes possible the presence of features in a chalk such as solution pipes, swallow holes
and also sink holes. These are surface features that appear as subsidence sinkholes
extend to depths. Studies carried out have confirmed the existence of such features and are characterized by the
dry valley uplands rather than forming surface streams from rainwater (Edmonds, 2008). Thus, this paper aims to
investigate the impact of contaminants on groundwater flow chemistry and the quality of groundwater in the
Patcham Catchment, UK.
2. Study Area
Patcham, the study area is situated in the City of Brighton and Hove, East Sussex, South East England. Patcham
Journal of Environment and Earth Science
3216 (Paper) ISSN 2225-0948 (Online)
55
Impact of contaminants on groundwater quality in Patcham,
South East England.
Egbuna Chukwuemeka Kingsley1*
Musa Abba Jato2
Department of Civil Engineering, University of Bristol, United Kingdom
Department of Geology, University of Brighton, United Kingdom
mail of the corresponding author: cke10@uni.brighton.ac.uk
This paper investigated the impact of contaminants on groundwater flow chemistry and the quality of
East England. Data, obtained from the Campbell scientific weather station
installed in the Patcham catchment and Schlumberger Water Services (SWS), were used to i
mechanism and potential contaminant flow paths through the Chalk unsaturated zone. CTD Divers were also
deployed in three boreholes present within the catchment. Laboratory and analytical techniques such as Raman
trophotometer and YSI Multimeter equipped with Ion selective electrode were used to
investigate the influence of these contaminates on groundwater flow chemistry and quality from the seven
boreholes sites was studied. This research used the data obtained from the loggers and samples collected from
the field to analyse and examine the quality trend observing for major environmental pollutants. Results showed
that all the water parameters analysed were within the WHO guideline values, thus indicating that the
Contaminants, groundwater, Chalk, water table, water chemistry
Groundwater is a great natural resource. It is estimated that universally, over 2 billion people depend mainly on
ater for their daily need (Chaplin, 2001; Kemper, 2004: Egbuna and Duvbiama, 2013). Majority of the
world’s industries as well as large number of world’s agriculture and irrigation mostly depend on groundwater.
In regions like Tunisia, with prominent dry season, groundwater is used as a primary source of irrigation in
agricultural development is widely considered (Ravi et al., 2009). This further illustrates the necessity of
groundwater to life. Groundwater is known to usually have a suitable quality (Nola et al.
Egbuna, 2012) although depending on the hydrological condition it may also be of poor condition.
The Chalk aquifer is an important source of water in North West Europe, particularly in the United Kingdom,
and Germany. In south east of England, the Chalk aquifer provides about 40% of all
potable water and about 80% of total water (Pinault et al., 2005; Brouyere, 2006). The Chalk also provides 55%
abstracted drinking water (Howden et al., 2004). Aldrich (2006) further expressed that about
60% of the chalk aquifer recharge are extracted and used as water supply in the UK. However, the sustainability
of groundwater reduces by the day all over the world, problems of depletion due to use without
salinization and pollution or other human activities affects groundwater. In a study by Lunzhang (1994) in the
Henan province of China, results showed a decline of 0.75-3.68m from 1975-1987 of the water table, after
from 358 observation wells in approximately 2million hectares of irrigated lands.
Chalk aquifers are usually karstic in nature, which means that they contain holes otherwise known as swallow
(sink) holes that may allow infiltration of surface pollutants having contaminants in them. However, recent
factors such as increasing population and development, personal water consumption increase, impacts of
pollution (hydrocarbon) and climate change have put the groundwater from the English chalk aquifer under gre
pressure (Edmunds, 2008). Figure 1 shows the outcrop of the UK chalk aquifer
The chalk has proven to be a good aquifer due its porosity and permeability, but the karstic nature of it makes it
quite easy for surface contaminants to infiltrate into the aquifer. Chalk is a carbonate rock and therefore soluble
in nature, this solubility makes possible the presence of features in a chalk such as solution pipes, swallow holes
and also sink holes. These are surface features that appear as subsidence sinkholes or pipe like features that
extend to depths. Studies carried out have confirmed the existence of such features and are characterized by the
dry valley uplands rather than forming surface streams from rainwater (Edmonds, 2008). Thus, this paper aims to
stigate the impact of contaminants on groundwater flow chemistry and the quality of groundwater in the
Patcham, the study area is situated in the City of Brighton and Hove, East Sussex, South East England. Patcham
www.iiste.org
Impact of contaminants on groundwater quality in Patcham,
cke10@uni.brighton.ac.uk
f contaminants on groundwater flow chemistry and the quality of
East England. Data, obtained from the Campbell scientific weather station
installed in the Patcham catchment and Schlumberger Water Services (SWS), were used to investigate recharge
urated zone. CTD Divers were also
deployed in three boreholes present within the catchment. Laboratory and analytical techniques such as Raman
trophotometer and YSI Multimeter equipped with Ion selective electrode were used to
investigate the influence of these contaminates on groundwater flow chemistry and quality from the seven
rom the loggers and samples collected from
the field to analyse and examine the quality trend observing for major environmental pollutants. Results showed
that all the water parameters analysed were within the WHO guideline values, thus indicating that the water in
Groundwater is a great natural resource. It is estimated that universally, over 2 billion people depend mainly on
ater for their daily need (Chaplin, 2001; Kemper, 2004: Egbuna and Duvbiama, 2013). Majority of the
world’s industries as well as large number of world’s agriculture and irrigation mostly depend on groundwater.
season, groundwater is used as a primary source of irrigation in
., 2009). This further illustrates the necessity of
et al., 2008: Louis and
Egbuna, 2012) although depending on the hydrological condition it may also be of poor condition.
The Chalk aquifer is an important source of water in North West Europe, particularly in the United Kingdom,
and Germany. In south east of England, the Chalk aquifer provides about 40% of all
., 2005; Brouyere, 2006). The Chalk also provides 55%
Aldrich (2006) further expressed that about
60% of the chalk aquifer recharge are extracted and used as water supply in the UK. However, the sustainability
of groundwater reduces by the day all over the world, problems of depletion due to use without replacement,
salinization and pollution or other human activities affects groundwater. In a study by Lunzhang (1994) in the
1987 of the water table, after
from 358 observation wells in approximately 2million hectares of irrigated lands.
Chalk aquifers are usually karstic in nature, which means that they contain holes otherwise known as swallow
having contaminants in them. However, recent
factors such as increasing population and development, personal water consumption increase, impacts of
pollution (hydrocarbon) and climate change have put the groundwater from the English chalk aquifer under great
The chalk has proven to be a good aquifer due its porosity and permeability, but the karstic nature of it makes it
quifer. Chalk is a carbonate rock and therefore soluble
in nature, this solubility makes possible the presence of features in a chalk such as solution pipes, swallow holes
or pipe like features that
extend to depths. Studies carried out have confirmed the existence of such features and are characterized by the
dry valley uplands rather than forming surface streams from rainwater (Edmonds, 2008). Thus, this paper aims to
stigate the impact of contaminants on groundwater flow chemistry and the quality of groundwater in the
Patcham, the study area is situated in the City of Brighton and Hove, East Sussex, South East England. Patcham
Journal of Environment and Earth Science
ISSN 2224-3216 (Paper) ISSN 2225
Vol. 3, No.4, 2013
is approximately about 4.5km north of the city centre; the A27 road bounds it to the north, with Hollingbury to
the East, Withdean to the south and the Brighton mainline to the West. The A23 road passes through Patcham.
Figure 2 is a map of the Patcham catchme
where samples for this project work where collected.
The UK chalk aquifer is cretaceous in age and covers a wide extent of England. Starting from Yorkshire up north
moving down the east coast through Lincolnshire and to East Anglia, turning south westwards, forming the
Chiltern Hills and moving west to Wiltshire. Dipping in the direction south east, if forms the anticlinal flexure
with a simple rise through north Hampshire and North Down
the anticline. The chalk then continues to the west with a southward dip until Dorset (Edmonds, 2008).
2.1 Geology of the Area
A geological map of the study area (Patcham) displayed a complex geology (fol
3 shows the geologic map of the Patcham catchment.
The geology of South East England is characterized by Chalk forming its aquifer, which has a dual porosity
(matrix and fracture). Surface pollutants can easily be transp
Patcham, a highway (A23) passes through the borehole
possible for hydrocarbon runoff to the groundwater due to the nature of the aquifer.
3. Methodology
Records of evapotranspiration, conductivity, rainfall fluxes and water table depth all contributed to the
monitoring of the influence of these contaminates on groundwater. Data, obtained from a Campbell scientific
weather station installed in the study
investigate recharge mechanism and potential contaminant flow paths through the Chalk unsaturated zone. CTD
Divers were also deployed in three boreholes present within the catchment (i.e. North
and Pyecoomb East).
Using laboratory and analytical techniques such as Raman spectroscopy, Hach Spectrophotometer and YSI
Multimeter equipped with Ion selective electrode were used to investigate the influence of these contaminates
groundwater flow chemistry and quality from the seven boreholes sites was studied.
3.1 Data Collection and sampling
Data collection included visits to borehole monitoring sites where samples of water was collected from each of
the seven sites of monitoring boreholes available within the Patcham catchment area.
Pressure transducers are present within all the monitoring boreholes. They were used to monitor changes in the
water table of the boreholes; they were quite sensitive and also show rapid response
the variation levels in groundwater and the data obtained was stored using data logger for long periods of time.
The techniques used in sampling included; using a bladder pump and flow through a cell and a bailer. A bailer is
hollow equipment used for collecting water samples from monitoring wells. Water samples were collected in a
plastic container, using a marker to give each separate sample its label.
These borehole monitoring sites within the Patcham catchment are: Preston Pa
North Heath Barn, Casterbridge farm, Pyecomb old rec, and Pyecombe east. Data were collected on the 9
2012.
In three of the boreholes within Patcham, (North Heath Barn, Preston Park and Pyecoomb East), a CTD
data logger was placed which recorded data for conductivity, temperature and depth over long periods of time.
Penman-Monotieth equation and YSI multimeter amongst other methods was used in the process. The multimeter
is a hand-held field meter that measu
4. RESULTS
4.1 Water level and Conductivity of North Heath Barn borehole
Chalk of the North Heath Barn borehole is predominantly white in colour. It is a monitoring site with 70m
August unsaturated zone. The installed diver in the North Heath Barn borehole was used to generate data on the
conductivity and water depth (level). This was plotted against date (Figure 4) in order to identify depth of
recharge and plausible compositional change in
In Figure 4, it can be observed that the water depth gradually rose from mid
maximum value of 70.54m bgl. A steep decline is observed between ending December and mid
values as low as 68.51m bgl. Conductivity in the North Heath Barn borehole shows a rather uniform distribution
Journal of Environment and Earth Science
3216 (Paper) ISSN 2225-0948 (Online)
56
pproximately about 4.5km north of the city centre; the A27 road bounds it to the north, with Hollingbury to
the East, Withdean to the south and the Brighton mainline to the West. The A23 road passes through Patcham.
Figure 2 is a map of the Patcham catchment showing locations of monitoring boreholes available within the area
where samples for this project work where collected.
The UK chalk aquifer is cretaceous in age and covers a wide extent of England. Starting from Yorkshire up north
coast through Lincolnshire and to East Anglia, turning south westwards, forming the
Chiltern Hills and moving west to Wiltshire. Dipping in the direction south east, if forms the anticlinal flexure
with a simple rise through north Hampshire and North Downs. South Downs is located on the southern limb of
the anticline. The chalk then continues to the west with a southward dip until Dorset (Edmonds, 2008).
A geological map of the study area (Patcham) displayed a complex geology (folds and faults) of the area. Figure
3 shows the geologic map of the Patcham catchment.
The geology of South East England is characterized by Chalk forming its aquifer, which has a dual porosity
(matrix and fracture). Surface pollutants can easily be transported through the fracture to the water at ease. In
Patcham, a highway (A23) passes through the borehole-monitoring sites which are available, thus making it
possible for hydrocarbon runoff to the groundwater due to the nature of the aquifer.
Records of evapotranspiration, conductivity, rainfall fluxes and water table depth all contributed to the
monitoring of the influence of these contaminates on groundwater. Data, obtained from a Campbell scientific
weather station installed in the study catchment and Schlumberger Water Services (SWS), were used to
investigate recharge mechanism and potential contaminant flow paths through the Chalk unsaturated zone. CTD
Divers were also deployed in three boreholes present within the catchment (i.e. North Heath Barn, Preston Park
Using laboratory and analytical techniques such as Raman spectroscopy, Hach Spectrophotometer and YSI
Multimeter equipped with Ion selective electrode were used to investigate the influence of these contaminates
groundwater flow chemistry and quality from the seven boreholes sites was studied.
Data collection included visits to borehole monitoring sites where samples of water was collected from each of
oring boreholes available within the Patcham catchment area.
Pressure transducers are present within all the monitoring boreholes. They were used to monitor changes in the
water table of the boreholes; they were quite sensitive and also show rapid response. They were used to record
the variation levels in groundwater and the data obtained was stored using data logger for long periods of time.
The techniques used in sampling included; using a bladder pump and flow through a cell and a bailer. A bailer is
llow equipment used for collecting water samples from monitoring wells. Water samples were collected in a
plastic container, using a marker to give each separate sample its label.
These borehole monitoring sites within the Patcham catchment are: Preston Park, Lower Standean, North Bottom,
North Heath Barn, Casterbridge farm, Pyecomb old rec, and Pyecombe east. Data were collected on the 9
In three of the boreholes within Patcham, (North Heath Barn, Preston Park and Pyecoomb East), a CTD
data logger was placed which recorded data for conductivity, temperature and depth over long periods of time.
Monotieth equation and YSI multimeter amongst other methods was used in the process. The multimeter
held field meter that measures oxygen, conductivity, salinity and temperature of the water.
4.1 Water level and Conductivity of North Heath Barn borehole
Chalk of the North Heath Barn borehole is predominantly white in colour. It is a monitoring site with 70m
aturated zone. The installed diver in the North Heath Barn borehole was used to generate data on the
conductivity and water depth (level). This was plotted against date (Figure 4) in order to identify depth of
recharge and plausible compositional change in the water entering the Chalk aquifer.
In Figure 4, it can be observed that the water depth gradually rose from mid-June to mid
maximum value of 70.54m bgl. A steep decline is observed between ending December and mid
low as 68.51m bgl. Conductivity in the North Heath Barn borehole shows a rather uniform distribution
www.iiste.org
pproximately about 4.5km north of the city centre; the A27 road bounds it to the north, with Hollingbury to
the East, Withdean to the south and the Brighton mainline to the West. The A23 road passes through Patcham.
nt showing locations of monitoring boreholes available within the area
The UK chalk aquifer is cretaceous in age and covers a wide extent of England. Starting from Yorkshire up north
coast through Lincolnshire and to East Anglia, turning south westwards, forming the
Chiltern Hills and moving west to Wiltshire. Dipping in the direction south east, if forms the anticlinal flexure
s. South Downs is located on the southern limb of
the anticline. The chalk then continues to the west with a southward dip until Dorset (Edmonds, 2008).
ds and faults) of the area. Figure
The geology of South East England is characterized by Chalk forming its aquifer, which has a dual porosity
orted through the fracture to the water at ease. In
monitoring sites which are available, thus making it
Records of evapotranspiration, conductivity, rainfall fluxes and water table depth all contributed to the
monitoring of the influence of these contaminates on groundwater. Data, obtained from a Campbell scientific
catchment and Schlumberger Water Services (SWS), were used to
investigate recharge mechanism and potential contaminant flow paths through the Chalk unsaturated zone. CTD
Heath Barn, Preston Park
Using laboratory and analytical techniques such as Raman spectroscopy, Hach Spectrophotometer and YSI
Multimeter equipped with Ion selective electrode were used to investigate the influence of these contaminates on
Data collection included visits to borehole monitoring sites where samples of water was collected from each of
Pressure transducers are present within all the monitoring boreholes. They were used to monitor changes in the
. They were used to record
the variation levels in groundwater and the data obtained was stored using data logger for long periods of time.
The techniques used in sampling included; using a bladder pump and flow through a cell and a bailer. A bailer is
llow equipment used for collecting water samples from monitoring wells. Water samples were collected in a
rk, Lower Standean, North Bottom,
North Heath Barn, Casterbridge farm, Pyecomb old rec, and Pyecombe east. Data were collected on the 9th
March
In three of the boreholes within Patcham, (North Heath Barn, Preston Park and Pyecoomb East), a CTD- Diver
data logger was placed which recorded data for conductivity, temperature and depth over long periods of time.
Monotieth equation and YSI multimeter amongst other methods was used in the process. The multimeter
res oxygen, conductivity, salinity and temperature of the water.
Chalk of the North Heath Barn borehole is predominantly white in colour. It is a monitoring site with 70m
aturated zone. The installed diver in the North Heath Barn borehole was used to generate data on the
conductivity and water depth (level). This was plotted against date (Figure 4) in order to identify depth of
June to mid-October reaching a
maximum value of 70.54m bgl. A steep decline is observed between ending December and mid-January to
low as 68.51m bgl. Conductivity in the North Heath Barn borehole shows a rather uniform distribution
Journal of Environment and Earth Science
ISSN 2224-3216 (Paper) ISSN 2225
Vol. 3, No.4, 2013
all year round with a few peaks of about 0.398 msie/cm in early August and mid
observed that this value declines to a low of 0
4.2 Water level and Conductivity of Preston Park borehole
Preston Park is an urban site, with the aquifer characterised by white chalk. The borehole monitoring site located
in Preston Park has depth of about 18
divers installed in the borehole of the site (Preston Park) was used to generate data on the conductivity and water
depth (level). This was plotted against date (Figure 5) in order to identify de
composition of the water entering the Chalk aquifer.
From figure 5, it can be seen that the water level has been more or less stable almost all through the year
although there were some major decline from December
Results further showed that conductivity showed abrupt changes, falling rapidly from 0.71msie/cm from ending
June to 0.648msie/cm in the beginning of July. The rise and fall in conductivity continued up until the
August where it fell to o.648msie/cm and had a uniform distribution till the mid of December, where it raised
again to 0.7msie/cm.
4.3 Water level and Conductivity of Pyecoomb East borehole
The pyecoomb east is an effluent dispersal site, dominated
site with 60m August, unsaturated zone.
Figure 6 was plot against date in order to identify depth of recharge and possible compositional change in the
water entering the Chalk aquifer, using data collec
plotted in the Figure 6 above shows a continuous increase throughout the year from 56.82m bgl in June to about
57.1m bgl in March. The conductivity in the borehole shows an irregular distributi
from June at (0.73msie/cm) through to mid
mid-august (0.73msie/cm) to September (0.78msie/cm), thereafter a uniform distribution is being observed
throughout the rest of the year.
4.4 Evapotranspiration and Rainfall influx of the boreholes
The new climatic station installed at the North Heath Barn borehole allowed for accurate calculation of the
evapotranspiration, while the rainfall data collected from the borehole a
three boreholes as they are within the same area. A plot of evapotranspiration and rainfall influx against date
(Figure 7) is important in establishing the rate of contaminant movement from CUZ to CSZ (i.e. groundwat
Also aquifer recharge rate can also be postulated from this plot.
From figure 7, it can be observed that the distribution of evapotranspiration is highly inconsistent. The
evapotranspiration initially peaked at about 4.7mm and falls to a minimum valu
increasing to a late peak value of 2.5mm. Unlike evapotranspiration, rainfall influx within the same period as
recorded from the borehole showed a more even distribution characterised with series of sharp peaks. The
maximum-recorded rainfall data over the distribution is 25mm with a record low of 0.5mm. Clearly, it can be
observed that rainfall influx rate is predominantly greater in quantity than evapotranspiration rate in the
borehole.
4.5 Subsurface Element Concentration data
To effectively categorise the type and extent of contamination of groundwater within the study areas,
concentration of some contaminants measured in the three boreholes are plotted against date. This is necessary in
an attempt to determine the trend of contamination in the boreholes as regards to seasonal variation. Firstly, we
present World Health Organisation (WHO) standard for element concentration in groundwater (Table 1).
4.5.1 Contaminants concentration in the North Heath Barn borehole
Concentration of contaminants in the groundwater of the North Heath Barn borehole was plotted against the date
to ascertain whether these limits are within the specified WHO specification presented in table 1.
From the graph, it can be observed that ammoniu
the given period. Chlorine concentration in the borehole was first recorded in June and can be seen to be evenly
distributed hereafter. Average Cl concentration is 13 mg/L, this is within the WHO spe
groundwater (see Table 1). Nitrate concentration in January of 2011 begins at 3 mg/L. However, a steady
increase in nitrate concentration is observed as we approach April, until a record high of 23.5 mg/L (figure 8).
This projection begins to decline steeply to almost 3 mg/L in early June. Hereafter, nitrate concentration
Journal of Environment and Earth Science
3216 (Paper) ISSN 2225-0948 (Online)
57
all year round with a few peaks of about 0.398 msie/cm in early August and mid-January. However, it can be
observed that this value declines to a low of 0.377msie/cm in February and March.
4.2 Water level and Conductivity of Preston Park borehole
Preston Park is an urban site, with the aquifer characterised by white chalk. The borehole monitoring site located
in Preston Park has depth of about 18-20m August unsaturated zone. A plot made from data collected by the
divers installed in the borehole of the site (Preston Park) was used to generate data on the conductivity and water
depth (level). This was plotted against date (Figure 5) in order to identify depth of recharge and likely change in
composition of the water entering the Chalk aquifer.
From figure 5, it can be seen that the water level has been more or less stable almost all through the year
although there were some major decline from December- February dropping from 23m to about 18m bgl.
Results further showed that conductivity showed abrupt changes, falling rapidly from 0.71msie/cm from ending
June to 0.648msie/cm in the beginning of July. The rise and fall in conductivity continued up until the
August where it fell to o.648msie/cm and had a uniform distribution till the mid of December, where it raised
4.3 Water level and Conductivity of Pyecoomb East borehole
The pyecoomb east is an effluent dispersal site, dominated by Grey Chalk formation. It is a borehole monitoring
site with 60m August, unsaturated zone.
Figure 6 was plot against date in order to identify depth of recharge and possible compositional change in the
water entering the Chalk aquifer, using data collecting from installed divers. The water level in the borehole as
plotted in the Figure 6 above shows a continuous increase throughout the year from 56.82m bgl in June to about
57.1m bgl in March. The conductivity in the borehole shows an irregular distribution, displaying a drop starting
from June at (0.73msie/cm) through to mid-August (0.71msie/cm). A steady increase is observed between
august (0.73msie/cm) to September (0.78msie/cm), thereafter a uniform distribution is being observed
4.4 Evapotranspiration and Rainfall influx of the boreholes
The new climatic station installed at the North Heath Barn borehole allowed for accurate calculation of the
evapotranspiration, while the rainfall data collected from the borehole at North Heath Barn was used for all the
three boreholes as they are within the same area. A plot of evapotranspiration and rainfall influx against date
(Figure 7) is important in establishing the rate of contaminant movement from CUZ to CSZ (i.e. groundwat
Also aquifer recharge rate can also be postulated from this plot.
From figure 7, it can be observed that the distribution of evapotranspiration is highly inconsistent. The
evapotranspiration initially peaked at about 4.7mm and falls to a minimum value of 0.3mm before gradually
increasing to a late peak value of 2.5mm. Unlike evapotranspiration, rainfall influx within the same period as
recorded from the borehole showed a more even distribution characterised with series of sharp peaks. The
rded rainfall data over the distribution is 25mm with a record low of 0.5mm. Clearly, it can be
observed that rainfall influx rate is predominantly greater in quantity than evapotranspiration rate in the
4.5 Subsurface Element Concentration data on the Chalk
To effectively categorise the type and extent of contamination of groundwater within the study areas,
concentration of some contaminants measured in the three boreholes are plotted against date. This is necessary in
e trend of contamination in the boreholes as regards to seasonal variation. Firstly, we
present World Health Organisation (WHO) standard for element concentration in groundwater (Table 1).
4.5.1 Contaminants concentration in the North Heath Barn borehole
oncentration of contaminants in the groundwater of the North Heath Barn borehole was plotted against the date
to ascertain whether these limits are within the specified WHO specification presented in table 1.
From the graph, it can be observed that ammonium concentration was very low and unpronounced throughout
the given period. Chlorine concentration in the borehole was first recorded in June and can be seen to be evenly
distributed hereafter. Average Cl concentration is 13 mg/L, this is within the WHO spe
groundwater (see Table 1). Nitrate concentration in January of 2011 begins at 3 mg/L. However, a steady
increase in nitrate concentration is observed as we approach April, until a record high of 23.5 mg/L (figure 8).
egins to decline steeply to almost 3 mg/L in early June. Hereafter, nitrate concentration
www.iiste.org
January. However, it can be
Preston Park is an urban site, with the aquifer characterised by white chalk. The borehole monitoring site located
ust unsaturated zone. A plot made from data collected by the
divers installed in the borehole of the site (Preston Park) was used to generate data on the conductivity and water
pth of recharge and likely change in
From figure 5, it can be seen that the water level has been more or less stable almost all through the year
uary dropping from 23m to about 18m bgl.
Results further showed that conductivity showed abrupt changes, falling rapidly from 0.71msie/cm from ending
June to 0.648msie/cm in the beginning of July. The rise and fall in conductivity continued up until the mid of
August where it fell to o.648msie/cm and had a uniform distribution till the mid of December, where it raised
by Grey Chalk formation. It is a borehole monitoring
Figure 6 was plot against date in order to identify depth of recharge and possible compositional change in the
ting from installed divers. The water level in the borehole as
plotted in the Figure 6 above shows a continuous increase throughout the year from 56.82m bgl in June to about
on, displaying a drop starting
August (0.71msie/cm). A steady increase is observed between
august (0.73msie/cm) to September (0.78msie/cm), thereafter a uniform distribution is being observed
The new climatic station installed at the North Heath Barn borehole allowed for accurate calculation of the
t North Heath Barn was used for all the
three boreholes as they are within the same area. A plot of evapotranspiration and rainfall influx against date
(Figure 7) is important in establishing the rate of contaminant movement from CUZ to CSZ (i.e. groundwater).
From figure 7, it can be observed that the distribution of evapotranspiration is highly inconsistent. The
e of 0.3mm before gradually
increasing to a late peak value of 2.5mm. Unlike evapotranspiration, rainfall influx within the same period as
recorded from the borehole showed a more even distribution characterised with series of sharp peaks. The
rded rainfall data over the distribution is 25mm with a record low of 0.5mm. Clearly, it can be
observed that rainfall influx rate is predominantly greater in quantity than evapotranspiration rate in the
To effectively categorise the type and extent of contamination of groundwater within the study areas,
concentration of some contaminants measured in the three boreholes are plotted against date. This is necessary in
e trend of contamination in the boreholes as regards to seasonal variation. Firstly, we
present World Health Organisation (WHO) standard for element concentration in groundwater (Table 1).
oncentration of contaminants in the groundwater of the North Heath Barn borehole was plotted against the date
to ascertain whether these limits are within the specified WHO specification presented in table 1.
m concentration was very low and unpronounced throughout
the given period. Chlorine concentration in the borehole was first recorded in June and can be seen to be evenly
distributed hereafter. Average Cl concentration is 13 mg/L, this is within the WHO specified limit of Cl in
groundwater (see Table 1). Nitrate concentration in January of 2011 begins at 3 mg/L. However, a steady
increase in nitrate concentration is observed as we approach April, until a record high of 23.5 mg/L (figure 8).
egins to decline steeply to almost 3 mg/L in early June. Hereafter, nitrate concentration
Journal of Environment and Earth Science
ISSN 2224-3216 (Paper) ISSN 2225
Vol. 3, No.4, 2013
increases again to about 9 mg/L in early October before a gradual decline is seen to occur.
Dissolved oxygen concentration can be said to be averagely distributed thr
slightly above 10 mg/L. Nitrite concentration begins at 14.5 mg/L (this is it highest value throughout the given
period). A sharp decline is seen until a recorded value of 6 mg/L in mid
fluctuates until a steady concentration of 5 mg/L is reached through September to January before a gradually
declines to 3 mg/L is finally observed (figure 8). Phosphate, Sulfate and TOC concentrations all occur below 2
mg/L, with the TOC showing more of irregular distribution than phosphate and sulphate (which are generally
below 0.6 mg/L).
From the above analysis, it could be seen that all the parameters analysed for were within the WHO guideline
values, thus indicating that the water in this area
4.5.2 Contaminants concentration in the Preston Park borehole
Contaminants concentration in the groundwater within the Preston Park borehole is plotted against date to obtain
whether these limits are within the specified WHO speci
From figure 9, it could be seen that chlorine concentration was not detected throughout the whole year. It was
detected starting from May with concentration of about 9 mg/l, with maximum concentrations of Chlorine seen
in the month of August and September both at 15 mg/l which falls below the WHO specified limit of Cl in
groundwater. Nitrate concentration displays a low concentration from the beginning with the lowest at 0.2 mg/L
in February, with a sharp rise reaching the hi
Dissolved oxygen, sulphate, phosphate and TOC all have concentration lower than the WHO specified limit,
although TOC shows a sudden rise in January of 2012 to about 16 mg/L.
It could also be seen from the above analysis, that all the parameters analysed for were within the WHO
guideline values, thus indicating that the water in this area is quite safe for usage.
4.5.3 Contaminants concentration in Pyecoomb East Borehole
Contaminants concentration in the groundwater within the Pyecoomb East borehole is plotted against date to
obtain whether these limits are within the specified WHO specification presented in table 4.1 above. The graph is
shown in figure 10.
Ammonium shows a steady raise reaching a hi
until reaching an average point. Nitrate, dissolved oxygen, chlorine, SO
distribution except for PO4 which shows an inconsistency from the beginning and then a steep
November reaching as high as 9 mg/L before falling to continue at initial level.
From the above analysis of water in this site, it could be seen that all the parameters analysed for were within the
WHO guideline values, thus indicating tha
4.6 Raman Spectroscopy results
This graph shows a plot of intensity against Raman shift in the samples. The Raman spectroscopy results showed
almost similar results but at different peaks. The Raman spectr
to overlap with plastic container lines, giving similar spectra for all the seven samples (Figure 11).
5. DISCUSSIONS
5.1 Hydraulic conductivity
Hydraulic conductivity in the North Heath Barn is relative
monitoring site of about 70m August unsaturated zone. Groundwater depth (level) decreases to a minimum
during winter months of December through to January. Rainfall influx was as well predominantly greater i
quantity and showed less inconsistency than evapotranspiration rate in the borehole. Uniformity of the hydraulic
conductivity is thought to be due to its thick unsaturated zone. In which case the soil and weathered chalk of the
area damped out of the normal recharge signal, storing water and releasing it gradually to the unweathered chalk.
Matric potential increased with depth for unsaturated zone, especially in summer months (Price
Base recharge of the weathered zone is thought to be great
potential sufficiently high that water was not absorbed straight back into the matrix but reached the water table
without being absorbed by the matrix. Hence, explaining the even distribution of conductivity a
recharge even in summer periods (of less rainfall influx). Fracture flow may also contribute to groundwater
recharge but this is rare, since drainage to water table continues year round.
Gallagher et al. (2012) reported that the unsaturated
part of the year. The data from the hydrograph and matric potential showed that the water table responds rapidly
following sudden increases in matric potential above the air entry pressure of fractur
are separated by faults, fractures and marls and are close to saturation, even during summer months. They
Journal of Environment and Earth Science
3216 (Paper) ISSN 2225-0948 (Online)
58
increases again to about 9 mg/L in early October before a gradual decline is seen to occur.
Dissolved oxygen concentration can be said to be averagely distributed throughout given period, with limits
slightly above 10 mg/L. Nitrite concentration begins at 14.5 mg/L (this is it highest value throughout the given
period). A sharp decline is seen until a recorded value of 6 mg/L in mid-February. Hereafter, nitrite concent
fluctuates until a steady concentration of 5 mg/L is reached through September to January before a gradually
declines to 3 mg/L is finally observed (figure 8). Phosphate, Sulfate and TOC concentrations all occur below 2
re of irregular distribution than phosphate and sulphate (which are generally
From the above analysis, it could be seen that all the parameters analysed for were within the WHO guideline
values, thus indicating that the water in this area is quite safe for usage.
4.5.2 Contaminants concentration in the Preston Park borehole
Contaminants concentration in the groundwater within the Preston Park borehole is plotted against date to obtain
whether these limits are within the specified WHO specification presented in table 1.
From figure 9, it could be seen that chlorine concentration was not detected throughout the whole year. It was
detected starting from May with concentration of about 9 mg/l, with maximum concentrations of Chlorine seen
e month of August and September both at 15 mg/l which falls below the WHO specified limit of Cl in
groundwater. Nitrate concentration displays a low concentration from the beginning with the lowest at 0.2 mg/L
in February, with a sharp rise reaching the highest concentrations in 16 mg/L in the month of September.
Dissolved oxygen, sulphate, phosphate and TOC all have concentration lower than the WHO specified limit,
although TOC shows a sudden rise in January of 2012 to about 16 mg/L.
from the above analysis, that all the parameters analysed for were within the WHO
guideline values, thus indicating that the water in this area is quite safe for usage.
4.5.3 Contaminants concentration in Pyecoomb East Borehole
n the groundwater within the Pyecoomb East borehole is plotted against date to
obtain whether these limits are within the specified WHO specification presented in table 4.1 above. The graph is
Ammonium shows a steady raise reaching a high of 83mg/L with a more or insistent up and down movement
until reaching an average point. Nitrate, dissolved oxygen, chlorine, SO4, TOC, NO
which shows an inconsistency from the beginning and then a steep
November reaching as high as 9 mg/L before falling to continue at initial level.
From the above analysis of water in this site, it could be seen that all the parameters analysed for were within the
WHO guideline values, thus indicating that the water in this area is quite safe for usage.
This graph shows a plot of intensity against Raman shift in the samples. The Raman spectroscopy results showed
almost similar results but at different peaks. The Raman spectroscopy results could not be further interpreted due
to overlap with plastic container lines, giving similar spectra for all the seven samples (Figure 11).
Hydraulic conductivity in the North Heath Barn is relatively uniformly distributed all year round. It is a
monitoring site of about 70m August unsaturated zone. Groundwater depth (level) decreases to a minimum
during winter months of December through to January. Rainfall influx was as well predominantly greater i
quantity and showed less inconsistency than evapotranspiration rate in the borehole. Uniformity of the hydraulic
conductivity is thought to be due to its thick unsaturated zone. In which case the soil and weathered chalk of the
mal recharge signal, storing water and releasing it gradually to the unweathered chalk.
Matric potential increased with depth for unsaturated zone, especially in summer months (Price
Base recharge of the weathered zone is thought to be greater than the matric permeability and the matric
potential sufficiently high that water was not absorbed straight back into the matrix but reached the water table
without being absorbed by the matrix. Hence, explaining the even distribution of conductivity a
recharge even in summer periods (of less rainfall influx). Fracture flow may also contribute to groundwater
recharge but this is rare, since drainage to water table continues year round.
(2012) reported that the unsaturated zone of North Heath Barn was closely saturated for most
part of the year. The data from the hydrograph and matric potential showed that the water table responds rapidly
following sudden increases in matric potential above the air entry pressure of fractures and that aquifer blocks
are separated by faults, fractures and marls and are close to saturation, even during summer months. They
www.iiste.org
increases again to about 9 mg/L in early October before a gradual decline is seen to occur.
oughout given period, with limits
slightly above 10 mg/L. Nitrite concentration begins at 14.5 mg/L (this is it highest value throughout the given
February. Hereafter, nitrite concentration
fluctuates until a steady concentration of 5 mg/L is reached through September to January before a gradually
declines to 3 mg/L is finally observed (figure 8). Phosphate, Sulfate and TOC concentrations all occur below 2
re of irregular distribution than phosphate and sulphate (which are generally
From the above analysis, it could be seen that all the parameters analysed for were within the WHO guideline
Contaminants concentration in the groundwater within the Preston Park borehole is plotted against date to obtain
From figure 9, it could be seen that chlorine concentration was not detected throughout the whole year. It was
detected starting from May with concentration of about 9 mg/l, with maximum concentrations of Chlorine seen
e month of August and September both at 15 mg/l which falls below the WHO specified limit of Cl in
groundwater. Nitrate concentration displays a low concentration from the beginning with the lowest at 0.2 mg/L
ghest concentrations in 16 mg/L in the month of September.
Dissolved oxygen, sulphate, phosphate and TOC all have concentration lower than the WHO specified limit,
from the above analysis, that all the parameters analysed for were within the WHO
n the groundwater within the Pyecoomb East borehole is plotted against date to
obtain whether these limits are within the specified WHO specification presented in table 4.1 above. The graph is
gh of 83mg/L with a more or insistent up and down movement
2 all display a normal
which shows an inconsistency from the beginning and then a steep raise from 25th
From the above analysis of water in this site, it could be seen that all the parameters analysed for were within the
This graph shows a plot of intensity against Raman shift in the samples. The Raman spectroscopy results showed
oscopy results could not be further interpreted due
to overlap with plastic container lines, giving similar spectra for all the seven samples (Figure 11).
ly uniformly distributed all year round. It is a
monitoring site of about 70m August unsaturated zone. Groundwater depth (level) decreases to a minimum
during winter months of December through to January. Rainfall influx was as well predominantly greater in
quantity and showed less inconsistency than evapotranspiration rate in the borehole. Uniformity of the hydraulic
conductivity is thought to be due to its thick unsaturated zone. In which case the soil and weathered chalk of the
mal recharge signal, storing water and releasing it gradually to the unweathered chalk.
Matric potential increased with depth for unsaturated zone, especially in summer months (Price et al., 1976).
er than the matric permeability and the matric
potential sufficiently high that water was not absorbed straight back into the matrix but reached the water table
without being absorbed by the matrix. Hence, explaining the even distribution of conductivity and groundwater
recharge even in summer periods (of less rainfall influx). Fracture flow may also contribute to groundwater
zone of North Heath Barn was closely saturated for most
part of the year. The data from the hydrograph and matric potential showed that the water table responds rapidly
es and that aquifer blocks
are separated by faults, fractures and marls and are close to saturation, even during summer months. They
Journal of Environment and Earth Science
ISSN 2224-3216 (Paper) ISSN 2225
Vol. 3, No.4, 2013
suggested connectivity between the faults, fractures and marl may occur when matric potentials are high and
there is sufficient rainfall input. Hence, water then starts to fill faults and large fractures, allowing rapid
movement of water through the unsaturated zone, maintaining the groundwater recharge year round.
In Preston Park, the borehole is characterized by a slim unsa
the possibility of water rapidly reaching the water table compared to the other two boreholes with a thicker
unsaturated zone. Exertion of pressure from the matric potential is low (as the zone of unsatu
hence mobility of surface water in the unsaturation zone to the saturate zone may occur readily. In summer
months when recharge is less, the matric potential increases causing absorbed water on the Chalk matrix to
percolate further below the water table, maintaining recharge. Due to the thin unsaturation zone, it was believed
that in period of intense and sustained rainfall, flash flooding may occur as depth to water table may become
almost at the surface but this was not anticipated to las
within the aquifer formation may diminish the effect. Zaidman
steeply inclined normal faults approximately every 20 m, including one fault that conta
iron-stained breccia zone, which indicates the movement of water through it.
Pyecoomb East borehole has an unsaturated zone of about 60m. Effluent release and farmland irrigation
contributed to the groundwater recharge, explaining the r
This site had high concentration of nitrate and chlorine when compared to the North Heath Barn. The high
concentration of nitrate and chlorine also further fortify the possibility of groundwater recharg
discharge and farmland washout from irrigation activities.
5.2 Chemical Variation
Several plots were made (Nitrate –
Nitrate – TOC, and Nitrate – Sulphate) to study t
hence infer plausible trend to the source and movement of contaminants. Of the studied boreholes, Pyecombe
East had the highest concentration of Nitrate, Phosphate, Chlorine and Sulphate but the
Total Organic Content (TOC). The borehole at Pyecombe East is an effluent dispersal site with 60m of August
unsaturated zone. Therefore increased mixing of surface effluent recharge with groundwater is thought to be
responsible for the high concentration of these elements in the Chalk aquifer. These concentrations, in most cases,
show steady consistent increase pattern likely arising from seasonal variation.
Organic content concentration of effluent recharge to the groundwater at Pyec
the low TOC concentration in the areas.
The concentration of Nitrate and Chlorine is higher in the Preston park borehole compared to the North Heath
Barn. Preston Park borehole is urban recharge with thin August unsaturat
movement of these elements without having to be absorbed on the weathered chalk matrix. The high
concentrations of these elements suggest an artificial recharge to groundwater from surface urban run
farmland irrigation practices.
Concentration of Phosphate, Sulphate and TOC is higher in the North Heath Barn borehole compared to
observed Preston park borehole. As already mentioned earlier, North Heath Barn is monitoring site with the
thickest August unsaturation zone of
unsaturated zone may dissolve the marl formation causing an increase in the phosphate and sulphate
concentration as groundwater is recharged. Evenly distributed hydraulic conductivi
gradual release of stored water from unweathered Chalk (to sustain the year round recharge) may carry along
organic matter from the Chalk formation, hence describing the high TOC concentration in the North Heath Barn
borehole compared to other studied borehole locations.
Of all the three studied boreholes, Pyecombe East (an effluent dispersal site) show high concentration of all
contaminants except TOC, highest in the North Heath Barn. Artificial recharge in the Preston park boreh
(Urban site) may be responsible for the high concentrations of Chlorine and Nitrate.
6. Conclusion
This paper investigated the impact of contaminants on groundwater flow chemistry and the quality of
groundwater in Patcham, South-East England. Groundwa
months of December through to January. Rainfall influx is as well predominantly greater in quantity and shows
less inconsistency than evapotranspiration rate in the borehole. The uniformity of the hydr
thought to be due to the thickness of the unsaturated zone at North Heath Barn and Pyecoomb East. Except for
Preston Park, this has a much thinner unsaturated zone, which may influence the rapid water movement to the
water table.
Chemical variation of the boreholes studied showed the borehole at Pyecoomb East to be more of an effluent
Journal of Environment and Earth Science
3216 (Paper) ISSN 2225-0948 (Online)
59
suggested connectivity between the faults, fractures and marl may occur when matric potentials are high and
ient rainfall input. Hence, water then starts to fill faults and large fractures, allowing rapid
movement of water through the unsaturated zone, maintaining the groundwater recharge year round.
In Preston Park, the borehole is characterized by a slim unsaturated zone of about 20m thick, which may result in
the possibility of water rapidly reaching the water table compared to the other two boreholes with a thicker
unsaturated zone. Exertion of pressure from the matric potential is low (as the zone of unsatu
hence mobility of surface water in the unsaturation zone to the saturate zone may occur readily. In summer
months when recharge is less, the matric potential increases causing absorbed water on the Chalk matrix to
he water table, maintaining recharge. Due to the thin unsaturation zone, it was believed
that in period of intense and sustained rainfall, flash flooding may occur as depth to water table may become
almost at the surface but this was not anticipated to last for a long period, as fracture flow or lateral movement
within the aquifer formation may diminish the effect. Zaidman et al., (1999) working in Yorkshire, identified
steeply inclined normal faults approximately every 20 m, including one fault that conta
stained breccia zone, which indicates the movement of water through it.
Pyecoomb East borehole has an unsaturated zone of about 60m. Effluent release and farmland irrigation
contributed to the groundwater recharge, explaining the recharge occurring even period of low rainfall influx.
This site had high concentration of nitrate and chlorine when compared to the North Heath Barn. The high
concentration of nitrate and chlorine also further fortify the possibility of groundwater recharg
discharge and farmland washout from irrigation activities.
Phosphate, Nitrate – Chlorine, Sulphate – Phosphate, Sulphate
Sulphate) to study the chemical variation of elements within the catchment area,
hence infer plausible trend to the source and movement of contaminants. Of the studied boreholes, Pyecombe
East had the highest concentration of Nitrate, Phosphate, Chlorine and Sulphate but the
Total Organic Content (TOC). The borehole at Pyecombe East is an effluent dispersal site with 60m of August
unsaturated zone. Therefore increased mixing of surface effluent recharge with groundwater is thought to be
e high concentration of these elements in the Chalk aquifer. These concentrations, in most cases,
show steady consistent increase pattern likely arising from seasonal variation.
Organic content concentration of effluent recharge to the groundwater at Pyecombe east was low, thus reflecting
the low TOC concentration in the areas.
The concentration of Nitrate and Chlorine is higher in the Preston park borehole compared to the North Heath
Barn. Preston Park borehole is urban recharge with thin August unsaturated zone enhancing more rapid
movement of these elements without having to be absorbed on the weathered chalk matrix. The high
concentrations of these elements suggest an artificial recharge to groundwater from surface urban run
Concentration of Phosphate, Sulphate and TOC is higher in the North Heath Barn borehole compared to
observed Preston park borehole. As already mentioned earlier, North Heath Barn is monitoring site with the
thickest August unsaturation zone of the three borehole sites. Pyrite oxidation as bypass flow within the thick
unsaturated zone may dissolve the marl formation causing an increase in the phosphate and sulphate
concentration as groundwater is recharged. Evenly distributed hydraulic conductivity throughout the year and
gradual release of stored water from unweathered Chalk (to sustain the year round recharge) may carry along
organic matter from the Chalk formation, hence describing the high TOC concentration in the North Heath Barn
pared to other studied borehole locations.
Of all the three studied boreholes, Pyecombe East (an effluent dispersal site) show high concentration of all
contaminants except TOC, highest in the North Heath Barn. Artificial recharge in the Preston park boreh
(Urban site) may be responsible for the high concentrations of Chlorine and Nitrate.
This paper investigated the impact of contaminants on groundwater flow chemistry and the quality of
East England. Groundwater depth (level) decreases to a minimum during winter
months of December through to January. Rainfall influx is as well predominantly greater in quantity and shows
less inconsistency than evapotranspiration rate in the borehole. The uniformity of the hydr
thought to be due to the thickness of the unsaturated zone at North Heath Barn and Pyecoomb East. Except for
Preston Park, this has a much thinner unsaturated zone, which may influence the rapid water movement to the
ical variation of the boreholes studied showed the borehole at Pyecoomb East to be more of an effluent
www.iiste.org
suggested connectivity between the faults, fractures and marl may occur when matric potentials are high and
ient rainfall input. Hence, water then starts to fill faults and large fractures, allowing rapid
movement of water through the unsaturated zone, maintaining the groundwater recharge year round.
turated zone of about 20m thick, which may result in
the possibility of water rapidly reaching the water table compared to the other two boreholes with a thicker
unsaturated zone. Exertion of pressure from the matric potential is low (as the zone of unsaturation is thin);
hence mobility of surface water in the unsaturation zone to the saturate zone may occur readily. In summer
months when recharge is less, the matric potential increases causing absorbed water on the Chalk matrix to
he water table, maintaining recharge. Due to the thin unsaturation zone, it was believed
that in period of intense and sustained rainfall, flash flooding may occur as depth to water table may become
t for a long period, as fracture flow or lateral movement
(1999) working in Yorkshire, identified
steeply inclined normal faults approximately every 20 m, including one fault that contained a 0.5 m thick,
Pyecoomb East borehole has an unsaturated zone of about 60m. Effluent release and farmland irrigation
echarge occurring even period of low rainfall influx.
This site had high concentration of nitrate and chlorine when compared to the North Heath Barn. The high
concentration of nitrate and chlorine also further fortify the possibility of groundwater recharge from effluent
Phosphate, Sulphate – Chlorine,
he chemical variation of elements within the catchment area,
hence infer plausible trend to the source and movement of contaminants. Of the studied boreholes, Pyecombe
East had the highest concentration of Nitrate, Phosphate, Chlorine and Sulphate but the low concentrations of
Total Organic Content (TOC). The borehole at Pyecombe East is an effluent dispersal site with 60m of August
unsaturated zone. Therefore increased mixing of surface effluent recharge with groundwater is thought to be
e high concentration of these elements in the Chalk aquifer. These concentrations, in most cases,
ombe east was low, thus reflecting
The concentration of Nitrate and Chlorine is higher in the Preston park borehole compared to the North Heath
ed zone enhancing more rapid
movement of these elements without having to be absorbed on the weathered chalk matrix. The high
concentrations of these elements suggest an artificial recharge to groundwater from surface urban run-off and
Concentration of Phosphate, Sulphate and TOC is higher in the North Heath Barn borehole compared to
observed Preston park borehole. As already mentioned earlier, North Heath Barn is monitoring site with the
the three borehole sites. Pyrite oxidation as bypass flow within the thick
unsaturated zone may dissolve the marl formation causing an increase in the phosphate and sulphate
ty throughout the year and
gradual release of stored water from unweathered Chalk (to sustain the year round recharge) may carry along
organic matter from the Chalk formation, hence describing the high TOC concentration in the North Heath Barn
Of all the three studied boreholes, Pyecombe East (an effluent dispersal site) show high concentration of all
contaminants except TOC, highest in the North Heath Barn. Artificial recharge in the Preston park borehole
This paper investigated the impact of contaminants on groundwater flow chemistry and the quality of
ter depth (level) decreases to a minimum during winter
months of December through to January. Rainfall influx is as well predominantly greater in quantity and shows
less inconsistency than evapotranspiration rate in the borehole. The uniformity of the hydraulic conductivity is
thought to be due to the thickness of the unsaturated zone at North Heath Barn and Pyecoomb East. Except for
Preston Park, this has a much thinner unsaturated zone, which may influence the rapid water movement to the
ical variation of the boreholes studied showed the borehole at Pyecoomb East to be more of an effluent
Journal of Environment and Earth Science
ISSN 2224-3216 (Paper) ISSN 2225
Vol. 3, No.4, 2013
dispersal site due to the distribution of nitrate, Sulphate, chloride and Phosphate that has mixed with the
groundwater in the site. Distribution of Phos
derived from farming irrigation carried out in the area, which may have reached the water table through bypass
flow dissolving the marl formation. Artificial recharge of groundwater in the area ma
and Chloride concentrations in the Preston Park borehole.
Results from analysis using Raman Spectroscopy did not in this case yield any useful results but rather
ambiguous. The use of other techniques may yield results of hydroca
References
Aldrich, J., (2006). The status of groundwater resources and the groundwater needs of the environment. UK
groundwater Forum meeting “Planning for sustainable groundwater resources: something got to give”. Natur
History Museum, London, 30 March 2006.
Brouyere, S., (2006), Modelling the Migration of Contaminant through Variably Saturated Dual
Dual-permeability Chalk, Journal of Contaminant Hydrology
Chaplin, M.F. (2008). Water: its import
CLIMAWAT (2011). Water Quality Monitoring and Analysis. Available online
Accessed online 22nd
April, 2011.
Edmunds, C., 2008. Improved groundwater vulnerability mapping for the Karstic Chalk aquifer of south
England. Engineering Geology, 99:95
Egbuna, C.K. and Duvbiama, O.A. (2013).
Southwestern Nigeria. Journal. Civil Eng. Urban. 3(1): 25
Gallagher, A. J., Helen K., Rutter, David K. Buckley and Ian Molyneux. (2012). Lithostratigraphic controls on
recharge to the Chalk aquifer of Southern England,
Hydrogeology, 45:161-172.
Howden, N.J.K., Wheater, H.S., Peach, D.W., and Butler, A.P. (2004). Hydrogeological controls on
surface/groundwater interactions in a lowland permeable Chalk catchment.
Century, Volume II. British Hydrological Society.
Kemper, K.E. (2004). Groundwater
Louis, I.A. and Egbuna, C.K. (2012). Assessment of Ground
Eng. Urban, 2(6):214-219.
Lunzhang, S. (1994). Management of groundwater resources in China. Rome: FAO.
Nola, M., Njine, T., Djunikom, E. and Sikati, V. (2008). Faecal coliforms and faecal streptococci community in
the underground water in an equatorial area in Cameroun (Central Afric
environmental chemical factors. Water research
Pinault, J.L., Amraoui, N., and Golaz, C., (2005), Groundwater induced flooding in macropore
hydrological system in the context of climate change,
Price, M., Bird, M. J., Foster, S.S.D. (1976). Chalk pore
80:596–600.
Ravi, C., Palakodeti, Eugene, J., LeBoeuf, James, H. and Clarke (2009). Tool for assessment of process
importance at the groundwater/surface water interface.
WHO (2011). Guidelines for drinking
edition.
Zaidman, M.D., Middleton, R.T., West
the Chalk in Yorkshire. Quarterly Journal of Engineering Geology,
Journal of Environment and Earth Science
3216 (Paper) ISSN 2225-0948 (Online)
60
dispersal site due to the distribution of nitrate, Sulphate, chloride and Phosphate that has mixed with the
groundwater in the site. Distribution of Phosphate, Sulphate and TOC in the North Heath Barn borehole is
derived from farming irrigation carried out in the area, which may have reached the water table through bypass
flow dissolving the marl formation. Artificial recharge of groundwater in the area may be the result of Nitrate
and Chloride concentrations in the Preston Park borehole.
Results from analysis using Raman Spectroscopy did not in this case yield any useful results but rather
ambiguous. The use of other techniques may yield results of hydrocarbon traces from highway runoff.
Aldrich, J., (2006). The status of groundwater resources and the groundwater needs of the environment. UK
ndwater Forum meeting “Planning for sustainable groundwater resources: something got to give”. Natur
History Museum, London, 30 March 2006.
Brouyere, S., (2006), Modelling the Migration of Contaminant through Variably Saturated Dual
Journal of Contaminant Hydrology, 82:195-219.
Chaplin, M.F. (2008). Water: its importance to life. Biochemistry and Molecular Biology Education
CLIMAWAT (2011). Water Quality Monitoring and Analysis. Available online http://www.climawat.info/
, 2008. Improved groundwater vulnerability mapping for the Karstic Chalk aquifer of south
, 99:95-108.
Egbuna, C.K. and Duvbiama, O.A. (2013). Physicochemical Assessment of Groundwater Quality in Akure,
. Journal. Civil Eng. Urban. 3(1): 25-28. 2013
Gallagher, A. J., Helen K., Rutter, David K. Buckley and Ian Molyneux. (2012). Lithostratigraphic controls on
recharge to the Chalk aquifer of Southern England, Quarterly Journal of Engineering Geology and
Howden, N.J.K., Wheater, H.S., Peach, D.W., and Butler, A.P. (2004). Hydrogeological controls on
surface/groundwater interactions in a lowland permeable Chalk catchment. Science and Practice for the 21st
ydrological Society.
Kemper, K.E. (2004). Groundwater – from development to management. Hydrogeology journal
Louis, I.A. and Egbuna, C.K. (2012). Assessment of Ground-Water Quality in the South-East of England.
zhang, S. (1994). Management of groundwater resources in China. Rome: FAO.
Nola, M., Njine, T., Djunikom, E. and Sikati, V. (2008). Faecal coliforms and faecal streptococci community in
the underground water in an equatorial area in Cameroun (Central Africa): The importance of some
Water research, 36: 3289-3297.
Pinault, J.L., Amraoui, N., and Golaz, C., (2005), Groundwater induced flooding in macropore
hydrological system in the context of climate change, Water Resources Research, 41:16
Price, M., Bird, M. J., Foster, S.S.D. (1976). Chalk pore-size measurements and their significance Water Services,
Ravi, C., Palakodeti, Eugene, J., LeBoeuf, James, H. and Clarke (2009). Tool for assessment of process
portance at the groundwater/surface water interface. Journal of Environmental management
Guidelines for drinking-water quality: Water Sanitation Health. World Health Organization. Fourth
Zaidman, M.D., Middleton, R.T., West, L.J. (1999). Geophysical Investigation of unsaturated zone transport in
Quarterly Journal of Engineering Geology, 32: 185-198
www.iiste.org
dispersal site due to the distribution of nitrate, Sulphate, chloride and Phosphate that has mixed with the
phate, Sulphate and TOC in the North Heath Barn borehole is
derived from farming irrigation carried out in the area, which may have reached the water table through bypass
y be the result of Nitrate
Results from analysis using Raman Spectroscopy did not in this case yield any useful results but rather
rbon traces from highway runoff.
Aldrich, J., (2006). The status of groundwater resources and the groundwater needs of the environment. UK
ndwater Forum meeting “Planning for sustainable groundwater resources: something got to give”. Natural
Brouyere, S., (2006), Modelling the Migration of Contaminant through Variably Saturated Dual-porosity,
Biochemistry and Molecular Biology Education, 29:54-59.
http://www.climawat.info/.
, 2008. Improved groundwater vulnerability mapping for the Karstic Chalk aquifer of south-east
Physicochemical Assessment of Groundwater Quality in Akure,
Gallagher, A. J., Helen K., Rutter, David K. Buckley and Ian Molyneux. (2012). Lithostratigraphic controls on
Quarterly Journal of Engineering Geology and
Howden, N.J.K., Wheater, H.S., Peach, D.W., and Butler, A.P. (2004). Hydrogeological controls on
Science and Practice for the 21st
Hydrogeology journal 12:3-5
East of England. J. Civil
Nola, M., Njine, T., Djunikom, E. and Sikati, V. (2008). Faecal coliforms and faecal streptococci community in
a): The importance of some
Pinault, J.L., Amraoui, N., and Golaz, C., (2005), Groundwater induced flooding in macropore -dominated
size measurements and their significance Water Services,
Ravi, C., Palakodeti, Eugene, J., LeBoeuf, James, H. and Clarke (2009). Tool for assessment of process
Journal of Environmental management, 90:87-101.
water quality: Water Sanitation Health. World Health Organization. Fourth
Geophysical Investigation of unsaturated zone transport in
Journal of Environment and Earth Science
ISSN 2224-3216 (Paper) ISSN 2225
Vol. 3, No.4, 2013
Table 1: The World Health Organisation
Substance
Chloride
Total Dissolved Solids
Nitrate
Nitrite
Sulfate
Ammonium
Phosphate
Figure 1: Showing outcrop of the UK chalk aquifer (Edmonds, 2008)
Journal of Environment and Earth Science
3216 (Paper) ISSN 2225-0948 (Online)
61
World Health Organisation guideline value standard for various elements
WHO guideline values
250 mg/L
Total Dissolved Solids 500 mg/L
50 mg/L
1 mg/L
250 mg/L
Ammonium 0.1 mg/L
0.015 mg/L
Figure 1: Showing outcrop of the UK chalk aquifer (Edmonds, 2008)
www.iiste.org
standard for various elements (WHO, 2011)
WHO guideline values
Figure 1: Showing outcrop of the UK chalk aquifer (Edmonds, 2008)
Journal of Environment and Earth Science
ISSN 2224-3216 (Paper) ISSN 2225
Vol. 3, No.4, 2013
Figure 2: Map showing monitoring boreholes within Patcham catchment (CLIMAWAT 2011)
Figure 3
Journal of Environment and Earth Science
3216 (Paper) ISSN 2225-0948 (Online)
62
: Map showing monitoring boreholes within Patcham catchment (CLIMAWAT 2011)
Figure 3: Geologic map of Patcham (CLIMAWAT, 2011)
www.iiste.org
: Map showing monitoring boreholes within Patcham catchment (CLIMAWAT 2011)
Journal of Environment and Earth Science
ISSN 2224-3216 (Paper) ISSN 2225
Vol. 3, No.4, 2013
Figure 4: Conductivity –
Figure 5: Conductivity
67
67.5
68
68.5
69
69.5
70
70.5
71
WaterLevel(mbgl)
Water Level (m bgl) and Conductivity (msie/cm) plot
0
5
10
15
20
25
WaterLevel(mbgl)
Water level (m bgl) and Coductivity (msie/com) against time (days)
Journal of Environment and Earth Science
3216 (Paper) ISSN 2225-0948 (Online)
63
– Water depth plot against date in the North Heath Barn borehole.
: Conductivity – Water depth plot against date in the Preston Park borehole.
0.365
0.37
0.375
0.38
0.385
0.39
0.395
0.4
Conductivity(msie/cm)
Days
Water Level (m bgl) and Conductivity (msie/cm) plot
0.6
0.62
0.64
0.66
0.68
0.7
0.72
Conductivity(msie/cm)
Time (days)
Water level (m bgl) and Coductivity (msie/com) against time (days)
plot
www.iiste.org
Water depth plot against date in the North Heath Barn borehole.
ter depth plot against date in the Preston Park borehole.
Water Level
Conductivity
Water level (m bgl) and Coductivity (msie/com) against time (days)
Water Level
Conductivity
Journal of Environment and Earth Science
ISSN 2224-3216 (Paper) ISSN 2225
Vol. 3, No.4, 2013
Figure 6: Conductivity
Figure 7: Evapotranspiration
56.65
56.7
56.75
56.8
56.85
56.9
56.95
57
57.05
57.1
57.15
WaterLevel(mbgl)
Water Level (m bgl) and Conductivity (msie/cm) against Time
0
1
2
3
4
5
40708.5
40719
40730
40741
40752
40763
40774
40785
Evapotranspiration(mm)
Evapotranspiration (mm) and Rainfall (mm) against date (days)
Journal of Environment and Earth Science
3216 (Paper) ISSN 2225-0948 (Online)
64
Figure 6: Conductivity – Water depth plot against date in Pyecoomb East borehole.
: Evapotranspiration – Rainfall influx plot against date
0.64
0.66
0.68
0.7
0.72
0.74
0.76
0.78
0.8
Conductivity(msie/cm)
Time (days)
Water Level (m bgl) and Conductivity (msie/cm) against Time
(days) plot
40796
40807
40818
40829
40840
40851
40862
40873
40884
40895
40906
40917
40928
40939
40950
40961
40972
Date (days)
Evapotranspiration (mm) and Rainfall (mm) against date (days)
www.iiste.org
Water depth plot against date in Pyecoomb East borehole.
Water Level (m bgl) and Conductivity (msie/cm) against Time
Water level
Conductivity
0
5
10
15
20
25
30
35
40
40972
40983
40994
41005
Rainfall(mm)
Evapotranspiration (mm) and Rainfall (mm) against date (days)
Journal of Environment and Earth Science
ISSN 2224-3216 (Paper) ISSN 2225
Vol. 3, No.4, 2013
Figure 8: Element concentration
Figure 9: Element concentration
0
5
10
15
20
25
20/01/201100:00
20/02/201100:00
20/03/201100:00
20/04/201100:00
20/05/201100:00
20/06/201100:00
Concentration(mg/l)
Concentration (mg/l)
0
5
10
15
20
25
30
35
40
45
50
Concentration(mg/l)
Concentration (mg/l) against Time (days) plot
Journal of Environment and Earth Science
3216 (Paper) ISSN 2225-0948 (Online)
65
: Element concentration – date plot of North Heath Barn Borehole
Figure 9: Element concentration – date plot of Preston Park Borehole.
0
2
4
6
8
10
12
14
16
18
20/06/201100:00
20/07/201100:00
20/08/201100:00
20/09/201100:00
20/10/201100:00
20/11/201100:00
20/12/201100:00
20/01/201200:00
20/02/201200:00
Concentration(mg/l)
Time (days)
Concentration (mg/l) - Time (days) plot
Ammonium
Chlorine
Nitrate
Dissolved Oxygen
NO2
PO4
SO4
TOC
0
2
4
6
8
10
12
14
16
18
Concentration(mg/l)
Time (days)
Concentration (mg/l) against Time (days) plot
Chlorine
NO2
SO4
TOC
Ammonium
Nitrate
Dissolved Oxygen
PO4
www.iiste.org
of North Heath Barn Borehole
date plot of Preston Park Borehole.
Ammonium
Chlorine
Nitrate
Dissolved Oxygen
NO2
PO4
SO4
TOC
Chlorine
NO2
SO4
TOC
Ammonium
Nitrate
Dissolved Oxygen
PO4
Journal of Environment and Earth Science
ISSN 2224-3216 (Paper) ISSN 2225
Vol. 3, No.4, 2013
Figure 10: Element concentration
Figure 11: Raman spectra for samples from Patcham catchment.
0
20
40
60
80
100
120
20/11/2010…
21/11/2010…
22/11/2010…
23/11/2010…
24/11/2010…
25/11/2010…
Concentration(mg/l) Concentration (mg/l) against Time (Days) plot
Journal of Environment and Earth Science
3216 (Paper) ISSN 2225-0948 (Online)
66
: Element concentration – date plot of Pyecoomb East Borehole
Figure 11: Raman spectra for samples from Patcham catchment.
0
2
4
6
8
10
25/11/2010…
26/11/2010…
27/11/2010…
28/11/2010…
29/11/2010…
30/11/2010…
01/12/2010…
02/12/2010…
03/12/2010…
04/12/2010…
Concentration(mg/l)
Time (days)
Concentration (mg/l) against Time (Days) plot
www.iiste.org
date plot of Pyecoomb East Borehole
Ammonium
Nitrate
Dissolved Oxygen
Chlorine
PO4
SO4
NO2
TOC
This academic article was published by The International Institute for Science,
Technology and Education (IISTE). The IISTE is a pioneer in the Open Access
Publishing service based in the U.S. and Europe. The aim of the institute is
Accelerating Global Knowledge Sharing.
More information about the publisher can be found in the IISTE’s homepage:
http://www.iiste.org
CALL FOR PAPERS
The IISTE is currently hosting more than 30 peer-reviewed academic journals and
collaborating with academic institutions around the world. There’s no deadline for
submission. Prospective authors of IISTE journals can find the submission
instruction on the following page: http://www.iiste.org/Journals/
The IISTE editorial team promises to the review and publish all the qualified
submissions in a fast manner. All the journals articles are available online to the
readers all over the world without financial, legal, or technical barriers other than
those inseparable from gaining access to the internet itself. Printed version of the
journals is also available upon request of readers and authors.
IISTE Knowledge Sharing Partners
EBSCO, Index Copernicus, Ulrich's Periodicals Directory, JournalTOCS, PKP Open
Archives Harvester, Bielefeld Academic Search Engine, Elektronische
Zeitschriftenbibliothek EZB, Open J-Gate, OCLC WorldCat, Universe Digtial
Library , NewJour, Google Scholar

Contenu connexe

Tendances

UROP Finals Poster_Junior_Mazariegos
UROP Finals Poster_Junior_MazariegosUROP Finals Poster_Junior_Mazariegos
UROP Finals Poster_Junior_MazariegosJunior G. Mazariegos
 
Interrelationship between nutrients and chlorophyll-a in an urban stormwater ...
Interrelationship between nutrients and chlorophyll-a in an urban stormwater ...Interrelationship between nutrients and chlorophyll-a in an urban stormwater ...
Interrelationship between nutrients and chlorophyll-a in an urban stormwater ...Journal of Contemporary Urban Affairs
 
Assessment of physico chemical properties and sewage pollution
Assessment of physico chemical properties and sewage pollutionAssessment of physico chemical properties and sewage pollution
Assessment of physico chemical properties and sewage pollutionRaj111yqyqyq
 
coldwater conference poster revamp1
coldwater conference poster revamp1coldwater conference poster revamp1
coldwater conference poster revamp1Emily Mashuda
 
Environmental Qualitative assessment of rivers sediments
Environmental Qualitative assessment of rivers sedimentsEnvironmental Qualitative assessment of rivers sediments
Environmental Qualitative assessment of rivers sedimentsGJESM Publication
 
Water Quality Assessment through GIS: A Case Study of Sukhna Lake, Chandigarh...
Water Quality Assessment through GIS: A Case Study of Sukhna Lake, Chandigarh...Water Quality Assessment through GIS: A Case Study of Sukhna Lake, Chandigarh...
Water Quality Assessment through GIS: A Case Study of Sukhna Lake, Chandigarh...IRJET Journal
 
radio isotope in ground water study
radio isotope in ground water studyradio isotope in ground water study
radio isotope in ground water studypreethi durairaj
 
Hydrogeochemistry and Microbiology of Wadi Al Bih Limestone Aquifer in Northe...
Hydrogeochemistry and Microbiology of Wadi Al Bih Limestone Aquifer in Northe...Hydrogeochemistry and Microbiology of Wadi Al Bih Limestone Aquifer in Northe...
Hydrogeochemistry and Microbiology of Wadi Al Bih Limestone Aquifer in Northe...QUESTJOURNAL
 
Irrigation Water Quality Assessment for Water Resources used in Irrigation of...
Irrigation Water Quality Assessment for Water Resources used in Irrigation of...Irrigation Water Quality Assessment for Water Resources used in Irrigation of...
Irrigation Water Quality Assessment for Water Resources used in Irrigation of...Agriculture Journal IJOEAR
 
2009 assessment effects of cage culture on nitrogen
2009 assessment effects of cage culture on nitrogen2009 assessment effects of cage culture on nitrogen
2009 assessment effects of cage culture on nitrogenearambulm3
 
Quantitative water quality survey of wetland habitats at a contaminated brown...
Quantitative water quality survey of wetland habitats at a contaminated brown...Quantitative water quality survey of wetland habitats at a contaminated brown...
Quantitative water quality survey of wetland habitats at a contaminated brown...David Bryan
 
Water Quality Modeling for Groundwater, Surface Water, and Watersheds: Basic ...
Water Quality Modeling for Groundwater, Surface Water, and Watersheds: Basic ...Water Quality Modeling for Groundwater, Surface Water, and Watersheds: Basic ...
Water Quality Modeling for Groundwater, Surface Water, and Watersheds: Basic ...Nebraska Water Center
 
Baseline Water Study of 113 Wells in Chenango County, NY
Baseline Water Study of 113 Wells in Chenango County, NYBaseline Water Study of 113 Wells in Chenango County, NY
Baseline Water Study of 113 Wells in Chenango County, NYMarcellus Drilling News
 
Water and Health Issues and Opportunities
Water and Health Issues and OpportunitiesWater and Health Issues and Opportunities
Water and Health Issues and OpportunitiesNebraska Water Center
 
Water Quality Assessment of VIT University “Green” Lake Using GIS
Water Quality Assessment of VIT University “Green” Lake Using GISWater Quality Assessment of VIT University “Green” Lake Using GIS
Water Quality Assessment of VIT University “Green” Lake Using GISinventionjournals
 
Self purification of river-streams
Self purification of river-streamsSelf purification of river-streams
Self purification of river-streamsSatish Sharma
 

Tendances (20)

UROP Finals Poster_Junior_Mazariegos
UROP Finals Poster_Junior_MazariegosUROP Finals Poster_Junior_Mazariegos
UROP Finals Poster_Junior_Mazariegos
 
Interrelationship between nutrients and chlorophyll-a in an urban stormwater ...
Interrelationship between nutrients and chlorophyll-a in an urban stormwater ...Interrelationship between nutrients and chlorophyll-a in an urban stormwater ...
Interrelationship between nutrients and chlorophyll-a in an urban stormwater ...
 
Assessment of physico chemical properties and sewage pollution
Assessment of physico chemical properties and sewage pollutionAssessment of physico chemical properties and sewage pollution
Assessment of physico chemical properties and sewage pollution
 
coldwater conference poster revamp1
coldwater conference poster revamp1coldwater conference poster revamp1
coldwater conference poster revamp1
 
Environmental Qualitative assessment of rivers sediments
Environmental Qualitative assessment of rivers sedimentsEnvironmental Qualitative assessment of rivers sediments
Environmental Qualitative assessment of rivers sediments
 
Water Quality Assessment through GIS: A Case Study of Sukhna Lake, Chandigarh...
Water Quality Assessment through GIS: A Case Study of Sukhna Lake, Chandigarh...Water Quality Assessment through GIS: A Case Study of Sukhna Lake, Chandigarh...
Water Quality Assessment through GIS: A Case Study of Sukhna Lake, Chandigarh...
 
Isotope Hydrology
Isotope HydrologyIsotope Hydrology
Isotope Hydrology
 
radio isotope in ground water study
radio isotope in ground water studyradio isotope in ground water study
radio isotope in ground water study
 
Isotope hydrology
Isotope hydrologyIsotope hydrology
Isotope hydrology
 
Hydrogeochemistry and Microbiology of Wadi Al Bih Limestone Aquifer in Northe...
Hydrogeochemistry and Microbiology of Wadi Al Bih Limestone Aquifer in Northe...Hydrogeochemistry and Microbiology of Wadi Al Bih Limestone Aquifer in Northe...
Hydrogeochemistry and Microbiology of Wadi Al Bih Limestone Aquifer in Northe...
 
Irrigation Water Quality Assessment for Water Resources used in Irrigation of...
Irrigation Water Quality Assessment for Water Resources used in Irrigation of...Irrigation Water Quality Assessment for Water Resources used in Irrigation of...
Irrigation Water Quality Assessment for Water Resources used in Irrigation of...
 
Thesis_MS
Thesis_MSThesis_MS
Thesis_MS
 
Lake Water Environment Capacity Analysis Based on Steady-State Model
Lake Water Environment Capacity Analysis Based on Steady-State ModelLake Water Environment Capacity Analysis Based on Steady-State Model
Lake Water Environment Capacity Analysis Based on Steady-State Model
 
2009 assessment effects of cage culture on nitrogen
2009 assessment effects of cage culture on nitrogen2009 assessment effects of cage culture on nitrogen
2009 assessment effects of cage culture on nitrogen
 
Quantitative water quality survey of wetland habitats at a contaminated brown...
Quantitative water quality survey of wetland habitats at a contaminated brown...Quantitative water quality survey of wetland habitats at a contaminated brown...
Quantitative water quality survey of wetland habitats at a contaminated brown...
 
Water Quality Modeling for Groundwater, Surface Water, and Watersheds: Basic ...
Water Quality Modeling for Groundwater, Surface Water, and Watersheds: Basic ...Water Quality Modeling for Groundwater, Surface Water, and Watersheds: Basic ...
Water Quality Modeling for Groundwater, Surface Water, and Watersheds: Basic ...
 
Baseline Water Study of 113 Wells in Chenango County, NY
Baseline Water Study of 113 Wells in Chenango County, NYBaseline Water Study of 113 Wells in Chenango County, NY
Baseline Water Study of 113 Wells in Chenango County, NY
 
Water and Health Issues and Opportunities
Water and Health Issues and OpportunitiesWater and Health Issues and Opportunities
Water and Health Issues and Opportunities
 
Water Quality Assessment of VIT University “Green” Lake Using GIS
Water Quality Assessment of VIT University “Green” Lake Using GISWater Quality Assessment of VIT University “Green” Lake Using GIS
Water Quality Assessment of VIT University “Green” Lake Using GIS
 
Self purification of river-streams
Self purification of river-streamsSelf purification of river-streams
Self purification of river-streams
 

En vedette

Conferências saúdecuf mHealth presentation by David Doherty
Conferências saúdecuf mHealth presentation by David DohertyConferências saúdecuf mHealth presentation by David Doherty
Conferências saúdecuf mHealth presentation by David Doherty3GDR
 
Mobilni kuponi u retail industriji - Aleksandar Petkovic - biZbuZZ 2011
Mobilni kuponi u retail industriji - Aleksandar Petkovic - biZbuZZ 2011Mobilni kuponi u retail industriji - Aleksandar Petkovic - biZbuZZ 2011
Mobilni kuponi u retail industriji - Aleksandar Petkovic - biZbuZZ 2011biZbuZZ
 
Fleet Management Diagnostic Approach
Fleet Management Diagnostic ApproachFleet Management Diagnostic Approach
Fleet Management Diagnostic Approach722consulting
 
NCM David Kain 20 Group Presentation
NCM David Kain 20 Group PresentationNCM David Kain 20 Group Presentation
NCM David Kain 20 Group Presentation360Converge, Inc.
 
ECH Campus: Dr Martin Connor
ECH Campus: Dr Martin ConnorECH Campus: Dr Martin Connor
ECH Campus: Dr Martin Connor3GDR
 
Resources for Small Publishers (2011 CrossRef Workshops)
Resources for Small Publishers (2011 CrossRef Workshops)Resources for Small Publishers (2011 CrossRef Workshops)
Resources for Small Publishers (2011 CrossRef Workshops)Crossref
 
Groundwater project 8
Groundwater project 8Groundwater project 8
Groundwater project 8geosaibhaskar
 
Water treatment-WATER TREATMENT PROCESS-OZONISATION AND UV APPLICATION
Water treatment-WATER TREATMENT PROCESS-OZONISATION AND UV APPLICATIONWater treatment-WATER TREATMENT PROCESS-OZONISATION AND UV APPLICATION
Water treatment-WATER TREATMENT PROCESS-OZONISATION AND UV APPLICATIONGowri Prabhu
 
Groundwater Investigation Techniques-Geophysical Methods
Groundwater Investigation Techniques-Geophysical MethodsGroundwater Investigation Techniques-Geophysical Methods
Groundwater Investigation Techniques-Geophysical MethodsGowri Prabhu
 

En vedette (10)

Conferências saúdecuf mHealth presentation by David Doherty
Conferências saúdecuf mHealth presentation by David DohertyConferências saúdecuf mHealth presentation by David Doherty
Conferências saúdecuf mHealth presentation by David Doherty
 
Mobilni kuponi u retail industriji - Aleksandar Petkovic - biZbuZZ 2011
Mobilni kuponi u retail industriji - Aleksandar Petkovic - biZbuZZ 2011Mobilni kuponi u retail industriji - Aleksandar Petkovic - biZbuZZ 2011
Mobilni kuponi u retail industriji - Aleksandar Petkovic - biZbuZZ 2011
 
Fleet Management Diagnostic Approach
Fleet Management Diagnostic ApproachFleet Management Diagnostic Approach
Fleet Management Diagnostic Approach
 
NCM David Kain 20 Group Presentation
NCM David Kain 20 Group PresentationNCM David Kain 20 Group Presentation
NCM David Kain 20 Group Presentation
 
Final comenius sibenik_26082011_ik
Final comenius sibenik_26082011_ikFinal comenius sibenik_26082011_ik
Final comenius sibenik_26082011_ik
 
ECH Campus: Dr Martin Connor
ECH Campus: Dr Martin ConnorECH Campus: Dr Martin Connor
ECH Campus: Dr Martin Connor
 
Resources for Small Publishers (2011 CrossRef Workshops)
Resources for Small Publishers (2011 CrossRef Workshops)Resources for Small Publishers (2011 CrossRef Workshops)
Resources for Small Publishers (2011 CrossRef Workshops)
 
Groundwater project 8
Groundwater project 8Groundwater project 8
Groundwater project 8
 
Water treatment-WATER TREATMENT PROCESS-OZONISATION AND UV APPLICATION
Water treatment-WATER TREATMENT PROCESS-OZONISATION AND UV APPLICATIONWater treatment-WATER TREATMENT PROCESS-OZONISATION AND UV APPLICATION
Water treatment-WATER TREATMENT PROCESS-OZONISATION AND UV APPLICATION
 
Groundwater Investigation Techniques-Geophysical Methods
Groundwater Investigation Techniques-Geophysical MethodsGroundwater Investigation Techniques-Geophysical Methods
Groundwater Investigation Techniques-Geophysical Methods
 

Similaire à Impact of contaminants on groundwater quality in patcham, south east england.

Determination-Of-Sources-Of-Water-Pollution
Determination-Of-Sources-Of-Water-PollutionDetermination-Of-Sources-Of-Water-Pollution
Determination-Of-Sources-Of-Water-PollutionCOLLINS KUFFOUR
 
A STUDY ON THE IMPACT OF POLLUTION IN BELLANDUR LAKE DUE TO URBANIZATION
A STUDY ON THE IMPACT OF POLLUTION IN BELLANDUR LAKE DUE TO URBANIZATIONA STUDY ON THE IMPACT OF POLLUTION IN BELLANDUR LAKE DUE TO URBANIZATION
A STUDY ON THE IMPACT OF POLLUTION IN BELLANDUR LAKE DUE TO URBANIZATIONAmartya Jha
 
Yvonne Wetzig_AGU Poster 2015
Yvonne Wetzig_AGU Poster 2015Yvonne Wetzig_AGU Poster 2015
Yvonne Wetzig_AGU Poster 2015Yvonne Wetzig
 
Assessment of impact of climatic change on groundwater quality around igbokod...
Assessment of impact of climatic change on groundwater quality around igbokod...Assessment of impact of climatic change on groundwater quality around igbokod...
Assessment of impact of climatic change on groundwater quality around igbokod...Alexander Decker
 
Physico chemical characterization of the groundwater of kotur area hyderabad,...
Physico chemical characterization of the groundwater of kotur area hyderabad,...Physico chemical characterization of the groundwater of kotur area hyderabad,...
Physico chemical characterization of the groundwater of kotur area hyderabad,...Alexander Decker
 
Spatial distribution and environmental geochemistry of zinc metal in water an...
Spatial distribution and environmental geochemistry of zinc metal in water an...Spatial distribution and environmental geochemistry of zinc metal in water an...
Spatial distribution and environmental geochemistry of zinc metal in water an...Javier Quesada Duque
 
Assessment Of Lake Water Quality And Eutrophication Risk In An Agricultural I...
Assessment Of Lake Water Quality And Eutrophication Risk In An Agricultural I...Assessment Of Lake Water Quality And Eutrophication Risk In An Agricultural I...
Assessment Of Lake Water Quality And Eutrophication Risk In An Agricultural I...Amy Cernava
 
Evaluation of water quality index in the main drain river
Evaluation of water quality index in the main drain riverEvaluation of water quality index in the main drain river
Evaluation of water quality index in the main drain riverAlexander Decker
 
Water quality assessment and application of the hydrochemistry
Water quality assessment and application of the hydrochemistryWater quality assessment and application of the hydrochemistry
Water quality assessment and application of the hydrochemistryAlexander Decker
 
Zander 2007 - Allochthonous DOC in floodplain rivers
Zander 2007 - Allochthonous DOC in floodplain riversZander 2007 - Allochthonous DOC in floodplain rivers
Zander 2007 - Allochthonous DOC in floodplain riversAlek Zander
 
Sasha Poster Board Final- NH3
Sasha Poster Board Final- NH3Sasha Poster Board Final- NH3
Sasha Poster Board Final- NH3Sasha Heralall
 
Water Pollution and its Effect on Water Consumption in Akure
Water Pollution and its Effect on Water Consumption in AkureWater Pollution and its Effect on Water Consumption in Akure
Water Pollution and its Effect on Water Consumption in AkureAgriculture Journal IJOEAR
 
Evaluation of the Wastewater Quality Improvement by The Channel Located Downs...
Evaluation of the Wastewater Quality Improvement by The Channel Located Downs...Evaluation of the Wastewater Quality Improvement by The Channel Located Downs...
Evaluation of the Wastewater Quality Improvement by The Channel Located Downs...IRJESJOURNAL
 
Surface Water Quality in Thailand
Surface Water Quality in ThailandSurface Water Quality in Thailand
Surface Water Quality in ThailandJameieka
 
Qualitative Evaluation and Hydrogeochemical Attributes of Groundwater in Ower...
Qualitative Evaluation and Hydrogeochemical Attributes of Groundwater in Ower...Qualitative Evaluation and Hydrogeochemical Attributes of Groundwater in Ower...
Qualitative Evaluation and Hydrogeochemical Attributes of Groundwater in Ower...iosrjce
 

Similaire à Impact of contaminants on groundwater quality in patcham, south east england. (20)

Determination-Of-Sources-Of-Water-Pollution
Determination-Of-Sources-Of-Water-PollutionDetermination-Of-Sources-Of-Water-Pollution
Determination-Of-Sources-Of-Water-Pollution
 
A STUDY ON THE IMPACT OF POLLUTION IN BELLANDUR LAKE DUE TO URBANIZATION
A STUDY ON THE IMPACT OF POLLUTION IN BELLANDUR LAKE DUE TO URBANIZATIONA STUDY ON THE IMPACT OF POLLUTION IN BELLANDUR LAKE DUE TO URBANIZATION
A STUDY ON THE IMPACT OF POLLUTION IN BELLANDUR LAKE DUE TO URBANIZATION
 
Yvonne Wetzig_AGU Poster 2015
Yvonne Wetzig_AGU Poster 2015Yvonne Wetzig_AGU Poster 2015
Yvonne Wetzig_AGU Poster 2015
 
K41036370
K41036370K41036370
K41036370
 
Assessment of impact of climatic change on groundwater quality around igbokod...
Assessment of impact of climatic change on groundwater quality around igbokod...Assessment of impact of climatic change on groundwater quality around igbokod...
Assessment of impact of climatic change on groundwater quality around igbokod...
 
IMWA2009_Turner
IMWA2009_TurnerIMWA2009_Turner
IMWA2009_Turner
 
Physico chemical characterization of the groundwater of kotur area hyderabad,...
Physico chemical characterization of the groundwater of kotur area hyderabad,...Physico chemical characterization of the groundwater of kotur area hyderabad,...
Physico chemical characterization of the groundwater of kotur area hyderabad,...
 
Spatial distribution and environmental geochemistry of zinc metal in water an...
Spatial distribution and environmental geochemistry of zinc metal in water an...Spatial distribution and environmental geochemistry of zinc metal in water an...
Spatial distribution and environmental geochemistry of zinc metal in water an...
 
Assessment Of Lake Water Quality And Eutrophication Risk In An Agricultural I...
Assessment Of Lake Water Quality And Eutrophication Risk In An Agricultural I...Assessment Of Lake Water Quality And Eutrophication Risk In An Agricultural I...
Assessment Of Lake Water Quality And Eutrophication Risk In An Agricultural I...
 
Evaluation of water quality index in the main drain river
Evaluation of water quality index in the main drain riverEvaluation of water quality index in the main drain river
Evaluation of water quality index in the main drain river
 
Water quality assessment and application of the hydrochemistry
Water quality assessment and application of the hydrochemistryWater quality assessment and application of the hydrochemistry
Water quality assessment and application of the hydrochemistry
 
Zander 2007 - Allochthonous DOC in floodplain rivers
Zander 2007 - Allochthonous DOC in floodplain riversZander 2007 - Allochthonous DOC in floodplain rivers
Zander 2007 - Allochthonous DOC in floodplain rivers
 
Sasha Poster Board Final- NH3
Sasha Poster Board Final- NH3Sasha Poster Board Final- NH3
Sasha Poster Board Final- NH3
 
Canete 2014
Canete 2014Canete 2014
Canete 2014
 
Water Pollution and its Effect on Water Consumption in Akure
Water Pollution and its Effect on Water Consumption in AkureWater Pollution and its Effect on Water Consumption in Akure
Water Pollution and its Effect on Water Consumption in Akure
 
B035308017
B035308017B035308017
B035308017
 
Evaluation of the Wastewater Quality Improvement by The Channel Located Downs...
Evaluation of the Wastewater Quality Improvement by The Channel Located Downs...Evaluation of the Wastewater Quality Improvement by The Channel Located Downs...
Evaluation of the Wastewater Quality Improvement by The Channel Located Downs...
 
Surface Water Quality in Thailand
Surface Water Quality in ThailandSurface Water Quality in Thailand
Surface Water Quality in Thailand
 
water-07-01568
water-07-01568water-07-01568
water-07-01568
 
Qualitative Evaluation and Hydrogeochemical Attributes of Groundwater in Ower...
Qualitative Evaluation and Hydrogeochemical Attributes of Groundwater in Ower...Qualitative Evaluation and Hydrogeochemical Attributes of Groundwater in Ower...
Qualitative Evaluation and Hydrogeochemical Attributes of Groundwater in Ower...
 

Plus de Alexander Decker

Abnormalities of hormones and inflammatory cytokines in women affected with p...
Abnormalities of hormones and inflammatory cytokines in women affected with p...Abnormalities of hormones and inflammatory cytokines in women affected with p...
Abnormalities of hormones and inflammatory cytokines in women affected with p...Alexander Decker
 
A validation of the adverse childhood experiences scale in
A validation of the adverse childhood experiences scale inA validation of the adverse childhood experiences scale in
A validation of the adverse childhood experiences scale inAlexander Decker
 
A usability evaluation framework for b2 c e commerce websites
A usability evaluation framework for b2 c e commerce websitesA usability evaluation framework for b2 c e commerce websites
A usability evaluation framework for b2 c e commerce websitesAlexander Decker
 
A universal model for managing the marketing executives in nigerian banks
A universal model for managing the marketing executives in nigerian banksA universal model for managing the marketing executives in nigerian banks
A universal model for managing the marketing executives in nigerian banksAlexander Decker
 
A unique common fixed point theorems in generalized d
A unique common fixed point theorems in generalized dA unique common fixed point theorems in generalized d
A unique common fixed point theorems in generalized dAlexander Decker
 
A trends of salmonella and antibiotic resistance
A trends of salmonella and antibiotic resistanceA trends of salmonella and antibiotic resistance
A trends of salmonella and antibiotic resistanceAlexander Decker
 
A transformational generative approach towards understanding al-istifham
A transformational  generative approach towards understanding al-istifhamA transformational  generative approach towards understanding al-istifham
A transformational generative approach towards understanding al-istifhamAlexander Decker
 
A time series analysis of the determinants of savings in namibia
A time series analysis of the determinants of savings in namibiaA time series analysis of the determinants of savings in namibia
A time series analysis of the determinants of savings in namibiaAlexander Decker
 
A therapy for physical and mental fitness of school children
A therapy for physical and mental fitness of school childrenA therapy for physical and mental fitness of school children
A therapy for physical and mental fitness of school childrenAlexander Decker
 
A theory of efficiency for managing the marketing executives in nigerian banks
A theory of efficiency for managing the marketing executives in nigerian banksA theory of efficiency for managing the marketing executives in nigerian banks
A theory of efficiency for managing the marketing executives in nigerian banksAlexander Decker
 
A systematic evaluation of link budget for
A systematic evaluation of link budget forA systematic evaluation of link budget for
A systematic evaluation of link budget forAlexander Decker
 
A synthetic review of contraceptive supplies in punjab
A synthetic review of contraceptive supplies in punjabA synthetic review of contraceptive supplies in punjab
A synthetic review of contraceptive supplies in punjabAlexander Decker
 
A synthesis of taylor’s and fayol’s management approaches for managing market...
A synthesis of taylor’s and fayol’s management approaches for managing market...A synthesis of taylor’s and fayol’s management approaches for managing market...
A synthesis of taylor’s and fayol’s management approaches for managing market...Alexander Decker
 
A survey paper on sequence pattern mining with incremental
A survey paper on sequence pattern mining with incrementalA survey paper on sequence pattern mining with incremental
A survey paper on sequence pattern mining with incrementalAlexander Decker
 
A survey on live virtual machine migrations and its techniques
A survey on live virtual machine migrations and its techniquesA survey on live virtual machine migrations and its techniques
A survey on live virtual machine migrations and its techniquesAlexander Decker
 
A survey on data mining and analysis in hadoop and mongo db
A survey on data mining and analysis in hadoop and mongo dbA survey on data mining and analysis in hadoop and mongo db
A survey on data mining and analysis in hadoop and mongo dbAlexander Decker
 
A survey on challenges to the media cloud
A survey on challenges to the media cloudA survey on challenges to the media cloud
A survey on challenges to the media cloudAlexander Decker
 
A survey of provenance leveraged
A survey of provenance leveragedA survey of provenance leveraged
A survey of provenance leveragedAlexander Decker
 
A survey of private equity investments in kenya
A survey of private equity investments in kenyaA survey of private equity investments in kenya
A survey of private equity investments in kenyaAlexander Decker
 
A study to measures the financial health of
A study to measures the financial health ofA study to measures the financial health of
A study to measures the financial health ofAlexander Decker
 

Plus de Alexander Decker (20)

Abnormalities of hormones and inflammatory cytokines in women affected with p...
Abnormalities of hormones and inflammatory cytokines in women affected with p...Abnormalities of hormones and inflammatory cytokines in women affected with p...
Abnormalities of hormones and inflammatory cytokines in women affected with p...
 
A validation of the adverse childhood experiences scale in
A validation of the adverse childhood experiences scale inA validation of the adverse childhood experiences scale in
A validation of the adverse childhood experiences scale in
 
A usability evaluation framework for b2 c e commerce websites
A usability evaluation framework for b2 c e commerce websitesA usability evaluation framework for b2 c e commerce websites
A usability evaluation framework for b2 c e commerce websites
 
A universal model for managing the marketing executives in nigerian banks
A universal model for managing the marketing executives in nigerian banksA universal model for managing the marketing executives in nigerian banks
A universal model for managing the marketing executives in nigerian banks
 
A unique common fixed point theorems in generalized d
A unique common fixed point theorems in generalized dA unique common fixed point theorems in generalized d
A unique common fixed point theorems in generalized d
 
A trends of salmonella and antibiotic resistance
A trends of salmonella and antibiotic resistanceA trends of salmonella and antibiotic resistance
A trends of salmonella and antibiotic resistance
 
A transformational generative approach towards understanding al-istifham
A transformational  generative approach towards understanding al-istifhamA transformational  generative approach towards understanding al-istifham
A transformational generative approach towards understanding al-istifham
 
A time series analysis of the determinants of savings in namibia
A time series analysis of the determinants of savings in namibiaA time series analysis of the determinants of savings in namibia
A time series analysis of the determinants of savings in namibia
 
A therapy for physical and mental fitness of school children
A therapy for physical and mental fitness of school childrenA therapy for physical and mental fitness of school children
A therapy for physical and mental fitness of school children
 
A theory of efficiency for managing the marketing executives in nigerian banks
A theory of efficiency for managing the marketing executives in nigerian banksA theory of efficiency for managing the marketing executives in nigerian banks
A theory of efficiency for managing the marketing executives in nigerian banks
 
A systematic evaluation of link budget for
A systematic evaluation of link budget forA systematic evaluation of link budget for
A systematic evaluation of link budget for
 
A synthetic review of contraceptive supplies in punjab
A synthetic review of contraceptive supplies in punjabA synthetic review of contraceptive supplies in punjab
A synthetic review of contraceptive supplies in punjab
 
A synthesis of taylor’s and fayol’s management approaches for managing market...
A synthesis of taylor’s and fayol’s management approaches for managing market...A synthesis of taylor’s and fayol’s management approaches for managing market...
A synthesis of taylor’s and fayol’s management approaches for managing market...
 
A survey paper on sequence pattern mining with incremental
A survey paper on sequence pattern mining with incrementalA survey paper on sequence pattern mining with incremental
A survey paper on sequence pattern mining with incremental
 
A survey on live virtual machine migrations and its techniques
A survey on live virtual machine migrations and its techniquesA survey on live virtual machine migrations and its techniques
A survey on live virtual machine migrations and its techniques
 
A survey on data mining and analysis in hadoop and mongo db
A survey on data mining and analysis in hadoop and mongo dbA survey on data mining and analysis in hadoop and mongo db
A survey on data mining and analysis in hadoop and mongo db
 
A survey on challenges to the media cloud
A survey on challenges to the media cloudA survey on challenges to the media cloud
A survey on challenges to the media cloud
 
A survey of provenance leveraged
A survey of provenance leveragedA survey of provenance leveraged
A survey of provenance leveraged
 
A survey of private equity investments in kenya
A survey of private equity investments in kenyaA survey of private equity investments in kenya
A survey of private equity investments in kenya
 
A study to measures the financial health of
A study to measures the financial health ofA study to measures the financial health of
A study to measures the financial health of
 

Dernier

Generative Artificial Intelligence: How generative AI works.pdf
Generative Artificial Intelligence: How generative AI works.pdfGenerative Artificial Intelligence: How generative AI works.pdf
Generative Artificial Intelligence: How generative AI works.pdfIngrid Airi González
 
React Native vs Ionic - The Best Mobile App Framework
React Native vs Ionic - The Best Mobile App FrameworkReact Native vs Ionic - The Best Mobile App Framework
React Native vs Ionic - The Best Mobile App FrameworkPixlogix Infotech
 
Transcript: New from BookNet Canada for 2024: Loan Stars - Tech Forum 2024
Transcript: New from BookNet Canada for 2024: Loan Stars - Tech Forum 2024Transcript: New from BookNet Canada for 2024: Loan Stars - Tech Forum 2024
Transcript: New from BookNet Canada for 2024: Loan Stars - Tech Forum 2024BookNet Canada
 
Design pattern talk by Kaya Weers - 2024 (v2)
Design pattern talk by Kaya Weers - 2024 (v2)Design pattern talk by Kaya Weers - 2024 (v2)
Design pattern talk by Kaya Weers - 2024 (v2)Kaya Weers
 
Generative AI - Gitex v1Generative AI - Gitex v1.pptx
Generative AI - Gitex v1Generative AI - Gitex v1.pptxGenerative AI - Gitex v1Generative AI - Gitex v1.pptx
Generative AI - Gitex v1Generative AI - Gitex v1.pptxfnnc6jmgwh
 
Potential of AI (Generative AI) in Business: Learnings and Insights
Potential of AI (Generative AI) in Business: Learnings and InsightsPotential of AI (Generative AI) in Business: Learnings and Insights
Potential of AI (Generative AI) in Business: Learnings and InsightsRavi Sanghani
 
TrustArc Webinar - How to Build Consumer Trust Through Data Privacy
TrustArc Webinar - How to Build Consumer Trust Through Data PrivacyTrustArc Webinar - How to Build Consumer Trust Through Data Privacy
TrustArc Webinar - How to Build Consumer Trust Through Data PrivacyTrustArc
 
So einfach geht modernes Roaming fuer Notes und Nomad.pdf
So einfach geht modernes Roaming fuer Notes und Nomad.pdfSo einfach geht modernes Roaming fuer Notes und Nomad.pdf
So einfach geht modernes Roaming fuer Notes und Nomad.pdfpanagenda
 
Emixa Mendix Meetup 11 April 2024 about Mendix Native development
Emixa Mendix Meetup 11 April 2024 about Mendix Native developmentEmixa Mendix Meetup 11 April 2024 about Mendix Native development
Emixa Mendix Meetup 11 April 2024 about Mendix Native developmentPim van der Noll
 
The Future Roadmap for the Composable Data Stack - Wes McKinney - Data Counci...
The Future Roadmap for the Composable Data Stack - Wes McKinney - Data Counci...The Future Roadmap for the Composable Data Stack - Wes McKinney - Data Counci...
The Future Roadmap for the Composable Data Stack - Wes McKinney - Data Counci...Wes McKinney
 
Long journey of Ruby standard library at RubyConf AU 2024
Long journey of Ruby standard library at RubyConf AU 2024Long journey of Ruby standard library at RubyConf AU 2024
Long journey of Ruby standard library at RubyConf AU 2024Hiroshi SHIBATA
 
Genislab builds better products and faster go-to-market with Lean project man...
Genislab builds better products and faster go-to-market with Lean project man...Genislab builds better products and faster go-to-market with Lean project man...
Genislab builds better products and faster go-to-market with Lean project man...Farhan Tariq
 
[Webinar] SpiraTest - Setting New Standards in Quality Assurance
[Webinar] SpiraTest - Setting New Standards in Quality Assurance[Webinar] SpiraTest - Setting New Standards in Quality Assurance
[Webinar] SpiraTest - Setting New Standards in Quality AssuranceInflectra
 
Arizona Broadband Policy Past, Present, and Future Presentation 3/25/24
Arizona Broadband Policy Past, Present, and Future Presentation 3/25/24Arizona Broadband Policy Past, Present, and Future Presentation 3/25/24
Arizona Broadband Policy Past, Present, and Future Presentation 3/25/24Mark Goldstein
 
QCon London: Mastering long-running processes in modern architectures
QCon London: Mastering long-running processes in modern architecturesQCon London: Mastering long-running processes in modern architectures
QCon London: Mastering long-running processes in modern architecturesBernd Ruecker
 
Abdul Kader Baba- Managing Cybersecurity Risks and Compliance Requirements i...
Abdul Kader Baba- Managing Cybersecurity Risks  and Compliance Requirements i...Abdul Kader Baba- Managing Cybersecurity Risks  and Compliance Requirements i...
Abdul Kader Baba- Managing Cybersecurity Risks and Compliance Requirements i...itnewsafrica
 
Decarbonising Buildings: Making a net-zero built environment a reality
Decarbonising Buildings: Making a net-zero built environment a realityDecarbonising Buildings: Making a net-zero built environment a reality
Decarbonising Buildings: Making a net-zero built environment a realityIES VE
 
How to write a Business Continuity Plan
How to write a Business Continuity PlanHow to write a Business Continuity Plan
How to write a Business Continuity PlanDatabarracks
 
Microsoft 365 Copilot: How to boost your productivity with AI – Part one: Ado...
Microsoft 365 Copilot: How to boost your productivity with AI – Part one: Ado...Microsoft 365 Copilot: How to boost your productivity with AI – Part one: Ado...
Microsoft 365 Copilot: How to boost your productivity with AI – Part one: Ado...Nikki Chapple
 
The Fit for Passkeys for Employee and Consumer Sign-ins: FIDO Paris Seminar.pptx
The Fit for Passkeys for Employee and Consumer Sign-ins: FIDO Paris Seminar.pptxThe Fit for Passkeys for Employee and Consumer Sign-ins: FIDO Paris Seminar.pptx
The Fit for Passkeys for Employee and Consumer Sign-ins: FIDO Paris Seminar.pptxLoriGlavin3
 

Dernier (20)

Generative Artificial Intelligence: How generative AI works.pdf
Generative Artificial Intelligence: How generative AI works.pdfGenerative Artificial Intelligence: How generative AI works.pdf
Generative Artificial Intelligence: How generative AI works.pdf
 
React Native vs Ionic - The Best Mobile App Framework
React Native vs Ionic - The Best Mobile App FrameworkReact Native vs Ionic - The Best Mobile App Framework
React Native vs Ionic - The Best Mobile App Framework
 
Transcript: New from BookNet Canada for 2024: Loan Stars - Tech Forum 2024
Transcript: New from BookNet Canada for 2024: Loan Stars - Tech Forum 2024Transcript: New from BookNet Canada for 2024: Loan Stars - Tech Forum 2024
Transcript: New from BookNet Canada for 2024: Loan Stars - Tech Forum 2024
 
Design pattern talk by Kaya Weers - 2024 (v2)
Design pattern talk by Kaya Weers - 2024 (v2)Design pattern talk by Kaya Weers - 2024 (v2)
Design pattern talk by Kaya Weers - 2024 (v2)
 
Generative AI - Gitex v1Generative AI - Gitex v1.pptx
Generative AI - Gitex v1Generative AI - Gitex v1.pptxGenerative AI - Gitex v1Generative AI - Gitex v1.pptx
Generative AI - Gitex v1Generative AI - Gitex v1.pptx
 
Potential of AI (Generative AI) in Business: Learnings and Insights
Potential of AI (Generative AI) in Business: Learnings and InsightsPotential of AI (Generative AI) in Business: Learnings and Insights
Potential of AI (Generative AI) in Business: Learnings and Insights
 
TrustArc Webinar - How to Build Consumer Trust Through Data Privacy
TrustArc Webinar - How to Build Consumer Trust Through Data PrivacyTrustArc Webinar - How to Build Consumer Trust Through Data Privacy
TrustArc Webinar - How to Build Consumer Trust Through Data Privacy
 
So einfach geht modernes Roaming fuer Notes und Nomad.pdf
So einfach geht modernes Roaming fuer Notes und Nomad.pdfSo einfach geht modernes Roaming fuer Notes und Nomad.pdf
So einfach geht modernes Roaming fuer Notes und Nomad.pdf
 
Emixa Mendix Meetup 11 April 2024 about Mendix Native development
Emixa Mendix Meetup 11 April 2024 about Mendix Native developmentEmixa Mendix Meetup 11 April 2024 about Mendix Native development
Emixa Mendix Meetup 11 April 2024 about Mendix Native development
 
The Future Roadmap for the Composable Data Stack - Wes McKinney - Data Counci...
The Future Roadmap for the Composable Data Stack - Wes McKinney - Data Counci...The Future Roadmap for the Composable Data Stack - Wes McKinney - Data Counci...
The Future Roadmap for the Composable Data Stack - Wes McKinney - Data Counci...
 
Long journey of Ruby standard library at RubyConf AU 2024
Long journey of Ruby standard library at RubyConf AU 2024Long journey of Ruby standard library at RubyConf AU 2024
Long journey of Ruby standard library at RubyConf AU 2024
 
Genislab builds better products and faster go-to-market with Lean project man...
Genislab builds better products and faster go-to-market with Lean project man...Genislab builds better products and faster go-to-market with Lean project man...
Genislab builds better products and faster go-to-market with Lean project man...
 
[Webinar] SpiraTest - Setting New Standards in Quality Assurance
[Webinar] SpiraTest - Setting New Standards in Quality Assurance[Webinar] SpiraTest - Setting New Standards in Quality Assurance
[Webinar] SpiraTest - Setting New Standards in Quality Assurance
 
Arizona Broadband Policy Past, Present, and Future Presentation 3/25/24
Arizona Broadband Policy Past, Present, and Future Presentation 3/25/24Arizona Broadband Policy Past, Present, and Future Presentation 3/25/24
Arizona Broadband Policy Past, Present, and Future Presentation 3/25/24
 
QCon London: Mastering long-running processes in modern architectures
QCon London: Mastering long-running processes in modern architecturesQCon London: Mastering long-running processes in modern architectures
QCon London: Mastering long-running processes in modern architectures
 
Abdul Kader Baba- Managing Cybersecurity Risks and Compliance Requirements i...
Abdul Kader Baba- Managing Cybersecurity Risks  and Compliance Requirements i...Abdul Kader Baba- Managing Cybersecurity Risks  and Compliance Requirements i...
Abdul Kader Baba- Managing Cybersecurity Risks and Compliance Requirements i...
 
Decarbonising Buildings: Making a net-zero built environment a reality
Decarbonising Buildings: Making a net-zero built environment a realityDecarbonising Buildings: Making a net-zero built environment a reality
Decarbonising Buildings: Making a net-zero built environment a reality
 
How to write a Business Continuity Plan
How to write a Business Continuity PlanHow to write a Business Continuity Plan
How to write a Business Continuity Plan
 
Microsoft 365 Copilot: How to boost your productivity with AI – Part one: Ado...
Microsoft 365 Copilot: How to boost your productivity with AI – Part one: Ado...Microsoft 365 Copilot: How to boost your productivity with AI – Part one: Ado...
Microsoft 365 Copilot: How to boost your productivity with AI – Part one: Ado...
 
The Fit for Passkeys for Employee and Consumer Sign-ins: FIDO Paris Seminar.pptx
The Fit for Passkeys for Employee and Consumer Sign-ins: FIDO Paris Seminar.pptxThe Fit for Passkeys for Employee and Consumer Sign-ins: FIDO Paris Seminar.pptx
The Fit for Passkeys for Employee and Consumer Sign-ins: FIDO Paris Seminar.pptx
 

Impact of contaminants on groundwater quality in patcham, south east england.

  • 1. Journal of Environment and Earth Science ISSN 2224-3216 (Paper) ISSN 2225 Vol. 3, No.4, 2013 Impact of contaminants on groundwater quality in Patcham, Egbuna Chukwuemeka Kingsley 1. Department of Civil Engineering, 2. Department of Geology, University of Brig * E-mail of the corresponding author: Abstract This paper investigated the impact o groundwater in Patcham, South-East England. Data, obtained from the Campbell scientific weather station installed in the Patcham catchment and Schlumberger Water Services (SWS), were used to i mechanism and potential contaminant flow paths through the Chalk unsat deployed in three boreholes present within the catchment. Laboratory and analytical techniques such as Raman spectroscopy, Hach Spectrophotometer and YSI Multimeter equipped with Ion selective electrode were used to investigate the influence of these contaminates on groundwater flow chemistry and quality from the seven boreholes sites was studied. This research used the data obtained f the field to analyse and examine the quality trend observing for major environmental pollutants. Results showed that all the water parameters analysed were within the WHO guideline values, thus indicating that the this area is quite safe for usage. Keywords: Contaminants, groundwater, Chalk, water table, water chemistry 1. Introduction Groundwater is a great natural resource. It is estimated that universally, over 2 billion people depend mainly on groundwater for their daily need (Chaplin, 2001; Kemper, 2004: Egbuna and Duvbiama, 2013). Majority of the world’s industries as well as large number of world’s agriculture and irrigation mostly depend on groundwater. In regions like Tunisia, with prominent dry agricultural development is widely considered (Ravi groundwater to life. Groundwater is known to usually have a suitable quality (Nola Egbuna, 2012) although depending on the hydrological condition it may also be of poor condition. The Chalk aquifer is an important source of water in North West Europe, particularly in the United Kingdom, Belgium, North of France and Germany. In south east of England, the Chalk aquifer provides about 40% of all potable water and about 80% of total water (Pinault of UK groundwater-abstracted drinking water (Howden 60% of the chalk aquifer recharge are extracted and used as water supply in the UK. However, the sustainability of groundwater reduces by the day all over the world, problems of depletion due to use without salinization and pollution or other human activities affects groundwater. In a study by Lunzhang (1994) in the Henan province of China, results showed a decline of 0.75 monitoring the water table from 358 observation wells in approximately 2million hectares of irrigated lands. Chalk aquifers are usually karstic in nature, which means that they contain holes otherwise known as swallow (sink) holes that may allow infiltration of surface pollutants factors such as increasing population and development, personal water consumption increase, impacts of pollution (hydrocarbon) and climate change have put the groundwater from the English chalk aquifer under gre pressure (Edmunds, 2008). Figure 1 shows the outcrop of the UK chalk aquifer The chalk has proven to be a good aquifer due its porosity and permeability, but the karstic nature of it makes it quite easy for surface contaminants to infiltrate into the a in nature, this solubility makes possible the presence of features in a chalk such as solution pipes, swallow holes and also sink holes. These are surface features that appear as subsidence sinkholes extend to depths. Studies carried out have confirmed the existence of such features and are characterized by the dry valley uplands rather than forming surface streams from rainwater (Edmonds, 2008). Thus, this paper aims to investigate the impact of contaminants on groundwater flow chemistry and the quality of groundwater in the Patcham Catchment, UK. 2. Study Area Patcham, the study area is situated in the City of Brighton and Hove, East Sussex, South East England. Patcham Journal of Environment and Earth Science 3216 (Paper) ISSN 2225-0948 (Online) 55 Impact of contaminants on groundwater quality in Patcham, South East England. Egbuna Chukwuemeka Kingsley1* Musa Abba Jato2 Department of Civil Engineering, University of Bristol, United Kingdom Department of Geology, University of Brighton, United Kingdom mail of the corresponding author: cke10@uni.brighton.ac.uk This paper investigated the impact of contaminants on groundwater flow chemistry and the quality of East England. Data, obtained from the Campbell scientific weather station installed in the Patcham catchment and Schlumberger Water Services (SWS), were used to i mechanism and potential contaminant flow paths through the Chalk unsaturated zone. CTD Divers were also deployed in three boreholes present within the catchment. Laboratory and analytical techniques such as Raman trophotometer and YSI Multimeter equipped with Ion selective electrode were used to investigate the influence of these contaminates on groundwater flow chemistry and quality from the seven boreholes sites was studied. This research used the data obtained from the loggers and samples collected from the field to analyse and examine the quality trend observing for major environmental pollutants. Results showed that all the water parameters analysed were within the WHO guideline values, thus indicating that the Contaminants, groundwater, Chalk, water table, water chemistry Groundwater is a great natural resource. It is estimated that universally, over 2 billion people depend mainly on ater for their daily need (Chaplin, 2001; Kemper, 2004: Egbuna and Duvbiama, 2013). Majority of the world’s industries as well as large number of world’s agriculture and irrigation mostly depend on groundwater. In regions like Tunisia, with prominent dry season, groundwater is used as a primary source of irrigation in agricultural development is widely considered (Ravi et al., 2009). This further illustrates the necessity of groundwater to life. Groundwater is known to usually have a suitable quality (Nola et al. Egbuna, 2012) although depending on the hydrological condition it may also be of poor condition. The Chalk aquifer is an important source of water in North West Europe, particularly in the United Kingdom, and Germany. In south east of England, the Chalk aquifer provides about 40% of all potable water and about 80% of total water (Pinault et al., 2005; Brouyere, 2006). The Chalk also provides 55% abstracted drinking water (Howden et al., 2004). Aldrich (2006) further expressed that about 60% of the chalk aquifer recharge are extracted and used as water supply in the UK. However, the sustainability of groundwater reduces by the day all over the world, problems of depletion due to use without salinization and pollution or other human activities affects groundwater. In a study by Lunzhang (1994) in the Henan province of China, results showed a decline of 0.75-3.68m from 1975-1987 of the water table, after from 358 observation wells in approximately 2million hectares of irrigated lands. Chalk aquifers are usually karstic in nature, which means that they contain holes otherwise known as swallow (sink) holes that may allow infiltration of surface pollutants having contaminants in them. However, recent factors such as increasing population and development, personal water consumption increase, impacts of pollution (hydrocarbon) and climate change have put the groundwater from the English chalk aquifer under gre pressure (Edmunds, 2008). Figure 1 shows the outcrop of the UK chalk aquifer The chalk has proven to be a good aquifer due its porosity and permeability, but the karstic nature of it makes it quite easy for surface contaminants to infiltrate into the aquifer. Chalk is a carbonate rock and therefore soluble in nature, this solubility makes possible the presence of features in a chalk such as solution pipes, swallow holes and also sink holes. These are surface features that appear as subsidence sinkholes or pipe like features that extend to depths. Studies carried out have confirmed the existence of such features and are characterized by the dry valley uplands rather than forming surface streams from rainwater (Edmonds, 2008). Thus, this paper aims to stigate the impact of contaminants on groundwater flow chemistry and the quality of groundwater in the Patcham, the study area is situated in the City of Brighton and Hove, East Sussex, South East England. Patcham www.iiste.org Impact of contaminants on groundwater quality in Patcham, cke10@uni.brighton.ac.uk f contaminants on groundwater flow chemistry and the quality of East England. Data, obtained from the Campbell scientific weather station installed in the Patcham catchment and Schlumberger Water Services (SWS), were used to investigate recharge urated zone. CTD Divers were also deployed in three boreholes present within the catchment. Laboratory and analytical techniques such as Raman trophotometer and YSI Multimeter equipped with Ion selective electrode were used to investigate the influence of these contaminates on groundwater flow chemistry and quality from the seven rom the loggers and samples collected from the field to analyse and examine the quality trend observing for major environmental pollutants. Results showed that all the water parameters analysed were within the WHO guideline values, thus indicating that the water in Groundwater is a great natural resource. It is estimated that universally, over 2 billion people depend mainly on ater for their daily need (Chaplin, 2001; Kemper, 2004: Egbuna and Duvbiama, 2013). Majority of the world’s industries as well as large number of world’s agriculture and irrigation mostly depend on groundwater. season, groundwater is used as a primary source of irrigation in ., 2009). This further illustrates the necessity of et al., 2008: Louis and Egbuna, 2012) although depending on the hydrological condition it may also be of poor condition. The Chalk aquifer is an important source of water in North West Europe, particularly in the United Kingdom, and Germany. In south east of England, the Chalk aquifer provides about 40% of all ., 2005; Brouyere, 2006). The Chalk also provides 55% Aldrich (2006) further expressed that about 60% of the chalk aquifer recharge are extracted and used as water supply in the UK. However, the sustainability of groundwater reduces by the day all over the world, problems of depletion due to use without replacement, salinization and pollution or other human activities affects groundwater. In a study by Lunzhang (1994) in the 1987 of the water table, after from 358 observation wells in approximately 2million hectares of irrigated lands. Chalk aquifers are usually karstic in nature, which means that they contain holes otherwise known as swallow having contaminants in them. However, recent factors such as increasing population and development, personal water consumption increase, impacts of pollution (hydrocarbon) and climate change have put the groundwater from the English chalk aquifer under great The chalk has proven to be a good aquifer due its porosity and permeability, but the karstic nature of it makes it quifer. Chalk is a carbonate rock and therefore soluble in nature, this solubility makes possible the presence of features in a chalk such as solution pipes, swallow holes or pipe like features that extend to depths. Studies carried out have confirmed the existence of such features and are characterized by the dry valley uplands rather than forming surface streams from rainwater (Edmonds, 2008). Thus, this paper aims to stigate the impact of contaminants on groundwater flow chemistry and the quality of groundwater in the Patcham, the study area is situated in the City of Brighton and Hove, East Sussex, South East England. Patcham
  • 2. Journal of Environment and Earth Science ISSN 2224-3216 (Paper) ISSN 2225 Vol. 3, No.4, 2013 is approximately about 4.5km north of the city centre; the A27 road bounds it to the north, with Hollingbury to the East, Withdean to the south and the Brighton mainline to the West. The A23 road passes through Patcham. Figure 2 is a map of the Patcham catchme where samples for this project work where collected. The UK chalk aquifer is cretaceous in age and covers a wide extent of England. Starting from Yorkshire up north moving down the east coast through Lincolnshire and to East Anglia, turning south westwards, forming the Chiltern Hills and moving west to Wiltshire. Dipping in the direction south east, if forms the anticlinal flexure with a simple rise through north Hampshire and North Down the anticline. The chalk then continues to the west with a southward dip until Dorset (Edmonds, 2008). 2.1 Geology of the Area A geological map of the study area (Patcham) displayed a complex geology (fol 3 shows the geologic map of the Patcham catchment. The geology of South East England is characterized by Chalk forming its aquifer, which has a dual porosity (matrix and fracture). Surface pollutants can easily be transp Patcham, a highway (A23) passes through the borehole possible for hydrocarbon runoff to the groundwater due to the nature of the aquifer. 3. Methodology Records of evapotranspiration, conductivity, rainfall fluxes and water table depth all contributed to the monitoring of the influence of these contaminates on groundwater. Data, obtained from a Campbell scientific weather station installed in the study investigate recharge mechanism and potential contaminant flow paths through the Chalk unsaturated zone. CTD Divers were also deployed in three boreholes present within the catchment (i.e. North and Pyecoomb East). Using laboratory and analytical techniques such as Raman spectroscopy, Hach Spectrophotometer and YSI Multimeter equipped with Ion selective electrode were used to investigate the influence of these contaminates groundwater flow chemistry and quality from the seven boreholes sites was studied. 3.1 Data Collection and sampling Data collection included visits to borehole monitoring sites where samples of water was collected from each of the seven sites of monitoring boreholes available within the Patcham catchment area. Pressure transducers are present within all the monitoring boreholes. They were used to monitor changes in the water table of the boreholes; they were quite sensitive and also show rapid response the variation levels in groundwater and the data obtained was stored using data logger for long periods of time. The techniques used in sampling included; using a bladder pump and flow through a cell and a bailer. A bailer is hollow equipment used for collecting water samples from monitoring wells. Water samples were collected in a plastic container, using a marker to give each separate sample its label. These borehole monitoring sites within the Patcham catchment are: Preston Pa North Heath Barn, Casterbridge farm, Pyecomb old rec, and Pyecombe east. Data were collected on the 9 2012. In three of the boreholes within Patcham, (North Heath Barn, Preston Park and Pyecoomb East), a CTD data logger was placed which recorded data for conductivity, temperature and depth over long periods of time. Penman-Monotieth equation and YSI multimeter amongst other methods was used in the process. The multimeter is a hand-held field meter that measu 4. RESULTS 4.1 Water level and Conductivity of North Heath Barn borehole Chalk of the North Heath Barn borehole is predominantly white in colour. It is a monitoring site with 70m August unsaturated zone. The installed diver in the North Heath Barn borehole was used to generate data on the conductivity and water depth (level). This was plotted against date (Figure 4) in order to identify depth of recharge and plausible compositional change in In Figure 4, it can be observed that the water depth gradually rose from mid maximum value of 70.54m bgl. A steep decline is observed between ending December and mid values as low as 68.51m bgl. Conductivity in the North Heath Barn borehole shows a rather uniform distribution Journal of Environment and Earth Science 3216 (Paper) ISSN 2225-0948 (Online) 56 pproximately about 4.5km north of the city centre; the A27 road bounds it to the north, with Hollingbury to the East, Withdean to the south and the Brighton mainline to the West. The A23 road passes through Patcham. Figure 2 is a map of the Patcham catchment showing locations of monitoring boreholes available within the area where samples for this project work where collected. The UK chalk aquifer is cretaceous in age and covers a wide extent of England. Starting from Yorkshire up north coast through Lincolnshire and to East Anglia, turning south westwards, forming the Chiltern Hills and moving west to Wiltshire. Dipping in the direction south east, if forms the anticlinal flexure with a simple rise through north Hampshire and North Downs. South Downs is located on the southern limb of the anticline. The chalk then continues to the west with a southward dip until Dorset (Edmonds, 2008). A geological map of the study area (Patcham) displayed a complex geology (folds and faults) of the area. Figure 3 shows the geologic map of the Patcham catchment. The geology of South East England is characterized by Chalk forming its aquifer, which has a dual porosity (matrix and fracture). Surface pollutants can easily be transported through the fracture to the water at ease. In Patcham, a highway (A23) passes through the borehole-monitoring sites which are available, thus making it possible for hydrocarbon runoff to the groundwater due to the nature of the aquifer. Records of evapotranspiration, conductivity, rainfall fluxes and water table depth all contributed to the monitoring of the influence of these contaminates on groundwater. Data, obtained from a Campbell scientific weather station installed in the study catchment and Schlumberger Water Services (SWS), were used to investigate recharge mechanism and potential contaminant flow paths through the Chalk unsaturated zone. CTD Divers were also deployed in three boreholes present within the catchment (i.e. North Heath Barn, Preston Park Using laboratory and analytical techniques such as Raman spectroscopy, Hach Spectrophotometer and YSI Multimeter equipped with Ion selective electrode were used to investigate the influence of these contaminates groundwater flow chemistry and quality from the seven boreholes sites was studied. Data collection included visits to borehole monitoring sites where samples of water was collected from each of oring boreholes available within the Patcham catchment area. Pressure transducers are present within all the monitoring boreholes. They were used to monitor changes in the water table of the boreholes; they were quite sensitive and also show rapid response. They were used to record the variation levels in groundwater and the data obtained was stored using data logger for long periods of time. The techniques used in sampling included; using a bladder pump and flow through a cell and a bailer. A bailer is llow equipment used for collecting water samples from monitoring wells. Water samples were collected in a plastic container, using a marker to give each separate sample its label. These borehole monitoring sites within the Patcham catchment are: Preston Park, Lower Standean, North Bottom, North Heath Barn, Casterbridge farm, Pyecomb old rec, and Pyecombe east. Data were collected on the 9 In three of the boreholes within Patcham, (North Heath Barn, Preston Park and Pyecoomb East), a CTD data logger was placed which recorded data for conductivity, temperature and depth over long periods of time. Monotieth equation and YSI multimeter amongst other methods was used in the process. The multimeter held field meter that measures oxygen, conductivity, salinity and temperature of the water. 4.1 Water level and Conductivity of North Heath Barn borehole Chalk of the North Heath Barn borehole is predominantly white in colour. It is a monitoring site with 70m aturated zone. The installed diver in the North Heath Barn borehole was used to generate data on the conductivity and water depth (level). This was plotted against date (Figure 4) in order to identify depth of recharge and plausible compositional change in the water entering the Chalk aquifer. In Figure 4, it can be observed that the water depth gradually rose from mid-June to mid maximum value of 70.54m bgl. A steep decline is observed between ending December and mid low as 68.51m bgl. Conductivity in the North Heath Barn borehole shows a rather uniform distribution www.iiste.org pproximately about 4.5km north of the city centre; the A27 road bounds it to the north, with Hollingbury to the East, Withdean to the south and the Brighton mainline to the West. The A23 road passes through Patcham. nt showing locations of monitoring boreholes available within the area The UK chalk aquifer is cretaceous in age and covers a wide extent of England. Starting from Yorkshire up north coast through Lincolnshire and to East Anglia, turning south westwards, forming the Chiltern Hills and moving west to Wiltshire. Dipping in the direction south east, if forms the anticlinal flexure s. South Downs is located on the southern limb of the anticline. The chalk then continues to the west with a southward dip until Dorset (Edmonds, 2008). ds and faults) of the area. Figure The geology of South East England is characterized by Chalk forming its aquifer, which has a dual porosity orted through the fracture to the water at ease. In monitoring sites which are available, thus making it Records of evapotranspiration, conductivity, rainfall fluxes and water table depth all contributed to the monitoring of the influence of these contaminates on groundwater. Data, obtained from a Campbell scientific catchment and Schlumberger Water Services (SWS), were used to investigate recharge mechanism and potential contaminant flow paths through the Chalk unsaturated zone. CTD Heath Barn, Preston Park Using laboratory and analytical techniques such as Raman spectroscopy, Hach Spectrophotometer and YSI Multimeter equipped with Ion selective electrode were used to investigate the influence of these contaminates on Data collection included visits to borehole monitoring sites where samples of water was collected from each of Pressure transducers are present within all the monitoring boreholes. They were used to monitor changes in the . They were used to record the variation levels in groundwater and the data obtained was stored using data logger for long periods of time. The techniques used in sampling included; using a bladder pump and flow through a cell and a bailer. A bailer is llow equipment used for collecting water samples from monitoring wells. Water samples were collected in a rk, Lower Standean, North Bottom, North Heath Barn, Casterbridge farm, Pyecomb old rec, and Pyecombe east. Data were collected on the 9th March In three of the boreholes within Patcham, (North Heath Barn, Preston Park and Pyecoomb East), a CTD- Diver data logger was placed which recorded data for conductivity, temperature and depth over long periods of time. Monotieth equation and YSI multimeter amongst other methods was used in the process. The multimeter res oxygen, conductivity, salinity and temperature of the water. Chalk of the North Heath Barn borehole is predominantly white in colour. It is a monitoring site with 70m aturated zone. The installed diver in the North Heath Barn borehole was used to generate data on the conductivity and water depth (level). This was plotted against date (Figure 4) in order to identify depth of June to mid-October reaching a maximum value of 70.54m bgl. A steep decline is observed between ending December and mid-January to low as 68.51m bgl. Conductivity in the North Heath Barn borehole shows a rather uniform distribution
  • 3. Journal of Environment and Earth Science ISSN 2224-3216 (Paper) ISSN 2225 Vol. 3, No.4, 2013 all year round with a few peaks of about 0.398 msie/cm in early August and mid observed that this value declines to a low of 0 4.2 Water level and Conductivity of Preston Park borehole Preston Park is an urban site, with the aquifer characterised by white chalk. The borehole monitoring site located in Preston Park has depth of about 18 divers installed in the borehole of the site (Preston Park) was used to generate data on the conductivity and water depth (level). This was plotted against date (Figure 5) in order to identify de composition of the water entering the Chalk aquifer. From figure 5, it can be seen that the water level has been more or less stable almost all through the year although there were some major decline from December Results further showed that conductivity showed abrupt changes, falling rapidly from 0.71msie/cm from ending June to 0.648msie/cm in the beginning of July. The rise and fall in conductivity continued up until the August where it fell to o.648msie/cm and had a uniform distribution till the mid of December, where it raised again to 0.7msie/cm. 4.3 Water level and Conductivity of Pyecoomb East borehole The pyecoomb east is an effluent dispersal site, dominated site with 60m August, unsaturated zone. Figure 6 was plot against date in order to identify depth of recharge and possible compositional change in the water entering the Chalk aquifer, using data collec plotted in the Figure 6 above shows a continuous increase throughout the year from 56.82m bgl in June to about 57.1m bgl in March. The conductivity in the borehole shows an irregular distributi from June at (0.73msie/cm) through to mid mid-august (0.73msie/cm) to September (0.78msie/cm), thereafter a uniform distribution is being observed throughout the rest of the year. 4.4 Evapotranspiration and Rainfall influx of the boreholes The new climatic station installed at the North Heath Barn borehole allowed for accurate calculation of the evapotranspiration, while the rainfall data collected from the borehole a three boreholes as they are within the same area. A plot of evapotranspiration and rainfall influx against date (Figure 7) is important in establishing the rate of contaminant movement from CUZ to CSZ (i.e. groundwat Also aquifer recharge rate can also be postulated from this plot. From figure 7, it can be observed that the distribution of evapotranspiration is highly inconsistent. The evapotranspiration initially peaked at about 4.7mm and falls to a minimum valu increasing to a late peak value of 2.5mm. Unlike evapotranspiration, rainfall influx within the same period as recorded from the borehole showed a more even distribution characterised with series of sharp peaks. The maximum-recorded rainfall data over the distribution is 25mm with a record low of 0.5mm. Clearly, it can be observed that rainfall influx rate is predominantly greater in quantity than evapotranspiration rate in the borehole. 4.5 Subsurface Element Concentration data To effectively categorise the type and extent of contamination of groundwater within the study areas, concentration of some contaminants measured in the three boreholes are plotted against date. This is necessary in an attempt to determine the trend of contamination in the boreholes as regards to seasonal variation. Firstly, we present World Health Organisation (WHO) standard for element concentration in groundwater (Table 1). 4.5.1 Contaminants concentration in the North Heath Barn borehole Concentration of contaminants in the groundwater of the North Heath Barn borehole was plotted against the date to ascertain whether these limits are within the specified WHO specification presented in table 1. From the graph, it can be observed that ammoniu the given period. Chlorine concentration in the borehole was first recorded in June and can be seen to be evenly distributed hereafter. Average Cl concentration is 13 mg/L, this is within the WHO spe groundwater (see Table 1). Nitrate concentration in January of 2011 begins at 3 mg/L. However, a steady increase in nitrate concentration is observed as we approach April, until a record high of 23.5 mg/L (figure 8). This projection begins to decline steeply to almost 3 mg/L in early June. Hereafter, nitrate concentration Journal of Environment and Earth Science 3216 (Paper) ISSN 2225-0948 (Online) 57 all year round with a few peaks of about 0.398 msie/cm in early August and mid-January. However, it can be observed that this value declines to a low of 0.377msie/cm in February and March. 4.2 Water level and Conductivity of Preston Park borehole Preston Park is an urban site, with the aquifer characterised by white chalk. The borehole monitoring site located in Preston Park has depth of about 18-20m August unsaturated zone. A plot made from data collected by the divers installed in the borehole of the site (Preston Park) was used to generate data on the conductivity and water depth (level). This was plotted against date (Figure 5) in order to identify depth of recharge and likely change in composition of the water entering the Chalk aquifer. From figure 5, it can be seen that the water level has been more or less stable almost all through the year although there were some major decline from December- February dropping from 23m to about 18m bgl. Results further showed that conductivity showed abrupt changes, falling rapidly from 0.71msie/cm from ending June to 0.648msie/cm in the beginning of July. The rise and fall in conductivity continued up until the August where it fell to o.648msie/cm and had a uniform distribution till the mid of December, where it raised 4.3 Water level and Conductivity of Pyecoomb East borehole The pyecoomb east is an effluent dispersal site, dominated by Grey Chalk formation. It is a borehole monitoring site with 60m August, unsaturated zone. Figure 6 was plot against date in order to identify depth of recharge and possible compositional change in the water entering the Chalk aquifer, using data collecting from installed divers. The water level in the borehole as plotted in the Figure 6 above shows a continuous increase throughout the year from 56.82m bgl in June to about 57.1m bgl in March. The conductivity in the borehole shows an irregular distribution, displaying a drop starting from June at (0.73msie/cm) through to mid-August (0.71msie/cm). A steady increase is observed between august (0.73msie/cm) to September (0.78msie/cm), thereafter a uniform distribution is being observed 4.4 Evapotranspiration and Rainfall influx of the boreholes The new climatic station installed at the North Heath Barn borehole allowed for accurate calculation of the evapotranspiration, while the rainfall data collected from the borehole at North Heath Barn was used for all the three boreholes as they are within the same area. A plot of evapotranspiration and rainfall influx against date (Figure 7) is important in establishing the rate of contaminant movement from CUZ to CSZ (i.e. groundwat Also aquifer recharge rate can also be postulated from this plot. From figure 7, it can be observed that the distribution of evapotranspiration is highly inconsistent. The evapotranspiration initially peaked at about 4.7mm and falls to a minimum value of 0.3mm before gradually increasing to a late peak value of 2.5mm. Unlike evapotranspiration, rainfall influx within the same period as recorded from the borehole showed a more even distribution characterised with series of sharp peaks. The rded rainfall data over the distribution is 25mm with a record low of 0.5mm. Clearly, it can be observed that rainfall influx rate is predominantly greater in quantity than evapotranspiration rate in the 4.5 Subsurface Element Concentration data on the Chalk To effectively categorise the type and extent of contamination of groundwater within the study areas, concentration of some contaminants measured in the three boreholes are plotted against date. This is necessary in e trend of contamination in the boreholes as regards to seasonal variation. Firstly, we present World Health Organisation (WHO) standard for element concentration in groundwater (Table 1). 4.5.1 Contaminants concentration in the North Heath Barn borehole oncentration of contaminants in the groundwater of the North Heath Barn borehole was plotted against the date to ascertain whether these limits are within the specified WHO specification presented in table 1. From the graph, it can be observed that ammonium concentration was very low and unpronounced throughout the given period. Chlorine concentration in the borehole was first recorded in June and can be seen to be evenly distributed hereafter. Average Cl concentration is 13 mg/L, this is within the WHO spe groundwater (see Table 1). Nitrate concentration in January of 2011 begins at 3 mg/L. However, a steady increase in nitrate concentration is observed as we approach April, until a record high of 23.5 mg/L (figure 8). egins to decline steeply to almost 3 mg/L in early June. Hereafter, nitrate concentration www.iiste.org January. However, it can be Preston Park is an urban site, with the aquifer characterised by white chalk. The borehole monitoring site located ust unsaturated zone. A plot made from data collected by the divers installed in the borehole of the site (Preston Park) was used to generate data on the conductivity and water pth of recharge and likely change in From figure 5, it can be seen that the water level has been more or less stable almost all through the year uary dropping from 23m to about 18m bgl. Results further showed that conductivity showed abrupt changes, falling rapidly from 0.71msie/cm from ending June to 0.648msie/cm in the beginning of July. The rise and fall in conductivity continued up until the mid of August where it fell to o.648msie/cm and had a uniform distribution till the mid of December, where it raised by Grey Chalk formation. It is a borehole monitoring Figure 6 was plot against date in order to identify depth of recharge and possible compositional change in the ting from installed divers. The water level in the borehole as plotted in the Figure 6 above shows a continuous increase throughout the year from 56.82m bgl in June to about on, displaying a drop starting August (0.71msie/cm). A steady increase is observed between august (0.73msie/cm) to September (0.78msie/cm), thereafter a uniform distribution is being observed The new climatic station installed at the North Heath Barn borehole allowed for accurate calculation of the t North Heath Barn was used for all the three boreholes as they are within the same area. A plot of evapotranspiration and rainfall influx against date (Figure 7) is important in establishing the rate of contaminant movement from CUZ to CSZ (i.e. groundwater). From figure 7, it can be observed that the distribution of evapotranspiration is highly inconsistent. The e of 0.3mm before gradually increasing to a late peak value of 2.5mm. Unlike evapotranspiration, rainfall influx within the same period as recorded from the borehole showed a more even distribution characterised with series of sharp peaks. The rded rainfall data over the distribution is 25mm with a record low of 0.5mm. Clearly, it can be observed that rainfall influx rate is predominantly greater in quantity than evapotranspiration rate in the To effectively categorise the type and extent of contamination of groundwater within the study areas, concentration of some contaminants measured in the three boreholes are plotted against date. This is necessary in e trend of contamination in the boreholes as regards to seasonal variation. Firstly, we present World Health Organisation (WHO) standard for element concentration in groundwater (Table 1). oncentration of contaminants in the groundwater of the North Heath Barn borehole was plotted against the date to ascertain whether these limits are within the specified WHO specification presented in table 1. m concentration was very low and unpronounced throughout the given period. Chlorine concentration in the borehole was first recorded in June and can be seen to be evenly distributed hereafter. Average Cl concentration is 13 mg/L, this is within the WHO specified limit of Cl in groundwater (see Table 1). Nitrate concentration in January of 2011 begins at 3 mg/L. However, a steady increase in nitrate concentration is observed as we approach April, until a record high of 23.5 mg/L (figure 8). egins to decline steeply to almost 3 mg/L in early June. Hereafter, nitrate concentration
  • 4. Journal of Environment and Earth Science ISSN 2224-3216 (Paper) ISSN 2225 Vol. 3, No.4, 2013 increases again to about 9 mg/L in early October before a gradual decline is seen to occur. Dissolved oxygen concentration can be said to be averagely distributed thr slightly above 10 mg/L. Nitrite concentration begins at 14.5 mg/L (this is it highest value throughout the given period). A sharp decline is seen until a recorded value of 6 mg/L in mid fluctuates until a steady concentration of 5 mg/L is reached through September to January before a gradually declines to 3 mg/L is finally observed (figure 8). Phosphate, Sulfate and TOC concentrations all occur below 2 mg/L, with the TOC showing more of irregular distribution than phosphate and sulphate (which are generally below 0.6 mg/L). From the above analysis, it could be seen that all the parameters analysed for were within the WHO guideline values, thus indicating that the water in this area 4.5.2 Contaminants concentration in the Preston Park borehole Contaminants concentration in the groundwater within the Preston Park borehole is plotted against date to obtain whether these limits are within the specified WHO speci From figure 9, it could be seen that chlorine concentration was not detected throughout the whole year. It was detected starting from May with concentration of about 9 mg/l, with maximum concentrations of Chlorine seen in the month of August and September both at 15 mg/l which falls below the WHO specified limit of Cl in groundwater. Nitrate concentration displays a low concentration from the beginning with the lowest at 0.2 mg/L in February, with a sharp rise reaching the hi Dissolved oxygen, sulphate, phosphate and TOC all have concentration lower than the WHO specified limit, although TOC shows a sudden rise in January of 2012 to about 16 mg/L. It could also be seen from the above analysis, that all the parameters analysed for were within the WHO guideline values, thus indicating that the water in this area is quite safe for usage. 4.5.3 Contaminants concentration in Pyecoomb East Borehole Contaminants concentration in the groundwater within the Pyecoomb East borehole is plotted against date to obtain whether these limits are within the specified WHO specification presented in table 4.1 above. The graph is shown in figure 10. Ammonium shows a steady raise reaching a hi until reaching an average point. Nitrate, dissolved oxygen, chlorine, SO distribution except for PO4 which shows an inconsistency from the beginning and then a steep November reaching as high as 9 mg/L before falling to continue at initial level. From the above analysis of water in this site, it could be seen that all the parameters analysed for were within the WHO guideline values, thus indicating tha 4.6 Raman Spectroscopy results This graph shows a plot of intensity against Raman shift in the samples. The Raman spectroscopy results showed almost similar results but at different peaks. The Raman spectr to overlap with plastic container lines, giving similar spectra for all the seven samples (Figure 11). 5. DISCUSSIONS 5.1 Hydraulic conductivity Hydraulic conductivity in the North Heath Barn is relative monitoring site of about 70m August unsaturated zone. Groundwater depth (level) decreases to a minimum during winter months of December through to January. Rainfall influx was as well predominantly greater i quantity and showed less inconsistency than evapotranspiration rate in the borehole. Uniformity of the hydraulic conductivity is thought to be due to its thick unsaturated zone. In which case the soil and weathered chalk of the area damped out of the normal recharge signal, storing water and releasing it gradually to the unweathered chalk. Matric potential increased with depth for unsaturated zone, especially in summer months (Price Base recharge of the weathered zone is thought to be great potential sufficiently high that water was not absorbed straight back into the matrix but reached the water table without being absorbed by the matrix. Hence, explaining the even distribution of conductivity a recharge even in summer periods (of less rainfall influx). Fracture flow may also contribute to groundwater recharge but this is rare, since drainage to water table continues year round. Gallagher et al. (2012) reported that the unsaturated part of the year. The data from the hydrograph and matric potential showed that the water table responds rapidly following sudden increases in matric potential above the air entry pressure of fractur are separated by faults, fractures and marls and are close to saturation, even during summer months. They Journal of Environment and Earth Science 3216 (Paper) ISSN 2225-0948 (Online) 58 increases again to about 9 mg/L in early October before a gradual decline is seen to occur. Dissolved oxygen concentration can be said to be averagely distributed throughout given period, with limits slightly above 10 mg/L. Nitrite concentration begins at 14.5 mg/L (this is it highest value throughout the given period). A sharp decline is seen until a recorded value of 6 mg/L in mid-February. Hereafter, nitrite concent fluctuates until a steady concentration of 5 mg/L is reached through September to January before a gradually declines to 3 mg/L is finally observed (figure 8). Phosphate, Sulfate and TOC concentrations all occur below 2 re of irregular distribution than phosphate and sulphate (which are generally From the above analysis, it could be seen that all the parameters analysed for were within the WHO guideline values, thus indicating that the water in this area is quite safe for usage. 4.5.2 Contaminants concentration in the Preston Park borehole Contaminants concentration in the groundwater within the Preston Park borehole is plotted against date to obtain whether these limits are within the specified WHO specification presented in table 1. From figure 9, it could be seen that chlorine concentration was not detected throughout the whole year. It was detected starting from May with concentration of about 9 mg/l, with maximum concentrations of Chlorine seen e month of August and September both at 15 mg/l which falls below the WHO specified limit of Cl in groundwater. Nitrate concentration displays a low concentration from the beginning with the lowest at 0.2 mg/L in February, with a sharp rise reaching the highest concentrations in 16 mg/L in the month of September. Dissolved oxygen, sulphate, phosphate and TOC all have concentration lower than the WHO specified limit, although TOC shows a sudden rise in January of 2012 to about 16 mg/L. from the above analysis, that all the parameters analysed for were within the WHO guideline values, thus indicating that the water in this area is quite safe for usage. 4.5.3 Contaminants concentration in Pyecoomb East Borehole n the groundwater within the Pyecoomb East borehole is plotted against date to obtain whether these limits are within the specified WHO specification presented in table 4.1 above. The graph is Ammonium shows a steady raise reaching a high of 83mg/L with a more or insistent up and down movement until reaching an average point. Nitrate, dissolved oxygen, chlorine, SO4, TOC, NO which shows an inconsistency from the beginning and then a steep November reaching as high as 9 mg/L before falling to continue at initial level. From the above analysis of water in this site, it could be seen that all the parameters analysed for were within the WHO guideline values, thus indicating that the water in this area is quite safe for usage. This graph shows a plot of intensity against Raman shift in the samples. The Raman spectroscopy results showed almost similar results but at different peaks. The Raman spectroscopy results could not be further interpreted due to overlap with plastic container lines, giving similar spectra for all the seven samples (Figure 11). Hydraulic conductivity in the North Heath Barn is relatively uniformly distributed all year round. It is a monitoring site of about 70m August unsaturated zone. Groundwater depth (level) decreases to a minimum during winter months of December through to January. Rainfall influx was as well predominantly greater i quantity and showed less inconsistency than evapotranspiration rate in the borehole. Uniformity of the hydraulic conductivity is thought to be due to its thick unsaturated zone. In which case the soil and weathered chalk of the mal recharge signal, storing water and releasing it gradually to the unweathered chalk. Matric potential increased with depth for unsaturated zone, especially in summer months (Price Base recharge of the weathered zone is thought to be greater than the matric permeability and the matric potential sufficiently high that water was not absorbed straight back into the matrix but reached the water table without being absorbed by the matrix. Hence, explaining the even distribution of conductivity a recharge even in summer periods (of less rainfall influx). Fracture flow may also contribute to groundwater recharge but this is rare, since drainage to water table continues year round. (2012) reported that the unsaturated zone of North Heath Barn was closely saturated for most part of the year. The data from the hydrograph and matric potential showed that the water table responds rapidly following sudden increases in matric potential above the air entry pressure of fractures and that aquifer blocks are separated by faults, fractures and marls and are close to saturation, even during summer months. They www.iiste.org increases again to about 9 mg/L in early October before a gradual decline is seen to occur. oughout given period, with limits slightly above 10 mg/L. Nitrite concentration begins at 14.5 mg/L (this is it highest value throughout the given February. Hereafter, nitrite concentration fluctuates until a steady concentration of 5 mg/L is reached through September to January before a gradually declines to 3 mg/L is finally observed (figure 8). Phosphate, Sulfate and TOC concentrations all occur below 2 re of irregular distribution than phosphate and sulphate (which are generally From the above analysis, it could be seen that all the parameters analysed for were within the WHO guideline Contaminants concentration in the groundwater within the Preston Park borehole is plotted against date to obtain From figure 9, it could be seen that chlorine concentration was not detected throughout the whole year. It was detected starting from May with concentration of about 9 mg/l, with maximum concentrations of Chlorine seen e month of August and September both at 15 mg/l which falls below the WHO specified limit of Cl in groundwater. Nitrate concentration displays a low concentration from the beginning with the lowest at 0.2 mg/L ghest concentrations in 16 mg/L in the month of September. Dissolved oxygen, sulphate, phosphate and TOC all have concentration lower than the WHO specified limit, from the above analysis, that all the parameters analysed for were within the WHO n the groundwater within the Pyecoomb East borehole is plotted against date to obtain whether these limits are within the specified WHO specification presented in table 4.1 above. The graph is gh of 83mg/L with a more or insistent up and down movement 2 all display a normal which shows an inconsistency from the beginning and then a steep raise from 25th From the above analysis of water in this site, it could be seen that all the parameters analysed for were within the This graph shows a plot of intensity against Raman shift in the samples. The Raman spectroscopy results showed oscopy results could not be further interpreted due to overlap with plastic container lines, giving similar spectra for all the seven samples (Figure 11). ly uniformly distributed all year round. It is a monitoring site of about 70m August unsaturated zone. Groundwater depth (level) decreases to a minimum during winter months of December through to January. Rainfall influx was as well predominantly greater in quantity and showed less inconsistency than evapotranspiration rate in the borehole. Uniformity of the hydraulic conductivity is thought to be due to its thick unsaturated zone. In which case the soil and weathered chalk of the mal recharge signal, storing water and releasing it gradually to the unweathered chalk. Matric potential increased with depth for unsaturated zone, especially in summer months (Price et al., 1976). er than the matric permeability and the matric potential sufficiently high that water was not absorbed straight back into the matrix but reached the water table without being absorbed by the matrix. Hence, explaining the even distribution of conductivity and groundwater recharge even in summer periods (of less rainfall influx). Fracture flow may also contribute to groundwater zone of North Heath Barn was closely saturated for most part of the year. The data from the hydrograph and matric potential showed that the water table responds rapidly es and that aquifer blocks are separated by faults, fractures and marls and are close to saturation, even during summer months. They
  • 5. Journal of Environment and Earth Science ISSN 2224-3216 (Paper) ISSN 2225 Vol. 3, No.4, 2013 suggested connectivity between the faults, fractures and marl may occur when matric potentials are high and there is sufficient rainfall input. Hence, water then starts to fill faults and large fractures, allowing rapid movement of water through the unsaturated zone, maintaining the groundwater recharge year round. In Preston Park, the borehole is characterized by a slim unsa the possibility of water rapidly reaching the water table compared to the other two boreholes with a thicker unsaturated zone. Exertion of pressure from the matric potential is low (as the zone of unsatu hence mobility of surface water in the unsaturation zone to the saturate zone may occur readily. In summer months when recharge is less, the matric potential increases causing absorbed water on the Chalk matrix to percolate further below the water table, maintaining recharge. Due to the thin unsaturation zone, it was believed that in period of intense and sustained rainfall, flash flooding may occur as depth to water table may become almost at the surface but this was not anticipated to las within the aquifer formation may diminish the effect. Zaidman steeply inclined normal faults approximately every 20 m, including one fault that conta iron-stained breccia zone, which indicates the movement of water through it. Pyecoomb East borehole has an unsaturated zone of about 60m. Effluent release and farmland irrigation contributed to the groundwater recharge, explaining the r This site had high concentration of nitrate and chlorine when compared to the North Heath Barn. The high concentration of nitrate and chlorine also further fortify the possibility of groundwater recharg discharge and farmland washout from irrigation activities. 5.2 Chemical Variation Several plots were made (Nitrate – Nitrate – TOC, and Nitrate – Sulphate) to study t hence infer plausible trend to the source and movement of contaminants. Of the studied boreholes, Pyecombe East had the highest concentration of Nitrate, Phosphate, Chlorine and Sulphate but the Total Organic Content (TOC). The borehole at Pyecombe East is an effluent dispersal site with 60m of August unsaturated zone. Therefore increased mixing of surface effluent recharge with groundwater is thought to be responsible for the high concentration of these elements in the Chalk aquifer. These concentrations, in most cases, show steady consistent increase pattern likely arising from seasonal variation. Organic content concentration of effluent recharge to the groundwater at Pyec the low TOC concentration in the areas. The concentration of Nitrate and Chlorine is higher in the Preston park borehole compared to the North Heath Barn. Preston Park borehole is urban recharge with thin August unsaturat movement of these elements without having to be absorbed on the weathered chalk matrix. The high concentrations of these elements suggest an artificial recharge to groundwater from surface urban run farmland irrigation practices. Concentration of Phosphate, Sulphate and TOC is higher in the North Heath Barn borehole compared to observed Preston park borehole. As already mentioned earlier, North Heath Barn is monitoring site with the thickest August unsaturation zone of unsaturated zone may dissolve the marl formation causing an increase in the phosphate and sulphate concentration as groundwater is recharged. Evenly distributed hydraulic conductivi gradual release of stored water from unweathered Chalk (to sustain the year round recharge) may carry along organic matter from the Chalk formation, hence describing the high TOC concentration in the North Heath Barn borehole compared to other studied borehole locations. Of all the three studied boreholes, Pyecombe East (an effluent dispersal site) show high concentration of all contaminants except TOC, highest in the North Heath Barn. Artificial recharge in the Preston park boreh (Urban site) may be responsible for the high concentrations of Chlorine and Nitrate. 6. Conclusion This paper investigated the impact of contaminants on groundwater flow chemistry and the quality of groundwater in Patcham, South-East England. Groundwa months of December through to January. Rainfall influx is as well predominantly greater in quantity and shows less inconsistency than evapotranspiration rate in the borehole. The uniformity of the hydr thought to be due to the thickness of the unsaturated zone at North Heath Barn and Pyecoomb East. Except for Preston Park, this has a much thinner unsaturated zone, which may influence the rapid water movement to the water table. Chemical variation of the boreholes studied showed the borehole at Pyecoomb East to be more of an effluent Journal of Environment and Earth Science 3216 (Paper) ISSN 2225-0948 (Online) 59 suggested connectivity between the faults, fractures and marl may occur when matric potentials are high and ient rainfall input. Hence, water then starts to fill faults and large fractures, allowing rapid movement of water through the unsaturated zone, maintaining the groundwater recharge year round. In Preston Park, the borehole is characterized by a slim unsaturated zone of about 20m thick, which may result in the possibility of water rapidly reaching the water table compared to the other two boreholes with a thicker unsaturated zone. Exertion of pressure from the matric potential is low (as the zone of unsatu hence mobility of surface water in the unsaturation zone to the saturate zone may occur readily. In summer months when recharge is less, the matric potential increases causing absorbed water on the Chalk matrix to he water table, maintaining recharge. Due to the thin unsaturation zone, it was believed that in period of intense and sustained rainfall, flash flooding may occur as depth to water table may become almost at the surface but this was not anticipated to last for a long period, as fracture flow or lateral movement within the aquifer formation may diminish the effect. Zaidman et al., (1999) working in Yorkshire, identified steeply inclined normal faults approximately every 20 m, including one fault that conta stained breccia zone, which indicates the movement of water through it. Pyecoomb East borehole has an unsaturated zone of about 60m. Effluent release and farmland irrigation contributed to the groundwater recharge, explaining the recharge occurring even period of low rainfall influx. This site had high concentration of nitrate and chlorine when compared to the North Heath Barn. The high concentration of nitrate and chlorine also further fortify the possibility of groundwater recharg discharge and farmland washout from irrigation activities. Phosphate, Nitrate – Chlorine, Sulphate – Phosphate, Sulphate Sulphate) to study the chemical variation of elements within the catchment area, hence infer plausible trend to the source and movement of contaminants. Of the studied boreholes, Pyecombe East had the highest concentration of Nitrate, Phosphate, Chlorine and Sulphate but the Total Organic Content (TOC). The borehole at Pyecombe East is an effluent dispersal site with 60m of August unsaturated zone. Therefore increased mixing of surface effluent recharge with groundwater is thought to be e high concentration of these elements in the Chalk aquifer. These concentrations, in most cases, show steady consistent increase pattern likely arising from seasonal variation. Organic content concentration of effluent recharge to the groundwater at Pyecombe east was low, thus reflecting the low TOC concentration in the areas. The concentration of Nitrate and Chlorine is higher in the Preston park borehole compared to the North Heath Barn. Preston Park borehole is urban recharge with thin August unsaturated zone enhancing more rapid movement of these elements without having to be absorbed on the weathered chalk matrix. The high concentrations of these elements suggest an artificial recharge to groundwater from surface urban run Concentration of Phosphate, Sulphate and TOC is higher in the North Heath Barn borehole compared to observed Preston park borehole. As already mentioned earlier, North Heath Barn is monitoring site with the thickest August unsaturation zone of the three borehole sites. Pyrite oxidation as bypass flow within the thick unsaturated zone may dissolve the marl formation causing an increase in the phosphate and sulphate concentration as groundwater is recharged. Evenly distributed hydraulic conductivity throughout the year and gradual release of stored water from unweathered Chalk (to sustain the year round recharge) may carry along organic matter from the Chalk formation, hence describing the high TOC concentration in the North Heath Barn pared to other studied borehole locations. Of all the three studied boreholes, Pyecombe East (an effluent dispersal site) show high concentration of all contaminants except TOC, highest in the North Heath Barn. Artificial recharge in the Preston park boreh (Urban site) may be responsible for the high concentrations of Chlorine and Nitrate. This paper investigated the impact of contaminants on groundwater flow chemistry and the quality of East England. Groundwater depth (level) decreases to a minimum during winter months of December through to January. Rainfall influx is as well predominantly greater in quantity and shows less inconsistency than evapotranspiration rate in the borehole. The uniformity of the hydr thought to be due to the thickness of the unsaturated zone at North Heath Barn and Pyecoomb East. Except for Preston Park, this has a much thinner unsaturated zone, which may influence the rapid water movement to the ical variation of the boreholes studied showed the borehole at Pyecoomb East to be more of an effluent www.iiste.org suggested connectivity between the faults, fractures and marl may occur when matric potentials are high and ient rainfall input. Hence, water then starts to fill faults and large fractures, allowing rapid movement of water through the unsaturated zone, maintaining the groundwater recharge year round. turated zone of about 20m thick, which may result in the possibility of water rapidly reaching the water table compared to the other two boreholes with a thicker unsaturated zone. Exertion of pressure from the matric potential is low (as the zone of unsaturation is thin); hence mobility of surface water in the unsaturation zone to the saturate zone may occur readily. In summer months when recharge is less, the matric potential increases causing absorbed water on the Chalk matrix to he water table, maintaining recharge. Due to the thin unsaturation zone, it was believed that in period of intense and sustained rainfall, flash flooding may occur as depth to water table may become t for a long period, as fracture flow or lateral movement (1999) working in Yorkshire, identified steeply inclined normal faults approximately every 20 m, including one fault that contained a 0.5 m thick, Pyecoomb East borehole has an unsaturated zone of about 60m. Effluent release and farmland irrigation echarge occurring even period of low rainfall influx. This site had high concentration of nitrate and chlorine when compared to the North Heath Barn. The high concentration of nitrate and chlorine also further fortify the possibility of groundwater recharge from effluent Phosphate, Sulphate – Chlorine, he chemical variation of elements within the catchment area, hence infer plausible trend to the source and movement of contaminants. Of the studied boreholes, Pyecombe East had the highest concentration of Nitrate, Phosphate, Chlorine and Sulphate but the low concentrations of Total Organic Content (TOC). The borehole at Pyecombe East is an effluent dispersal site with 60m of August unsaturated zone. Therefore increased mixing of surface effluent recharge with groundwater is thought to be e high concentration of these elements in the Chalk aquifer. These concentrations, in most cases, ombe east was low, thus reflecting The concentration of Nitrate and Chlorine is higher in the Preston park borehole compared to the North Heath ed zone enhancing more rapid movement of these elements without having to be absorbed on the weathered chalk matrix. The high concentrations of these elements suggest an artificial recharge to groundwater from surface urban run-off and Concentration of Phosphate, Sulphate and TOC is higher in the North Heath Barn borehole compared to observed Preston park borehole. As already mentioned earlier, North Heath Barn is monitoring site with the the three borehole sites. Pyrite oxidation as bypass flow within the thick unsaturated zone may dissolve the marl formation causing an increase in the phosphate and sulphate ty throughout the year and gradual release of stored water from unweathered Chalk (to sustain the year round recharge) may carry along organic matter from the Chalk formation, hence describing the high TOC concentration in the North Heath Barn Of all the three studied boreholes, Pyecombe East (an effluent dispersal site) show high concentration of all contaminants except TOC, highest in the North Heath Barn. Artificial recharge in the Preston park borehole This paper investigated the impact of contaminants on groundwater flow chemistry and the quality of ter depth (level) decreases to a minimum during winter months of December through to January. Rainfall influx is as well predominantly greater in quantity and shows less inconsistency than evapotranspiration rate in the borehole. The uniformity of the hydraulic conductivity is thought to be due to the thickness of the unsaturated zone at North Heath Barn and Pyecoomb East. Except for Preston Park, this has a much thinner unsaturated zone, which may influence the rapid water movement to the ical variation of the boreholes studied showed the borehole at Pyecoomb East to be more of an effluent
  • 6. Journal of Environment and Earth Science ISSN 2224-3216 (Paper) ISSN 2225 Vol. 3, No.4, 2013 dispersal site due to the distribution of nitrate, Sulphate, chloride and Phosphate that has mixed with the groundwater in the site. Distribution of Phos derived from farming irrigation carried out in the area, which may have reached the water table through bypass flow dissolving the marl formation. Artificial recharge of groundwater in the area ma and Chloride concentrations in the Preston Park borehole. Results from analysis using Raman Spectroscopy did not in this case yield any useful results but rather ambiguous. The use of other techniques may yield results of hydroca References Aldrich, J., (2006). The status of groundwater resources and the groundwater needs of the environment. UK groundwater Forum meeting “Planning for sustainable groundwater resources: something got to give”. Natur History Museum, London, 30 March 2006. Brouyere, S., (2006), Modelling the Migration of Contaminant through Variably Saturated Dual Dual-permeability Chalk, Journal of Contaminant Hydrology Chaplin, M.F. (2008). Water: its import CLIMAWAT (2011). Water Quality Monitoring and Analysis. Available online Accessed online 22nd April, 2011. Edmunds, C., 2008. Improved groundwater vulnerability mapping for the Karstic Chalk aquifer of south England. Engineering Geology, 99:95 Egbuna, C.K. and Duvbiama, O.A. (2013). Southwestern Nigeria. Journal. Civil Eng. Urban. 3(1): 25 Gallagher, A. J., Helen K., Rutter, David K. Buckley and Ian Molyneux. (2012). Lithostratigraphic controls on recharge to the Chalk aquifer of Southern England, Hydrogeology, 45:161-172. Howden, N.J.K., Wheater, H.S., Peach, D.W., and Butler, A.P. (2004). Hydrogeological controls on surface/groundwater interactions in a lowland permeable Chalk catchment. Century, Volume II. British Hydrological Society. Kemper, K.E. (2004). Groundwater Louis, I.A. and Egbuna, C.K. (2012). Assessment of Ground Eng. Urban, 2(6):214-219. Lunzhang, S. (1994). Management of groundwater resources in China. Rome: FAO. Nola, M., Njine, T., Djunikom, E. and Sikati, V. (2008). Faecal coliforms and faecal streptococci community in the underground water in an equatorial area in Cameroun (Central Afric environmental chemical factors. Water research Pinault, J.L., Amraoui, N., and Golaz, C., (2005), Groundwater induced flooding in macropore hydrological system in the context of climate change, Price, M., Bird, M. J., Foster, S.S.D. (1976). Chalk pore 80:596–600. Ravi, C., Palakodeti, Eugene, J., LeBoeuf, James, H. and Clarke (2009). Tool for assessment of process importance at the groundwater/surface water interface. WHO (2011). Guidelines for drinking edition. Zaidman, M.D., Middleton, R.T., West the Chalk in Yorkshire. Quarterly Journal of Engineering Geology, Journal of Environment and Earth Science 3216 (Paper) ISSN 2225-0948 (Online) 60 dispersal site due to the distribution of nitrate, Sulphate, chloride and Phosphate that has mixed with the groundwater in the site. Distribution of Phosphate, Sulphate and TOC in the North Heath Barn borehole is derived from farming irrigation carried out in the area, which may have reached the water table through bypass flow dissolving the marl formation. Artificial recharge of groundwater in the area may be the result of Nitrate and Chloride concentrations in the Preston Park borehole. Results from analysis using Raman Spectroscopy did not in this case yield any useful results but rather ambiguous. The use of other techniques may yield results of hydrocarbon traces from highway runoff. Aldrich, J., (2006). The status of groundwater resources and the groundwater needs of the environment. UK ndwater Forum meeting “Planning for sustainable groundwater resources: something got to give”. Natur History Museum, London, 30 March 2006. Brouyere, S., (2006), Modelling the Migration of Contaminant through Variably Saturated Dual Journal of Contaminant Hydrology, 82:195-219. Chaplin, M.F. (2008). Water: its importance to life. Biochemistry and Molecular Biology Education CLIMAWAT (2011). Water Quality Monitoring and Analysis. Available online http://www.climawat.info/ , 2008. Improved groundwater vulnerability mapping for the Karstic Chalk aquifer of south , 99:95-108. Egbuna, C.K. and Duvbiama, O.A. (2013). Physicochemical Assessment of Groundwater Quality in Akure, . Journal. Civil Eng. Urban. 3(1): 25-28. 2013 Gallagher, A. J., Helen K., Rutter, David K. Buckley and Ian Molyneux. (2012). Lithostratigraphic controls on recharge to the Chalk aquifer of Southern England, Quarterly Journal of Engineering Geology and Howden, N.J.K., Wheater, H.S., Peach, D.W., and Butler, A.P. (2004). Hydrogeological controls on surface/groundwater interactions in a lowland permeable Chalk catchment. Science and Practice for the 21st ydrological Society. Kemper, K.E. (2004). Groundwater – from development to management. Hydrogeology journal Louis, I.A. and Egbuna, C.K. (2012). Assessment of Ground-Water Quality in the South-East of England. zhang, S. (1994). Management of groundwater resources in China. Rome: FAO. Nola, M., Njine, T., Djunikom, E. and Sikati, V. (2008). Faecal coliforms and faecal streptococci community in the underground water in an equatorial area in Cameroun (Central Africa): The importance of some Water research, 36: 3289-3297. Pinault, J.L., Amraoui, N., and Golaz, C., (2005), Groundwater induced flooding in macropore hydrological system in the context of climate change, Water Resources Research, 41:16 Price, M., Bird, M. J., Foster, S.S.D. (1976). Chalk pore-size measurements and their significance Water Services, Ravi, C., Palakodeti, Eugene, J., LeBoeuf, James, H. and Clarke (2009). Tool for assessment of process portance at the groundwater/surface water interface. Journal of Environmental management Guidelines for drinking-water quality: Water Sanitation Health. World Health Organization. Fourth Zaidman, M.D., Middleton, R.T., West, L.J. (1999). Geophysical Investigation of unsaturated zone transport in Quarterly Journal of Engineering Geology, 32: 185-198 www.iiste.org dispersal site due to the distribution of nitrate, Sulphate, chloride and Phosphate that has mixed with the phate, Sulphate and TOC in the North Heath Barn borehole is derived from farming irrigation carried out in the area, which may have reached the water table through bypass y be the result of Nitrate Results from analysis using Raman Spectroscopy did not in this case yield any useful results but rather rbon traces from highway runoff. Aldrich, J., (2006). The status of groundwater resources and the groundwater needs of the environment. UK ndwater Forum meeting “Planning for sustainable groundwater resources: something got to give”. Natural Brouyere, S., (2006), Modelling the Migration of Contaminant through Variably Saturated Dual-porosity, Biochemistry and Molecular Biology Education, 29:54-59. http://www.climawat.info/. , 2008. Improved groundwater vulnerability mapping for the Karstic Chalk aquifer of south-east Physicochemical Assessment of Groundwater Quality in Akure, Gallagher, A. J., Helen K., Rutter, David K. Buckley and Ian Molyneux. (2012). Lithostratigraphic controls on Quarterly Journal of Engineering Geology and Howden, N.J.K., Wheater, H.S., Peach, D.W., and Butler, A.P. (2004). Hydrogeological controls on Science and Practice for the 21st Hydrogeology journal 12:3-5 East of England. J. Civil Nola, M., Njine, T., Djunikom, E. and Sikati, V. (2008). Faecal coliforms and faecal streptococci community in a): The importance of some Pinault, J.L., Amraoui, N., and Golaz, C., (2005), Groundwater induced flooding in macropore -dominated size measurements and their significance Water Services, Ravi, C., Palakodeti, Eugene, J., LeBoeuf, James, H. and Clarke (2009). Tool for assessment of process Journal of Environmental management, 90:87-101. water quality: Water Sanitation Health. World Health Organization. Fourth Geophysical Investigation of unsaturated zone transport in
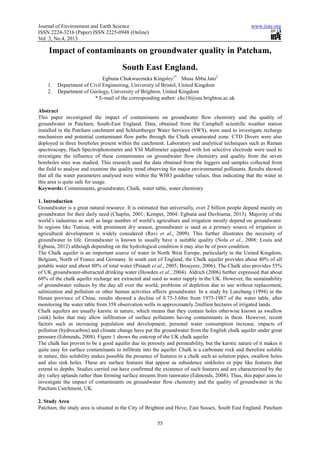
  • 7. Journal of Environment and Earth Science ISSN 2224-3216 (Paper) ISSN 2225 Vol. 3, No.4, 2013 Table 1: The World Health Organisation Substance Chloride Total Dissolved Solids Nitrate Nitrite Sulfate Ammonium Phosphate Figure 1: Showing outcrop of the UK chalk aquifer (Edmonds, 2008) Journal of Environment and Earth Science 3216 (Paper) ISSN 2225-0948 (Online) 61 World Health Organisation guideline value standard for various elements WHO guideline values 250 mg/L Total Dissolved Solids 500 mg/L 50 mg/L 1 mg/L 250 mg/L Ammonium 0.1 mg/L 0.015 mg/L Figure 1: Showing outcrop of the UK chalk aquifer (Edmonds, 2008) www.iiste.org standard for various elements (WHO, 2011) WHO guideline values Figure 1: Showing outcrop of the UK chalk aquifer (Edmonds, 2008)
  • 8. Journal of Environment and Earth Science ISSN 2224-3216 (Paper) ISSN 2225 Vol. 3, No.4, 2013 Figure 2: Map showing monitoring boreholes within Patcham catchment (CLIMAWAT 2011) Figure 3 Journal of Environment and Earth Science 3216 (Paper) ISSN 2225-0948 (Online) 62 : Map showing monitoring boreholes within Patcham catchment (CLIMAWAT 2011) Figure 3: Geologic map of Patcham (CLIMAWAT, 2011) www.iiste.org : Map showing monitoring boreholes within Patcham catchment (CLIMAWAT 2011)
  • 9. Journal of Environment and Earth Science ISSN 2224-3216 (Paper) ISSN 2225 Vol. 3, No.4, 2013 Figure 4: Conductivity – Figure 5: Conductivity 67 67.5 68 68.5 69 69.5 70 70.5 71 WaterLevel(mbgl) Water Level (m bgl) and Conductivity (msie/cm) plot 0 5 10 15 20 25 WaterLevel(mbgl) Water level (m bgl) and Coductivity (msie/com) against time (days) Journal of Environment and Earth Science 3216 (Paper) ISSN 2225-0948 (Online) 63 – Water depth plot against date in the North Heath Barn borehole. : Conductivity – Water depth plot against date in the Preston Park borehole. 0.365 0.37 0.375 0.38 0.385 0.39 0.395 0.4 Conductivity(msie/cm) Days Water Level (m bgl) and Conductivity (msie/cm) plot 0.6 0.62 0.64 0.66 0.68 0.7 0.72 Conductivity(msie/cm) Time (days) Water level (m bgl) and Coductivity (msie/com) against time (days) plot www.iiste.org Water depth plot against date in the North Heath Barn borehole. ter depth plot against date in the Preston Park borehole. Water Level Conductivity Water level (m bgl) and Coductivity (msie/com) against time (days) Water Level Conductivity
  • 10. Journal of Environment and Earth Science ISSN 2224-3216 (Paper) ISSN 2225 Vol. 3, No.4, 2013 Figure 6: Conductivity Figure 7: Evapotranspiration 56.65 56.7 56.75 56.8 56.85 56.9 56.95 57 57.05 57.1 57.15 WaterLevel(mbgl) Water Level (m bgl) and Conductivity (msie/cm) against Time 0 1 2 3 4 5 40708.5 40719 40730 40741 40752 40763 40774 40785 Evapotranspiration(mm) Evapotranspiration (mm) and Rainfall (mm) against date (days) Journal of Environment and Earth Science 3216 (Paper) ISSN 2225-0948 (Online) 64 Figure 6: Conductivity – Water depth plot against date in Pyecoomb East borehole. : Evapotranspiration – Rainfall influx plot against date 0.64 0.66 0.68 0.7 0.72 0.74 0.76 0.78 0.8 Conductivity(msie/cm) Time (days) Water Level (m bgl) and Conductivity (msie/cm) against Time (days) plot 40796 40807 40818 40829 40840 40851 40862 40873 40884 40895 40906 40917 40928 40939 40950 40961 40972 Date (days) Evapotranspiration (mm) and Rainfall (mm) against date (days) www.iiste.org Water depth plot against date in Pyecoomb East borehole. Water Level (m bgl) and Conductivity (msie/cm) against Time Water level Conductivity 0 5 10 15 20 25 30 35 40 40972 40983 40994 41005 Rainfall(mm) Evapotranspiration (mm) and Rainfall (mm) against date (days)
  • 11. Journal of Environment and Earth Science ISSN 2224-3216 (Paper) ISSN 2225 Vol. 3, No.4, 2013 Figure 8: Element concentration Figure 9: Element concentration 0 5 10 15 20 25 20/01/201100:00 20/02/201100:00 20/03/201100:00 20/04/201100:00 20/05/201100:00 20/06/201100:00 Concentration(mg/l) Concentration (mg/l) 0 5 10 15 20 25 30 35 40 45 50 Concentration(mg/l) Concentration (mg/l) against Time (days) plot Journal of Environment and Earth Science 3216 (Paper) ISSN 2225-0948 (Online) 65 : Element concentration – date plot of North Heath Barn Borehole Figure 9: Element concentration – date plot of Preston Park Borehole. 0 2 4 6 8 10 12 14 16 18 20/06/201100:00 20/07/201100:00 20/08/201100:00 20/09/201100:00 20/10/201100:00 20/11/201100:00 20/12/201100:00 20/01/201200:00 20/02/201200:00 Concentration(mg/l) Time (days) Concentration (mg/l) - Time (days) plot Ammonium Chlorine Nitrate Dissolved Oxygen NO2 PO4 SO4 TOC 0 2 4 6 8 10 12 14 16 18 Concentration(mg/l) Time (days) Concentration (mg/l) against Time (days) plot Chlorine NO2 SO4 TOC Ammonium Nitrate Dissolved Oxygen PO4 www.iiste.org of North Heath Barn Borehole date plot of Preston Park Borehole. Ammonium Chlorine Nitrate Dissolved Oxygen NO2 PO4 SO4 TOC Chlorine NO2 SO4 TOC Ammonium Nitrate Dissolved Oxygen PO4
  • 12. Journal of Environment and Earth Science ISSN 2224-3216 (Paper) ISSN 2225 Vol. 3, No.4, 2013 Figure 10: Element concentration Figure 11: Raman spectra for samples from Patcham catchment. 0 20 40 60 80 100 120 20/11/2010… 21/11/2010… 22/11/2010… 23/11/2010… 24/11/2010… 25/11/2010… Concentration(mg/l) Concentration (mg/l) against Time (Days) plot Journal of Environment and Earth Science 3216 (Paper) ISSN 2225-0948 (Online) 66 : Element concentration – date plot of Pyecoomb East Borehole Figure 11: Raman spectra for samples from Patcham catchment. 0 2 4 6 8 10 25/11/2010… 26/11/2010… 27/11/2010… 28/11/2010… 29/11/2010… 30/11/2010… 01/12/2010… 02/12/2010… 03/12/2010… 04/12/2010… Concentration(mg/l) Time (days) Concentration (mg/l) against Time (Days) plot www.iiste.org date plot of Pyecoomb East Borehole Ammonium Nitrate Dissolved Oxygen Chlorine PO4 SO4 NO2 TOC
  • 13. This academic article was published by The International Institute for Science, Technology and Education (IISTE). The IISTE is a pioneer in the Open Access Publishing service based in the U.S. and Europe. The aim of the institute is Accelerating Global Knowledge Sharing. More information about the publisher can be found in the IISTE’s homepage: http://www.iiste.org CALL FOR PAPERS The IISTE is currently hosting more than 30 peer-reviewed academic journals and collaborating with academic institutions around the world. There’s no deadline for submission. Prospective authors of IISTE journals can find the submission instruction on the following page: http://www.iiste.org/Journals/ The IISTE editorial team promises to the review and publish all the qualified submissions in a fast manner. All the journals articles are available online to the readers all over the world without financial, legal, or technical barriers other than those inseparable from gaining access to the internet itself. Printed version of the journals is also available upon request of readers and authors. IISTE Knowledge Sharing Partners EBSCO, Index Copernicus, Ulrich's Periodicals Directory, JournalTOCS, PKP Open Archives Harvester, Bielefeld Academic Search Engine, Elektronische Zeitschriftenbibliothek EZB, Open J-Gate, OCLC WorldCat, Universe Digtial Library , NewJour, Google Scholar