HỌC TỐT TIẾNG ANH 11 THEO CHƯƠNG TRÌNH GLOBAL SUCCESS ĐÁP ÁN CHI TIẾT - CẢ NĂ...
Impact of devolution of power plan on students
1. Developing Country Studies www.iiste.org
ISSN 2224-607X (Paper) ISSN 2225-0565 (Online)
Vol 2, No.2, 2012
Impact of devolution of power plan on students’ dropout rate
at secondary level in Hazara division KPK, Pakistan
Tahir Javed PhD Scholar
NUMLs Islamabad Pakistan
Dr. Shafqat Hussain (Corresponding Author)
Foundation University Islamabad
Shafqat_hussain1973@yahoo.com
Zahid Bashir PhD Scholar
NUMLs Islamabad Pakistan
Abstract
The study was conducted to assess the impact of devolution of power plan 2001 on students’ dropout rate at
secondary level in Hazara division KPK, Pakistan. Population of study was three districts of Hazara
division (Abbottabad, Mansehra, and Haripur). One hundred and twenty secondary schools served as
sample for this study. The dropout rate for the year 1999-2000 was compared with the dropout rate of
2003-2004. A questionnaire was designed to collect relevant information. The questionnaire contained 20
items. The collected data was analyzed by using SPSS version 16. In the light of analysis it was observed
that the devolution of power plan has played significant role in reducing students’ dropout rate at secondary
level. It was also observed that devolution of power plan has reduced dropout rate of male students much
more than the female students.
Keywords: Devolution of Power, Dropout
1. Introduction
Devolution is usually defined as a mean of devolving political power in order to decentralize
administrative and financial authority at grass root level. The main objective of devolution is to provide
good governance, effective delivery of services and transparent decision making through institutionalized
participation of the local people. (Alderfer, 1964). In Pakistan, Devolution of Powers Plan was introduced
in 2000 and was implemented through the Local Government Ordinance 2001.The main objective of this
plan was to empower common masses at gross root-level and to facilitate them with better service delivery
at their doorstep. Under this Plan, political power, decision-making authority and administrative
responsibilities have been moved as closes as possible to the village, union council, tehsil and district level,
with only the major policy-making, coordination, and special service functions being retained with the
central and provincial governments. (Shami, 2005).The Devolution of Powers Plan was designed on the
bases of five fundamentals: devolution of political power, decentralization of administrative authority,
deconcentration of management functions, diffusion of the power-authority nexus, and distribution of
resources to the district level. (DOP Plan, 2000).The primary objective of the devolution plan and
decentralization in education was to involve and empower local community in planning, management,
monitoring and evaluation of service delivery interventions at the grass-root level. (MSU, 2001).The term
“dropout” is referred for a person who withdraws from school before graduating (Webster’s new world
1
2. Developing Country Studies www.iiste.org
ISSN 2224-607X (Paper) ISSN 2225-0565 (Online)
Vol 2, No.2, 2012
college dictionary).Colorado department of education defined drop out as students who leave school
during an academic / school year (http: // www.cde.state.co.us /cdereval? rvdefine.htm retrieved on
14-5-2009).A variety of definitions can be used to reflect dropout rates and the calculation of these rates
varies according to how the concept is defined (Thurlow, Johnson, & Sinclair, 2002). The media and other
stakeholders often quote high dropout rate as an indicator for the success or failure of schools (US
department of education, 1996).NCES, 1993 reported three types of dropout rates:
Event rates mean the percentage of students who leave school in a single academic year.
Status rates refer to the percentage of the population in a certain age group who have not either
completed high school or are not enrolled in school at one point in time.
Cohort rates represent the percentage of a single group of students who drop out over time.
Dropout students neither have basic skills nor vocational training and it is highly probable that they will
face problems in finding a job (European Commission, 2001). Dropped out students not only waste their
time but they are also a cause of wasting national money. According to Reyes and Valencia, (1995)
dropping out of school is a matter of concern even in American society where attendance is compulsory and
education is highly valued.
2. Statement of the Problem
Dropout is an important factor effecting qualitative improvement and quantitative expansion of education.
It was imperative to assess the effect of devolution of powers plan on students’ dropout rate. Therefore the
study was conducted with the title, “Impact of devolution of power plan on students’ dropout rate at
secondary level in Hazara division”
3. Objectives of the Study
Following were the objectives of this study.
1. To find out effect of DOP plan on students’ dropout rate at secondary level.
2. To compare students’ dropout rate before and after the DOP Plan.
4. Null Hypotheses
The following Null Hypotheses were tested:
1. There is no significant difference between students’ dropout rate before and after the DOP Plan.
2. There is no significant difference between male students’ dropout rate before and after the DOP
Plan.
3. There is no significant difference between female students’ dropout rate before and after the DOP Plan.
4. There is no significant difference between male students’ dropout rate and the female students’ dropout
rate before DOP plan.
5. There is no significant difference between male students’ dropout rate and the female students’ dropout
rate before DOP plan.
2
3. Developing Country Studies www.iiste.org
ISSN 2224-607X (Paper) ISSN 2225-0565 (Online)
Vol 2, No.2, 2012
5. Research Methodology
This study was an evaluative study for which survey research methodology was adopted. Population of the
study comprised of principals, headmasters and headmistresses of secondary schools of Abbottabad,
Mansehra and Haripur districts. The total number of secondary schools in these districts is 270. One
hundred and fifty schools were randomly selected as sample for the study. A descriptive research
methodology was used for the study during which a questionnaire consisting of twenty items was
developed. The questionnaire was comprised of two parts. The first part was concerned with figures about
dropout before and after the implementation of devolution of powers plan while the second part was mainly
consisted of questions regarding information about effectiveness of DOP plan. In order to check the
validity of the research instrument, the researcher got opinion of experts and specialists in the relevant field.
In the light of feedback, instrument was improved and refined. The reliability of the instrument was
measured by means of split half techniques and Pearson product-moment raw score method and
Spearmen-Brown Prophecy formula.
6. Conclusions
The study revealed that devolution of powers plan has played vital role in enhancing and developing
education at grass root level. After the implementation of devolution of powers plan 2001, drastic changes
have been observed in education department. Post devolution, it was become easy for administrators to run
their institutions in an effective and efficient way. After devolution, significant decrease has been observed
in Students’ dropout rate at secondary level. Findings of the study reflected that as compared to females’
dropout rate, much more control has been observed in males’ dropout rate.
7. Recommendations
On the bases of findings and conclusions, the researchers have made following recommendations that may
help educationists and policy makers to get an insight regarding devolution arrangements and to rethink and
remodel their opportunities. Government functionaries and administrators at district level should be
provided awareness with regard to their role and job description. Officials at district level should truly be
made empowered and in order to ensure better and focused performance, their job description should
clearly be laid down. Unnecessary political interference in education department must be controlled but
local community involvement in schools’ affairs should be encouraged and made meaningful. Parents
Teachers Associations should be made more effective and empowered. Parents and other community
members should be taken in confidence while schools affairs are being discussed. Parents should be given
incentives for sending their children to school.
References
Alderfer,H.F.(1964). Local Government in the Third World, Mc. Graw Hill, p.43
European Commission, (2001); European Report on Quality of School Education, Luxembourg,
Publication of the European Commission
3
4. Developing Country Studies www.iiste.org
ISSN 2224-607X (Paper) ISSN 2225-0565 (Online)
Vol 2, No.2, 2012
Government of NWFP. (2001). Local Govt Ordinance2001,Peshawar, Pakistan. p.80.
Government of Pakistan. (2000). Local Govt Plan, 2000, Islamabad, Pakistan. p.1 2.
Govt of Pakistan. (2002). Devolution and Decentralization, Identification of Progress in Implementation in
Education, MSU Islamabad, 35, 36.
Reyes, P. and Valencia, R. R (1995); Educational Policy and the Growing Latino Student Population,
Problems and Prospects, in Padilla, A (Ed), Hispanic Psychology, Critical Issues and Theory and Research.
Thousands Oaks, USA
Table: 1 Comparison of Students’ Dropout Rates (Male and Female) Before and After Devolution of
Powers Plan
Group N Mean SD t p
Before DOP (Male and 120 15.28 5.26
Female)
9.60 0.0001
After DOP(Male and 120 9.1 4.7
Female)
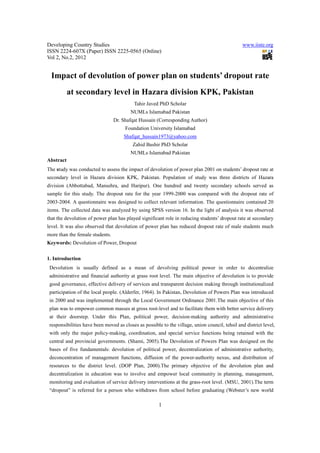
Table: 1 shows the comparison of cumulative dropout rate of male and female before and after the
implementation of devolution of powers plan. The mean of dropout before the DOP was 15.28 with S D
5.26, while mean of dropout after DOP was 9.1 and S D 4.7. The calculated value of t is 9.60 which are
greater than the tabulated value (1.96) at 0.05 level. Thus the H01 was rejected.
Table: 2 Comparisons of Students’ Dropout Rates (Male) Before and After Devolution of Powers Plan
Group N Mean SD t p
Before DOP (Male) 60 17.22 5.12
8.21 0.0001
After DOP(Male) 60 10.13 4.3
Table: 2 shows the comparison of dropout rate of male students before and after the implementation of
devolution of powers plan. The mean of dropout before the DOP was 17.22with S D 5.12, while mean of
dropout after DOP was 10.13and S D 4.3. The calculated value of t is 8.21 which is greater than the
tabulated value (1.96) at 0.05 level. Thus the H02 was rejected.
Table: 3 Comparisons of Students’ Dropout Rates (Female) Before and After Devolution of Powers
Plan
Group N Mean SD t p
Before DOP (Female) 60 13.34 4.69
6.05 0.0001
After DOP(Female) 60 8.07 4.9
Table: 3 shows the comparison of dropout rate of female students before and after the implementation of
devolution of powers plan. The mean of dropout before the DOP was 13.34 with S D 4.69, while mean of
dropout after DOP was 8.07 and S D 4.9. The calculated value of t is 6.05 which is greater than the
4
5. Developing Country Studies www.iiste.org
ISSN 2224-607X (Paper) ISSN 2225-0565 (Online)
Vol 2, No.2, 2012
tabulated value (1.96) at 0.05 level. Thus the H03 was rejected.
Table: 4 Comparisons of Dropout Rates (Male) with Dropout Rates (Female) Before Devolution of
Powers Plan
Group N Mean SD t p
Before DOP (Male) 60 17.22 5.12
4.32 0.0001
Before DOP (Female) 60 13.34 4.7
Table: 4 shows the comparison of dropout rate of male students with female students before the
implementation of devolution of powers plan. The mean of dropout of male students before the DOP was
17.22 with S D 5.12, while mean of dropout of female students before DOP was 13.34 and S D 4.7. The
calculated value of t is 4.32 which is greater than the tabulated value (1.96) at 0.05 level. Thus the H04 was
rejected.
Table: 5 Comparisons of Dropout Rates (Male) with Dropout Rates (Female) After Devolution of
Powers Plan
Group N Mean SD t p
After DOP (Male) 60 10.13 4.3
2.45 0.016
After DOP (Female) 60 8.07 4.9
Table: 5 shows the comparison of dropout rate of male students with female students after the
implementation of devolution of powers plan. The mean of dropout of male students after the DOP was
10.13 with S D 4.3, while mean of dropout of female students after DOP was 8.07 and S D 4.9. The
calculated value of t is 2.45 which is greater than the tabulated value (1.96) at 0.05 level. Thus the H05 was
rejected.
Figure 1
1 8
1 6
1 4
1 2
1 0 B e f o r e D O P
8 A f t e r D O P
6
4
2
0
M e a n S D t v a lu e
Figure 2 2 0
1 8
1 6
1 4
1 2
B e f o re D O P (M ale )
1 0
A f te r D O P ( M a le )
8
6
4
2
0
M ean S D t v a lu e
5
6. Developing Country Studies www.iiste.org
ISSN 2224-607X (Paper) ISSN 2225-0565 (Online)
Vol 2, No.2, 2012
Figure 3
15
10
Before… After…
5
0
Mean SD t value
Figure 4
20
18
16
14
12
Bef ore DOP(Male)
10
Bef ore DOP(Female)
8
6
4
2
0
Mean SD t value
Figure 5
12
10
8
A f te r D O P ( M a l e )
6
A f te r D O P ( F e m a l e )
4
2
0
M ean S D t v a lu e
6