Welding Electrode Making Machine By Deccan Dynamics
Modeling asymmetric volatility in the nigerian stock exchange
1. European Journal of Business and Management www.iiste.org
ISSN 2222-1905 (Paper) ISSN 2222-2839 (Online)
2839
Vol 4, No.12, 2012
Modeling Asymmetric Volatility in the Nigerian Stock Exchange
Emenike Kalu O.1* Aleke Stephen Friday2
1. Department of Banking and Finance, Rhema University, P.M.B. 7021 Aba, Abia State, Nigeria
University,
2. Department of Banking and Finance, Ebonyi State University, P.M.B. 053 Abakaliki, Ebonyi State,
Nigeria
∗ E-mail of the corresponding author: emenikekaluonwukwe@yahoo.com
mail
Abstract
This paper examines the response of volatility to negative and positive news using daily closing prices of the
Nigerian Stock Exchange (NSE). By applying EGARCH (1,1) and GJR GARCH (1,1) models to NSE daily
GJR-GARCH
stock return series from January 2nd 1996 to December 30th 2011, we find strong evidence supporting
y
asymmetric effects in the NSE stock returns but with absence of leverage effect. Specifically, the estimates from
EGARCH model show positive and significant asymmetric volatility coefficient. In the same way, results of the
coefficient.
GJR-GARCH model show negative and significant asymmetric volatility coefficient, also supporting the
GARCH
existence of positive asymmetric volatility. Overall results from this study provide support for positive news
producing higher volatility in the immediate future than negative news of the same magnitude in Nigeria.
ng
Keywords: Returns volatility, Asymmetric effects, GARCH models, Nigerian Stock Exchange.
1. Introduction
An important assumption of the classical linear regression model is that the variance of all squared errors is
regression
homoscedastic; that is they all have the same variance (Gujarati, 2003: 387; Rachev et al., 2007: 279). Numerous
empirical studies have however shown that stock return series exhibit heteroscedasticity, where the variances of
heteroscedasticity,
the error term are not equal, and in which error terms may be expected to be larger for some observations or
periods of the data than for others. For instance, Mandelbrot (1963) found evidence of the tendency of large
)
changes in asset prices (either positive or negative) to be followed by large changes and small changes to be
followed by small changes. The issue then became how to construct models that accommodate heteroscedasticity
so that valid coefficient estimates are obtai
obtained for the variance of the error terms. Engle (1982) introduced the
autoregressive conditional heteroscedasticity (ARCH) model to model volatility by relating the conditional
variance of the error term to the linear combination of the squared error terms in the recent past. As a result of the
long lag length and large parameters required to estimate ARCH model, Bollerslev (1986) introduced the GARCH
model by modeling the conditional variance to depend on its lagged values as well as squared lagged values o theof
error terms. After the seminal ARCH paper by Engle (1982) and the generalization by Bollerslev (1986), the
study of volatility has received substantial attention from researchers, practitioners and policy makers. This
substantial interest is due to the fact that volatility, as a proxy for risk, is useful for risk management, pricing
he
equity as well as option-type derivative instruments
type instruments.
Although the ARCH and GARCH models have been very successful in capturing volatility clustering, there
are some features of the financial time series data which they failed to capture. The most interesting feature not
res
addressed by these models is the asymmetric effects, which considers the response of volatility to negative and
positive news. Asymmetric effects are captured by asymmetric models such as the Exponential GARCH
captured
(EGARCH) of Nelson (1991), the GJR GARCH model introduced by Glosten, Jagannathan, and Runkle (1993),
GJR-GARCH
Asymmetric Power ARCH (APARCH) of Ding, Engle and Granger (1993), and Threshold GARCH (TGARCH)
model due to Zakoian (1994), and so many other models. The most celebrated asymmetric effect is the leverage
effect. First documented by Black (1976), leverage effect implies that a negative shock to the conditional
variance tends to cause volatility to rise by more than a positive shock of the same magnitude.
by
In his explanation of the leverage effect, Black (1976) notes that a fall in the value of a firm’s stock will
cause a negative return on its stock, and will usually increase the leverage of the stock whi will cause a rise in
which
the debt-equity ratio. This increase in leverage raises the riskiness of the firm as the shareholders perceive their
equity
future cash flow stream as being relatively more risky thereby leading to higher levels of volatility. Volatility
feedback is another explanation for asymmetric effects offered by Campbell and Hentschel (1992). To them,
eedback
volatility is a measure of risk; hence an increase in volatility signals a higher risk and also higher expected future
risk. To bear this risk, investors will require higher returns and are thus inclined to pay less for the relevant
rs
equity. Avramov et al. (2006) explain that stock trading activity causes asymmetric effects. In this explanation,
uninformed traders sell when stock prices fall, leading to an increase in stock returns volatility, while informed
an
investors sell after stock price rises, which leads to a decline in volatility. So many other empirical works have
also confirmed the existence of leverage effect in different stock markets across the globe (see, Black, 1976;
52
2. European Journal of Business and Management www.iiste.org
ISSN 2222-1905 (Paper) ISSN 2222-2839 (Online)
2839
Vol 4, No.12, 2012
Christie, 1982; Nelson, 1991; Goudarzi and Ramanarayanan, 2011; Abdalla, 2012))
Although asymmetric volatility phenomenon is well documented in literature of developed and emerging
stock markets, there are some evidence indicating lack of asymmetric behaviour particularly in emerging stock
markets (see for example, Alagidede and Panagiotidis, 2009; Charlse, 2010; Cheng, Jahn Jahn-Paver and Rothman,
2010; Oskooe and Shamsavari, 2011). There are also studies that document evidence to sho that positive
show
returns are associated with higher volatility than negative returns of the same magnitude (see for example,
Ogum, Beer and Nouyrigat (2005; Saleem, 2007; Aliyu (2011)
In Nigeria, literature on asymmetric volatility is still scanty but growi
growing. Ogum, Beer and Nouyrigat (2005)
reports, amongst others, that volatility clustering and asymmetric volatility found in the United States and other
developed markets are also present in Nigeria. They also report positive and significant asymmetric volat volatility
coefficient in Kenya, which suggests that positive shocks increase volatility more than negative shocks of the
same magnitude. Olowe (2009) found, amongst others, evidence of volatility persistence and leverage effects. In
contrast to olowe, Okpara and Nwezeaku (2009) argue that volatility clustering is not quite persistent but there
nd
exists asymmetric effect in the Nigerian stock market. They concluded that unexpected drop in price (bad news)
increases predictable volatility more than unexpected increase in price (good news) of similar magnitude in
increase
Nigeria. Emenike (2010) documents evidence to show asymmetric volatility, volatility clustering and volatility
persistence in the NSE monthly returns data. More recently, Okpara (2011), provide evidence to s support the
findings of Okpara and Nwezeaku (2009). He reports that there is low persistence of volatility clustering and that
there is a leverage effect in the Nigerian Stock Exchange. Aliyu (2011) shows weak support for leverage effect
in Nigeria but document strong evidence to show that positive news increases volatility more bad news of the
ment
same magnitude in Ghana. Onwukwe, Bassey and Isaac (2011) found evidence of volatility clustering and
leverage effect in the return series of UBA, Unilever, Guiness and Mobil. The empirical regularity in volatility
literature from Nigeria is the existence of volatility clustering and asymmetric volatility, but volatility persistence
is contended. It is also observed that most of the studies were conducted using monthly data.
In this study, our aim is to model and estimate the daily volatility of stock returns on the Nigerian Stock
Exchange (NSE) by using symmetric and asymmetric GARCH models that capture asymmetry. This is to
provide insight into the response of volatil to negative and positive news as well as extend existing literature
volatility
on volatility in Nigeria. This paper is structured into four sections. Immediately preceding Introduction in
Section 1 is Section 2, which outlines the nature of data and methodology. Section 3 presents the empirical
results for the NSE, and Section 4 embodies the concluding remarks.
2. Data and Methodology
2.1 Data for Analysis
In order to examine the Nigeria stock returns volatility for asymmetric effect, we use daily closing prices of the
Nigerian Stock Exchange weighted All share index, from January 2, 1996 to December 30, 2011. This gives a
All-share
total of 3930 observations. Market prices index are transformed to daily returns thus:
pt
Rt = Log
pt − 1
(1)
Where: Rt is daily return of the All
rn All-share Index for dayt, Pt is current day index closing price, Pt-1 is closing
price of the previous day index, and Log is Natural Logarithm.
2.1.1 Descriptive Statistics
Descriptive statistics of daily returns are presented in Table 1 to aid our understanding of the nature and
distributional characteristics of the NSE return series. The computed statistics include daily mean return (as well
as minimum and maximum returns), standard deviation, skewness, kurtosis, and Jarque Bera.
Jarque-Bera.
From Table 1, we observe that the average daily return is 0.04%. The daily standard deviation is 0.9%,
,
reflecting a high level of dispersion from the average return in the market. The wide gap between the maximum
(9.77%) and minimum (-6.73%) returns gives support to the high variability of price changes in the NSE.
6.73%) the
Another glaring characteristic of the statistics shown in Table 1 is high kurtosis coefficient. In a normally
distributed series, kurtosis is 3. The high kurtosis value of 6.
6.9665 suggests that big shocks of either sign are more
likely to be present and that the return series is clearly leptokurtic. Similarly, zero (0) skewness coefficient
indicates evidence of lack of asymmetry, while Positive or negative skewness indicate asymmetry in a series.
The skewness coefficient of 0.1706 is positively skewed. Positive skewness implies that the distribution has a
long right tail, implying that large positive movements in stock prices are not usually matched by equally large
negative movements. The null hypotheses of zero (0) skewness and kurtosis coefficient of 3 were rejected at 1%
. zero
p-value suggesting that the NSE daily returns series do not follow normal distribution. The rejection of normal
value
53
3. European Journal of Business and Management www.iiste.org
ISSN 2222-1905 (Paper) ISSN 2222-2839 (Online)
2839
Vol 4, No.12, 2012
distribution in the NSE daily series was confirmed with Jarque
Jarque-Bera test as its associated marginal significance
ts
level is far below 1% confidence level.
Since NSE return series do not follow normal distribution, the asymmetric GARCH models are estimated
with the Generalized Error Distribution (GED) which takes into account the fat tail characteristic of stock returns
distribution.
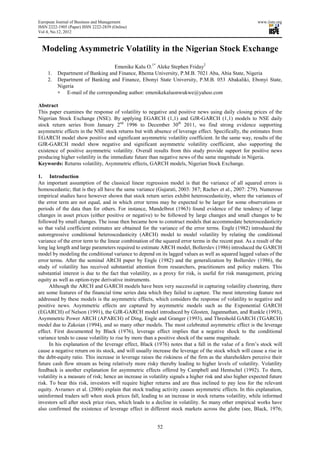
Figure 1 shows the daily logarithmic returns of the NSE All share index for the period January 2, 1996 to
All-share
December 30, 2011 – 3930 observations in all. A visual inspection of Figure 1 shows that returns f fluctuate
around the mean value. The fluctuations are both in positive and negative region with clustering in volatile
periods alternated by periods of calm. This behaviour of stock returns series suggests volatility clustering in the
NSE, where large returns tend to be followed by large returns and small returns following small returns. The
ns
implication of volatility clustering is that volatility shocks today will influence the expectation of volatility in the
immediate future periods. On the other hand, Figure 2, shows the plot of the log level data of the NSE for the
ure
sample period. It is easy to see the great growth of the series and its subsequent decline as a result of the effect of
global economic crises on Nigeria. It is trending.
2.1.2 Unit Root Tests for the NSE Daily Index
To test for possible unit roots in the NSE returns series, Table 2 presents results of the unit root tests on the
logarithmic level and stock return. Testing methodology is the Augmented Dickey Fuller (ADF). The critical
Dickey-Fuller
value is 5% level of significance to avoid the problem of accepting a false null hypothesis. The critical value of
%
the ADF test is -2.863. The ADF test accepts the null hypothesis of unit roots in logarithmic level (i.e., logindex
2.863.
~ I(1), but reject it in the return series ( t ~ I(0)). In the return series, the computed tau values of the ADF
(R
(-31.2496) exceeds the critical value in the NSE returns series, thereby confirming the alternative hypothesis of
)
no unit root for return series as the computed tau values far exceed the critical values. This result supports earlier
exceed
findings that the NSE return series is stationary (Olowe, 2009; Emenike, 2009).
2.2 Methodology
In order to examine the presence of asymmetric volatility in the Nigerian Stock Exchange, we first analyz the
analyze
dynamics of stock returns volatility. To this end, we apply the Generalized Autoregressive Conditional
Heteroskedasticity (GARCH) model. In the volatility modeling process using GARCH models, the mean and
variance of the series are estimated simultaneously. GARCH (1,1) model for stock returns, assuming that the
simultaneously.
distribution of the return series for periodt, conditional on all previous returns (or information), is normal can be
estimated as:
Rt = θ + εt (2)
εt ~ (0, σ t2 )
σ t2 = ω + α 1ε t2−1 + β 1σ t2−1 (3)
Where Rt represents the return at dayt, θ is the mean return, and εt is the error term. Equation 3 specifies that
the conditional variance (Ϭ2t), whic represent volatility at dayt, is the weighted average of three different
which
variance forecasts: ω is the constant variance that correspond to the long run average, α1 refers to a first order
ARCH term which transmits news about volatility from the previous period and β1, the first order GARCH term,
is the new information that was not available when the previous forecast was made (Engle, 2003). The
non-negativity restrictions of GARCH (1,1) are ω > 0, α1 > 0 and β1 ≥ 0. Statistical significance of the paramet
. parameters
is tested using marginal significance level and t-statistics. Under the null hypothesis of no GARCH effects (i.e.
no volatility clustering in the NSE daily series), marginal significance level of parameter β1 should be greater
than the critical level (0.05) and computed t-statistics will be lesser than theoretical t (±1.96). The sum of α1 and
0.05)
β1 indicate persistence in volatility clustering and varies from 0 to 1. The closer (α1 + β1) to 1, the more persistent
is volatility clustering.
One of the significant weaknesses in the GARCH (1,1) model is its premise of symmetric response of stock
ficant
returns volatility to positive and negative shocks. This weakness is due to the fact that conditional variance in the
basic model is a function of the (squared) magnitudes of the lagged residuals, regardless of their signs ((Oskooe
magnitudes
and Shamsavari, 2011)). In order to capture asymmetric effect in the volatility of stock returns, two extensions of
the basic GARCH model were estimated, among other possibilities: the Threshold Autoregressive Conditional
Threshold
Heteroskedasticity (GJR-GARCH) and the Exponential Generalized Autoregressive Conditional
GARCH)
Heteroskedasticity (EGARCH)
Nelson (1991) introduced a number of refinements on the GARCH model in using EGARCH to detect
54
4. European Journal of Business and Management www.iiste.org
ISSN 2222-1905 (Paper) ISSN 2222-2839 (Online)
2839
Vol 4, No.12, 2012
asymmetric volatility in the stock return series. The first of these refinements was to model the log of the
olatility
variance, rather than the level. This ensures that the estimated conditional variance is strictly positive, thus
non-negativity constraints of the ARCH and GARCH models are not necessary. The second is that the γ
negativity GARCH
parameter typically responds asymmetrically to positive and negative values. In this method, asymmetric effects
are estimated using the following equation:
εt − 1 2
log σ = ω + α 1
2 − + β log σ 2 + γ ε t −1 (4)
t
σ2 π
t −1
σ t2−1
t −1
Here, the γ coefficient signifies asymmetric effects of shocks on volatility. The presence of asymmetric
effects can be tested by the hypothesis that γ=0. A zero γ coefficient would imply that positive and negative
.
shocks of the same magnitude have the same effect on volatility of stock returns. The effect is asymmetric if γ≠0.
If the γ coefficient is negative, then negative shocks tend to produce higher volatility in the immediate future
than positive shocks. The opposite would be true if γ were positive.
Similarly, Glosten, Jagannathan and Runkle (1993) proposed a modification of the original GARCH model
ly,
using a dummy variable to capture asymmetric effects in financial time series. In GJR GARCH model, there are
GJR-GARCH
two types of news: there is squared return and there is a variable that is the squared return when returns are
negative and zero otherwise. The coefficients are now computed in the long run average ( (ω), the previous
forecast (α1), symmetric news (β1), and negative news ( ). On this basis, Glosten, Jagannathan and Runkle (1993)
(γ).
introduced the following GJR-GARCH model for the conditional variance:
GARCH
σ t2 = ω + α ε t2−1 + β 1σ t2−1 + γµt2−1Iµ < o ( µt − 1)
1 (5)
Where, I is an indicator function. In this formulation, the effects of positive and negative news on the
conditional variance are completely different. The news effect is asymmetric if γ ≠ 0. If the γ coefficient is
.
positive, then negative shocks tend to produce higher volatility in the immediate future than positive shocks.
produce
The opposite would be true if γ were negative. β1 measures clustering in the conditional variance and α1+ β1 +
γ/2 measures persistence of shocks on volatility. If the sum is less than one the shock is not expected to last for a
long time but if it is close to one then volatility can be predicted for some time. However, if the sum of the
coefficients is one then shock is going to affect volatility for indefinite future.
3. Empirical Results and Discussion
In this section, we present the estimates of different GARCH models as well as brief discussion of the results.
The GARCH models are estimated using Maximum Likelihood estimators assuming Normal Distribution for
symmetric GARCH models and Generalized Error Distribution (GED) for asymmetric GARCH models. The
eneralized
choice of GED is due to the presence of excess kurtosis in the NSE daily return series. The Broyden, Flectcher,
Goldfarb and Shanno (BFGS) iterative algorithm was used to obtain optimal parameter estimates and relevant
parameter
standard errors. The analysis is done using RATS version 7.0 econometric software.
The maximum likelihood estimates for the GARCH (1,1) model for the NSE return series are presented in
Table 3. The coefficients of all the three parameters in the conditional variance equation ( α1 and β1), are
(ω,
highly significant, at 1% confidence levels, as measured by their t-statistics; and all satisfy the non
statistics; non-negativity
restrictions of the model. The significance of ARCH parameter ( 1) indicates that the news about volatility from
(α
the previous day has explanatory power on current volatility. In the same way, statistical significance of the
GARCH parameter (β1) does not only indicate explanatory power on current volatility but also sugges volatility
suggests
clustering in the daily returns of the NSE. The lagged conditional variance estimate (β1) has coefficient 0.75,
(β
implying that 75% of a variance shock remains the next day. Volatility persistence, like we noted in section 3.2,
is measured by the sum of α1 and β1. From the estimates in Table 3, the NSE daily returns have high persistence
in volatility with α1 + β1 = 1.066. High persistence implies that average variance will remain high since increases
in conditional variance due to shocks will decay slowly (Rachev et al., 2007: 296). Evidence of persistence in
decay
volatility shocks abound in literature (see, Emenike, 2010; Oskooe and Shamsavari, 2011; Abdalla, 2012)
Also given in Table 3 are estimates obtained from EGARCH and GJR-GARCH asymmetric volatility
GARCH
models. These estimates are used to examine the existence of asymmetry in stock returns volatility of the NSE.
According to reported EGARCH results, the γ coefficient, which measures asymmetric effect, is greater than
zero. The positive γ coefficients are shown by the marginal significance level. Marginal significance level less
than the critical level lead to rejection of the null hypothesis of zero coefficients. The marginal significance level
coefficients.
for the γ coefficient of the EGARCH model ( (0.00635) is clearly significant at 1% confidence level. More so, the
)
t-statistics also rejects γ=0 hypothesis. The computed t t-value (2.7286) is far greater than the theoret
) theoretical t-value
55
5. European Journal of Business and Management www.iiste.org
ISSN 2222-1905 (Paper) ISSN 2222-2839 (Online)
2839
Vol 4, No.12, 2012
(1.96) for a two-tailed test with asymptotic degrees of freedom, thereby rendering the γ coefficient statistically
tailed
significant. Statistically significant γ coefficient indicates that the null hypothesis of no asymmetric effect in the
volatility of NSE is false. In other words, there is asymmetric effect in the volatility of stock returns of the
y
Nigerian stock market. In contrast to leverage effect, the γ coefficient is positive, suggesting that positive shocks
tend to produce higher volatility in the immediate future than negative shocks of the same magnitude in the
Nigerian stock market. This result agrees with the positive skewness of our descriptive statistics in section 2.1.1.
Furthermore, the GJR-GARCH model estimates in Table 3 also confirm the evidence of asymmetry in the
GARCH confirm
stock returns volatility of the NSE. This is confirmed by a marginal significance level (0.01941 lesser than the
0.01941)
confidence levels (i.e., 0.05) and a t--statistics (-2.3374) greater than table t-statistics in absolute v
statistics value (1.960). As
noted in section 3.2, positive (negative) γ coefficient indicate that negative (positive) shock tends to produce
higher volatility in the immediate future than positive (negative) shocks. According to results given in Table 4,
the γ coefficient is negative, indicating that positive shock tends to produce higher volatility in the immediate
icient
future than negative shock of the same magnitude, thereby suggesting absence of leverage effect in Nigeria.
Evidence of volatility clustering given in GARCH (1,1) estimates above is also confirmed by high statistical
GARCH
significance of the GARCH term (β1) and ARCH term (α1). Similarly, sample evidence shows that volatility
clustering is persistent in Nigeria stock returns on the basis of sum of α1 + β1+ γ/2 =1.0796. This implies that
1.0796.
volatility shocks can be predicted for several days in the NSE. The rejection of leverage effect is consistent with
some of the prior studies (see for example, Ogum, Beer and Nouyrigat, 2005; Saleem, 2007; Surya, 2008, Aliyu,
2011); but disagrees with others (see, Nelson, 1991; Olowe, 2009; Okpara, 2011).
4. Conclusion
In this study, we examined the volatility of Nigerian Stock Exchange return series for evidence of asymmetric
effects by estimating GARCH (1,1), EGARCH and GJR GARCH models. Asymmetric model (EGARCH and
GJR-GARCH
GJR-GARCH) were fitted to the daily returns d ranging from 3rd January 2006 to 30th December 2011. The
GARCH) data
results obtained from GARCH (1,1) model show evidence of volatility clustering and volatility persistence in
Nigeria. Similarly, estimates from asymmetric models indicate that there is asymmetric volatility effect in
Nigeria. Contrary to leverage effect theoretical sign, result of EGARCH model estimate is positive suggesting
that positive news increases volatility more than negative news. In the same way, estimated results from the
GJR-GARCH model show the existence of a negative coefficient for the asymmetric volatility parameter thereby
providing support to the EGARCH result of positive news producing higher volatility in immediate future than
negative news of the same magnitude in Nigeria.
Overall results from this study provide strong evidence that positive shocks have higher effect on volatility
all
than negative shocks of the same magnitude. The results also show volatility clustering and high volatility
persistence in Nigeria.
References
Alagidede, P. and Panagiotidis, T. (2009). Modelling Stock Returns in Africa’s Emerging Equity Markets.
ede,
International Review of Financial Analysis 18, 1-11. http://dx.doi.org/10.1016/j.irfa.2009.02.001
Analysis,
Aliyu, S.U.R. (2011). Does inflation has an impact on Stock Returns and Volatility? Evidence from Nigeria and
Ghana. International Conference on Economics and Finance Research Singapore. [Online] Available:
http://www.csae.ox.ac.uk/conferences/2011-EDiA/papers/054-Aliyu.pdf (May 11, 2012)
http://www.csae.ox.ac.uk/conferences/2011
Avramov, D., Chordia, T. and Goyal, A. (2006). The Impact of Trades on Daily Volatility. The Review of
Financial Studies, 19 (4), 1214-1277. http://dx.doi.org/10.1093/rfs/hhj027
1277.
Black, F. (1976). Studies of Stock Market Volatility Changes. Proceedings of the American Statistical
Association, Business and Economic Statistics Section pp. 177–181.
Section,
Bollerslev, T. (1986). A Generalized Autoregressive Conditional Heteroscedasticity. Journal of Econometrics
Econometrics,
31, 307-327.
Campbell, J.Y. and Hentschel, L. (1992). No News is Good News: An Asymmetric Model of Changing
Volatility in Stock Returns. Journal of Financial Economics,
Economics 31, 281-318.
http://dx.doi.org/10.1016/0304-405X(92)90037
405X(92)90037-x
Charlse, A. (2010). The Day-of-the-week Effects on the Volatility: The Role of Asymmetry. European Journal
-week
of Operational Research, 202, 143-142. http://dx.doi.org/10.1016/j.ejor.2009.04.022
142.
Cheng, A. R., Jahn-Paver, M. R. and Rothman, P. (2010). An Empirical Investigation of Stock Market
Paver,
Behaviour in the Middle East and North Africa. Journal of Empirical Research 17, 413-427.
Research,
http://dx.doi.org/10.1016/j.jempfin.2009.11.002
Christie, A A (1982). The Stochastic Behaviour of Common Stock Variance - Value, Leverage and Interest Rate
Effects. Journal of Financial Economics 10(4), 407-432. http://dx.doi.org/10.1016/0304-405X(82)90018
Economics, 405X(82)90018-6
Ding, Z., Engle, R.F. and Granger, C.W.J. (1993). Long Memory Properties of Stock Market Returns and a New
56
6. European Journal of Business and Management www.iiste.org
ISSN 2222-1905 (Paper) ISSN 2222-2839 (Online)
2839
Vol 4, No.12, 2012
Model. Journal of Empirical Finance, 1, 83-106.
Emenike, K. O. (2009). An Empirical Test for Weak form Efficient Market Hypothesis of the Nigerian Stock
Weak-form
Exchange. Journal of Business Administration and Ma Management, Vol. 4 (4), 118-133. [Online] Available:
133.
http://ssrn.com/abstract=1291273 (May 11, 2012)
Emenike, K. O. (2010). Modelling Stock Returns Volatility in Nigeria Using GARCH Models. African Journal
of Management
anagement and Administration,
Administration Vol. 3 (1), 8-15. [Online] Available:
http://mpra.ub.uni-muenchen.de/22723/ (May 11, 2012)
muenchen.de/22723/
Engle, R.F. (1982). Autoregressive Conditional Heteroscedasticity with Estimates of the Variance of the United
Kingdom Inflation. Econometrica, 50,987
, 50,987-1008. http://dx.doi.org/10.2307/1912773
Engle, R.F. (2003), “Risk and Volatility: Econometric Models and Financial Practice”, Noble Lecture
(December 8), Salomon Centre New York
Glosten, L., R. Jagannathan, and D. Runkle (1993). On the Relation between Expected Value and the Volatility
of the Nominal Excess Return on Stocks. Journal of Finance, 48(5), 1779 , 1779–1801.
http://dx.doi.org/10.2307/2329067
Goudarzi, H. and Ramanarayanan, C.S. (2011). Modeling Asymmetric Volatility in the Indian Stock Market.
International Journal of Business and Management Vol. 6 (3): 221-231. [Online] Available:
Management,
www.ccsenet.org/journal/index.php/ijbm/article/download/9714/6964 (June 04, 2012)
Gujarati, D.N. (2003). Basic Econometrics (4th Ed), Delhi: McGraw Hill Inc., (Chapter 11).
Henry, O. (1998). Modelling Asymmetry of Stock Market Volatility. Applied Financial Economics Vol. 8:
, Economics,
145-153.
Mandelbrot, B. (1963). The Variation of Certain Speculative Prices. Journal of Business 36 (4), 394-419.
Business,
[Online]
http://web.williams.edu/Mathematics/sjmiller/public_html/341Fa09/econ/Mandelbroit_VariationCertainSpeculat
ivePrices.pdf
Nelson, D. (1991). Conditional Heteroscedasticity in Asset Returns: A New Approach. Econometrica, 59 (2),
Heteroscedasticity
347-370. http://dx.doi.org/10.2307/293826
370.
Ogum, G.; Beer, F. and Nouyrigat, G. (2005). Emerging Equity Market Volatility: An Empirical Investigation of
Markets in Kenya and Nigeria. Jour
Journal of African Business, 6, (1/2), 139-154.
Okpara, G.C. and Nwezeaku, N.C. (2009). Idiosyncratic Risk and the Cross-Section of Expected Stock Returns:
Section
Evidence from Nigeria. European Journal of Economics, Finance and Administrative Sciences 17, 1-10.
Sciences,
[Online] Available: http://www.eurojournal.com/ejefas_17_09.pdf (May 28, 2012)
Okpara, G. C. (2011). Volatility Modeling and the Nigerian Stock Return Relationship in EGARCHEGARCH-in-Mean
Framework. International Journal of Current Research Vol. 3 (8), 176-185. [Online] Available:
tional Research, 185.
http://www.journalcra.com/?q=node/758 (May 11, 2012)
Olowe, R.A. (2009). Stock Return, Volatility And The Global Financial Crisis In An Emerging Market: The
Crisis
Nigerian Case. International Review of Business Research Papers, Vol. 5( 4), 426-447. [Online] Available:
447.
http://www.bizresearchpapers.com/35.olowe-.pdf (June 04, 2012)
http://www.bizresearchpapers.com/35.olowe
Onwukwe, C. E., Bassey, B.E.E & Isaac, I. O. (2011). On Modeling the Volatility of Nigerian Stock Returns
Using GARCH Models. Journal of Mathematics Research,, Vol. 3(4), 31-43.
31
http://dx.doi.org/10.5539/jmr.v3n4p31
539/jmr.v3n4p31
Oskooe, S. A. P. and Shamsavari, A. (2011). Asymmetric Volatility in Emerging Stock Markets: A Case of Iran.
International Journal of Economics and Finance Vol. 3 (6): 15-24. http://dx.doi.org/10.5539/ijef.v3n6p16
Finance, 24.
Rachev, S. T., Mittnik, S., Fabozzi, F. J., Focardi, S. M. and Jasic, T. (2007). Financial Econometrics: from
Basics to Advanced Modeling Techniques New Jersey: John Wiley & sons Inc
Techniques,
Saleem, K. (2007). Modelling Time Varying Volatility and Asymmetry of Karachi Stock Exchange. [O [Online]
Available: http://ssrn.com/abstract=964898 (May 17, 2012)
Surya, B.G.C. (2008). Volatility Analysis of Nepalese Stock Market. The Journal of Nepalese Business Studies
Studies,
V (1), 76-85. http://ssrn.com/abstract=1565603 (April 06, 2012)
Zakoian, J.M. (1994). Threshold Heteroscedastic Models. Journal of Economic Dynamics and Control 18, Control,
931–955.
57
7. European Journal of Business and Management www.iiste.org
ISSN 2222-1905 (Paper) ISSN 2222-2839 (Online)
2839
Vol 4, No.12, 2012
Appendices
Table 1: Descriptive Statistics of the NSE Daily Retu
Returns Series
Skewness 0.170607 Kurtosis 6.966491 Bera
Jarque-Bera 7964.1525
(0.000013) (0.000000) (0.000000)
Mean 0.000357 Variance 0.000082 Std Dev 0.0090
Minimum -0.067254 Maximum 0.097660 Observations 3929
Note: Marginal Significance Levels displayed as (.). Skewness and Kurtosis are tests for zero skewness and
(.).
excess kurtosis. Jarque-Bera is for normality.
Bera
Figure 1: Logarithmic Daily Returns of the NSE
02/01/1996 - 30/12/2011
0.100
0.075
0.050
0.025
0.000
-0.025
-0.050
-0.075
250 500 750 1000 1250 1500 1750 2000 2250 2500 2750 3000 3250 3500 3750
Figure 2: Logarithmic Level Series of the NSE Index
02/01/1996 - 30/12/2011
11.5
11.0
10.5
10.0
9.5
9.0
8.5
8.0
250 500 750 1000 1250 1500 1750 2000 2250 2500 2750 3000 3250 3500 3750
58
8. European Journal of Business and Management www.iiste.org
ISSN 2222-1905 (Paper) ISSN 2222-2839 (Online)
2839
Vol 4, No.12, 2012
Table 2: Stationary Test for Log Level and First Difference of the NSE Daily Index
Critical Value Critical Value Critical Value Computed Value Unit Root
at 10% at 5% at 1% Test
Log Level -2.567 -2.863 -3.435 -1.41589 ADF Test
Stock Return -2.567 -2.863 -3.435 -31.24962
Table 3: Estimates of the Parametric Volatility Models
Parameters GARCH EGARCH GJR-GARCH
GJR
Mean 1.29640e-04
1.29640e 0.000087 0.00013
(0.0789) (0.00000) (0.02306)
{1.7568} {12.6106} {2.2723}
Constant (α0 ) 4.05488e-07
4.05488e -0.83050 0.0000003
(0.00003) (0.0000) (0.00348)
{4.1329} {-2485.42} {3.1355}
ARCH (α1) 0.3116 0.52986 0.37650
(0.0000) (0.0000) (0.0000)
{14.8822} {21.6016} {10.6887}
GARCH (β1) 0.7545 0.95610 0.73944
(0.0000) (0.0000) (0.0000)
{57.6493} {568.1571} {42.6176}
Asymmetry (γ) ________ 0.037447 -0.07250
0.07250
(0.00635) (0.01941)
{2.7286} {-2.3374}
2.3374}
(α1 + β1) 1.0661 1.4859
(α1 + β1+ γ/2) 1.0796
Shape (c) ________ 1.66294 1.71178
(0.0000) (0.0000)
{29.8044} {30.0857}
{30.085
Log Likelihood 14096.48 14294.22 14276.38
Notes: Marginal significance level displayed as (.) and t
t-statistics displayed as {.}.
59
9. This academic article was published by The International Institute for Science,
Technology and Education (IISTE). The IISTE is a pioneer in the Open Access
Publishing service based in the U.S. and Europe. The aim of the institute is
Accelerating Global Knowledge Sharing.
More information about the publisher can be found in the IISTE’s homepage:
http://www.iiste.org
The IISTE is currently hosting more than 30 peer-reviewed academic journals and
collaborating with academic institutions around the world. Prospective authors of
IISTE journals can find the submission instruction on the following page:
http://www.iiste.org/Journals/
The IISTE editorial team promises to the review and publish all the qualified
submissions in a fast manner. All the journals articles are available online to the
readers all over the world without financial, legal, or technical barriers other than
those inseparable from gaining access to the internet itself. Printed version of the
journals is also available upon request of readers and authors.
IISTE Knowledge Sharing Partners
EBSCO, Index Copernicus, Ulrich's Periodicals Directory, JournalTOCS, PKP Open
Archives Harvester, Bielefeld Academic Search Engine, Elektronische
Zeitschriftenbibliothek EZB, Open J-Gate, OCLC WorldCat, Universe Digtial
Library , NewJour, Google Scholar