SlideShare une entreprise Scribd logo
1  sur  12
Télécharger pour lire hors ligne
European Journal of Business and Management                                                                          www.iiste.org
ISSN 2222-1905 (Paper) ISSN 2222-2839 (Online)
Vol 4, No.11, 2012


  Relationship between Financial Leverage and Financial Performance:
            Evidence from Fuel & Energy Sector of Pakistan
                                                       Shehla Akhtar.
                                            Mohammad Ali Jinnah University, Islamabad
                                                  shehlaakhter@gmail.com

                                                         Benish Javed
                                            Mohammad Ali Jinnah University, Islamabad
                                                  benishsasha@yahoo.com

                                                        Atiya Maryam
                                            Mohammad Ali Jinnah University, Islamabad
                                                    attiamar@gmail.com

                                                        Haleema Sadia
                                            Mohammad Ali Jinnah University, Islamabad
                                                  sadia.haleema@gmail.com

ABSTRACT
Fuel and energy sector serves as the backbone of the economy. The segment provides support, not only for the economic
development of the country by showing positive trends towards the sectoral growth, but also serves as a steering wheel for
the growth of manufacturing, trading and service sector. It provides significant inputs for production, trade and service. A
general concept prevails that the financial leverage is helpful to enhance the financial performance of the companies. For
measuring the impact of financial leverage on the financial health of the companies, it is essential to know whether a
positive relationship exists between the financial leverage and financial performance or not? So, this study is intended to test
the hypothesis and to measure a relationship between the financial leverage and the financial performance of the fuel and
energy sector in Pakistan. The paper also examines the generalization that firms with higher profitability may choose high
leverage by using various statistical tools. The findings of the study show a positive relationship between the financial
leverage and the financial performance of the companies by accepting the alternate hypothesis H1 and Ho is rejected. The
results of the study confirm that the firms having higher profitability may improve their financial performance by having
high levels of financial leverage. The study provides evidence by evaluating different facts. It reveals that the players of the
fuel and energy in Pakistan can improve at their financial performance by employing the financial leverage and can arrive at
a sustainable future growth by making vital decisions about the choice of their optimal capital structure.

Key Words:          Financial leverage, Firms’ Performance, Key Indicators- Financial Ratios, Fuel and Energy Sector in
                    Pakistan

 1. INTRODUCTION
There is a general perception that a relationship exists between the financial leverage and the performance of the companies.
In this study, we test the hypothesis. Employing a sample of 20 listed public limited companies from Fuel and Energy sector
listed at Karachi Stock Exchange (KSE). The study aimed at measuring the relationship between financial leverage and the
financial performance. To test the hypothesis, the main variables used in the study consist of a dependent variable which is
financial performance of fuel and energy sector while an independent variable financial leverage in fuel and energy sector.
Basically, the study aims at measuring the relationship between the two stated variables. The key financial performance
indicators used in the study are return on assets ( % ), return on equity ( % ), dividend cover ratio ( % ), dividend ratio to
equity ( % ), net profit margin ( % ), earning per share before tax, earning per share after tax ( % ), sales as % of total assets
( % ), earning per share before tax growth( % ), sales growth ( % ). Financial leverage of the industry will engage the key
leverage indicators commonly used including the gearing ratio ( % ), debt equity ratio ( % ) and debt equity ratio. The
results will assess the real scenario about the relationship of financial leverage with financial performance of the industry.

 2. BACKGROUND
Energy serves as a steering wheel for the economy of a country to step towards sustainable economic growth. According to
Statistics and Analysis of Energy Data, in December 2006, Electricity, Oil, Gas, and Coal conducted by EIA (Energy
information administration), Pakistan has shown a nominal expansion in its energy sector, in spite of the major disaster of


                                                                7
European Journal of Business and Management                                                                         www.iiste.org
ISSN 2222-1905 (Paper) ISSN 2222-2839 (Online)
Vol 4, No.11, 2012

earthquake happen in 2005. Pakistan's economy has improved from years of slow growth, due to droughts and other natural
disasters in various sectors of economy.

In fiscal year 2004-05, the gross domestic product of Pakistan has shown a growth rate of 8.4% while in year 2005-06, the
GDP growth rate of 6.6 % was achieved. In year 2004-05 high growth in inflation 9.1% resulted in increase in prices of oil,
house rents and shortage in basic food item. In order to implement control measures for reducing inflation, the State Bank of
Pakistan declared the interest rates would rise. As a result of such strategy, the inflation rate decline to 7.6% by the end of
the year 2005-06.

 The two major donors to Pakistan The World Bank and International Monetary Fund (IMF) have recognized the positive
growth and progress in performance in the country’s restructuring, but they pointed out the slow growth sectors i.e, energy
sector and public institutions. In current period, two major reasons for increased imports of oil from Middle East are the
increased consumption and flat production in the country. Pakistan is relying on oil and petroleum products import due to
lack of refining capacity. 50% of total energy utilization in Pakistan is covered by the natural gas reserves. All domestic
natural gas production is currently consumed by the country but higher production is required by Pakistan to be an importer
of natural gas. In this regard, Pakistan is making efforts to explore various LNG and pipeline import options in order to meet
the expected demand growth. The demand for electricity in country is rapidly increasing. In order to meet expected demand
in 2010, 50% growth in capacity is required as per government estimates.

 Economic survey of Pakistan year 2006-07 provides that the economy of the country is demonstrating 7.6% growth per
annum for the period of previous three years, as in this regard government is trying to maintain it for future growth. The
government realizes a quite strong relationship between economic growth of energy and its demand and making efforts in
this regard. Government is taking new project in action like, setting up of new nuclear power plant, overhauling existing
power generation plants to enhance their generation capacity, utilizing 175 billion tones of Thar coal reserves, import of
LNG; increase in oil and gas exploration in the country; import of piped natural gas from Iran and Turkmenistan’s;
exploiting the affordable alternate energy resources. By promoting efficient use of energy resources the supply can be
increase. Production of crude oil per day showed up an increase of 1.7% from to 65,385 barrels per day to 66,485 barrels
during the month of July-March 2006-07. The production of crude oil has showed a raise of 18.2 million barrels in the
months of July-March 2006-07 from 17.9 million barrels in contrast of July –March last year, which indicates a raise of
1.7%.

Pakistan’s CNG fleet is number 1 in Asia and the Number 3rdin the world’s. The government has already invested Rs 60
billion in this sector and trying to start different projects as well. The incredible expansion in this sector has created 60,000
new jobs. With the collaborative effort of Federal Government and Cabinet Division, collectively trying to provide
motivation to the people by giving relief in interest payment of the loans, which is essential to acquire new CNG
vehicles. For this purpose, the cities of Hyderabad, Quetta, Peshawar, Islamabad, Rawalpindi, Lahore and Karachi, are
cutting out diesel vehicles to replace it by CNG vehicles for intra-city hauling. The whole range of wagons, mini buses and
new buses, will be converted on CNG – or dual fuel transportation. Provincial governments in country are also taking steps
to sponsor CNG conversions. In this regard government of Punjab announced 20% capital cost for every new CNG vehicle
(Energy-Overview of the Economy, Economic Survey of Pakistan fiscal year 2006-07).

The country Government states the policy objectives for the energy sector in “Petroleum Exploration & Production Policy
2007" published by Ministry of Petroleum & Natural Resources; the objectives include the promotion of Foreign Direct
investment in country through increased healthy competition for investments in the energy sector, promotion of local oil
and gas companies of Pakistan for stated sector investment opportunities, training of country officials in Energy and
Petroleum sector to according to international standards and creating an environment of retaining in the region. Further
more they aim at promotion of enhanced Energy and Petroleum activity in the front line areas by offering incentive
competitive environment.

The Government of Pakistan is also working on project to build a pipeline from Iran’s natural gas reserves to Indian
marketplace across the country’s region (Statistics and Analysis of Energy Data, Electricity, Oil, Gas, Coal conducted by
EIA (Energy information administration), 2006) .In august 2006, Pakistan resigned a memorandum of understanding 2005
until 2007 with Iran. Price to be paid for Gas is the major concern for both countries India and Pakistan. The three countries
selected an international consultant to act as a mediator for the solution of pricing issue. Pakistani administrators focused on
their ability to maintain the pipeline while Iran took the responsibility to cover 60 % of the construction cost .The annual
expected earning from this pipeline is for Pakistan could be $70 million in transit fees. If India chooses to quit its share in
the pipeline project, Iran and Pakistan have agreed to work on a bilateral pipeline project. Dolphin Project in Qatar is a

                                                               8
European Journal of Business and Management                                                                         www.iiste.org
ISSN 2222-1905 (Paper) ISSN 2222-2839 (Online)
Vol 4, No.11, 2012

second import possibility under consideration. Sub sea pipeline from Oman will help out supply of natural gas to Pakistan.
A pipe line from Turkmenistan to Pakistan through Afghanistan is another alternative for Pakistan. The Price charged by
Turkmenistan and the security situation of Afghanistan are major constraint in this regard.


                                Source: Ministry of Petroleum and Natural Resources in Pakistan

                                     Figure 1: Proposed regional Gas Pipeline routes

In short, we can say that the fuel and energy sector is making a significant contribution towards the economic growth of the
country along with current developments, pursued by further prospects for future development.

 3. SIGNIFICANCE & STUDY RATIONAL
Energy serves as a steering wheel for the economy of a country to step towards sustainable economic growth. Energy is
used as an input for various industries, and is also used as a commodity to be used in commerce and trade activities. Energy
is the most vital resource for the industrial growth as it functions like a backbone on which the whole industrial body is
dependent. To prosper, a country needs to embrace the growth in energy sector. More or less each and every production unit
working in the economy is using the energy as a raw material to base its production by using such resource. Particularly for
the manufacturing sector its significance is same as the Importance of blood in veins. The study conducted for observing the
impact of financial leverage on the financial performance of the companies will help out the companies to know about the
effect and increase the profitability by considering the option of leverage, if it proves to make a significant positive impact
on financial performance.

The fuel and energy sector is the major consideration of the study as this sector is growing rapidly and serves as the primary
concern to provide the input to the other industries. The change in oil & gas prices creates a jerk to the other industries if it
is raised because it may raise the proportionate costs of production in various industries and even a common consumer may
suffer a lot as the results of inflation and reduced purchasing power. Not only the manufacturing sector suffers but various
financial sector industries also have deep concerns as their revenues may also squeeze due to increased inflation, lower
purchasing powers etc. and also other economic effects. There is a general hypothesis that leverage increases the risk of the
firm which in turn increases the proportionate returns leading to the ultimate wealth maximization of the shareholders,
which is to be tested in the study. If leverage brings returns and ultimately the maximization of value to the company, the
long term sustainable growth in fuel and energy sector is possible. If the fuel and energy sector is growing, new
developments will be observed, it will lead towards the overall country’s industrial growth as many other industrial players
are dependent on fuel and energy for production. So, the study carries a great significance not only for the fuel and energy
sector but also for the dependent bodies. It makes a considerable meaning even if we say the trade activity revolves around
the fuel and energy sector in the whole world.

 4. DIRECTION FOR FUTURE RESEARCH
The research will provide a direction for further research on fuel and energy sector in Pakistan regarding the impact of
financial leverage on the performance of companies operating, measuring a cause and effect relationship. It may lead to the

                                                               9
European Journal of Business and Management                                                                           www.iiste.org
ISSN 2222-1905 (Paper) ISSN 2222-2839 (Online)
Vol 4, No.11, 2012

future researches to be carried out by analyzing the individual company’s performance and making a comparison with the
whole industry by using the industry performance as bench marks. After measuring the relationship between the leverage
and the financial performance, a further study to measure the significance of financial leverage for the sector under
discussion can be carried out and what impact would it make on the financial performance if the financial leverage of the
companies is increased or reduced and how can the industry players maximize their shareholders’ wealth by using leverage.
How the firm’s stock value is influenced by using the different levels of leverage and how companies lying in such sector or
the industry players can achieve the sustainable growth by implying the leverage concept. What impact the leverage can
make on the sectoral risks and the company specific risks and how to measure, evaluate, and control the systematic and
asystematic risks involved for levered companies in such industry. What impact would the increased risks by leverage can
make over the required rate of return of the companies? These are some questions which may be answered in several studies
for the fuel and energy sector in Pakistan to lead towards the sustainable future growth.

 5. HYPOTHESIS- H1:
Financial leverage has got a positive relationship with financial performance of the companies operating in fuel and energy
sector.

 6. LITERATURE REVIEW
The Stock leverage can be defined as the ratio of total liabilities to total assets. It can be seen as alternative for the residual
claim of equity holders. However, the stock leverage may not be a healthy indicator in terms of identifying the firms default
risk in near future (Rajan; Zingales, 1995). The earnings are independently and identically distributed, so the leverage
remains same in each period (Scott, 1976). The multi period earnings and leverage relationship is examined by Barnea,
Haugen, and Talmo, (1987). In their point of view adequate earnings cause brings losses for tax benefits as Raymar (1991)
find that the leverage increases with the ratio of operating earnings to value. According to Barnea, Haugen, and Talmo,
(1987), the leverage to risk relationship is dependent upon the economy-wide pricing variables while Raymar (1991) comes
across the result that optimal leverage generally decreases with business risk. The diminished future debt usage implies
smaller terminal firm value (Haugen; Senbet, 1998). They further elaborate that the default acts as the deterrent to leverage
in their model, and default occurs primarily due to a depressed value of the firm, Sensitivity of firm’s earnings is paramount
in the determination of the debt optimum. Thus, stable (low Sensitivity of firm’s earnings) firms with high earnings risk
may be highly levered. If earnings processes are heterogeneous (either as reflected by sensitivity of firm’s earnings or in a
more general sense), simple earnings variability measures would not adequately capture the relation between a firm's
business risk and its use of debt.

The free cash flow indicators identified in literature are observed as low levels of financial leverage, inadequate valuable
investment opportunities; considerable and sustainable cash flows; and high level of diversification (Jensen, 1986).

While in view of Gibbs (1993) no relationship exists with investment opportunity and initial financial leverage.
Management has incentives to minimize the liquidation risks of the companies. Moreover, the management may opt to
avoid the corrective action of the capital market by financing unprofitable projects internally with retained earnings. This,
too, has the effect of reducing leverage. Thus, we can infer that such action of management may reduce the risk of the firm
by reducing leverage and so the returns as result. The author further explains that with decreasing board power, the
management may tend to be stable and in a position to resist takeover. Decreasing values of leverage and investment
opportunity are expected to increase likelihood of capital structure reforms due to takeover threat. The ultimate findings of
the author reveal that the. Degree of operating leverage (Mandelker, G.N., and S.G. Rhee,1984) also determines the capital
structure mix, as firm then exposed to industry influence at some scale and those having higher degree of operating leverage
may have less debt percentage and vice versa. In an empirical study (Hatfield, Cheng, Davidson, 1994) of high debt and
low debt firms belonging from the same industry, the results shown that in opposition of the perception of market decision
of granting finances by comparing firm’s leverage ratio with the industry average has been proved to reverse case.

Ferri; Jones (1979) has observed the relationship between leverage and size of the firm as it is a general perception that the
likelihood of larger firms to be diversified is more, as they can access to the capital markets easily, may benefit from
the higher credit ratings for issue of debt, and lower interest rates on external financing. It reveals’ that leverage may
enhance the profit after taxes due to lower interest rates and ultimately the higher earnings may result in the higher EPS or
dividend payout ratios which may increase the firm’s performance. Even if the marginal earnings as the result of lower
interest rates and tax shields are retained for the company’s growth, it may maximize the company’s value in long term and
may lead towards the achievement of wealth maximization objective for which the real owners invest. So, the author found
the relationship between the size of the firm and leverage class. More over, the paper investigated possible linkages
between a firm's financial structure and its industry class, variability in income, and operating leverage. The results of the

                                                                10
European Journal of Business and Management                                                                          www.iiste.org
ISSN 2222-1905 (Paper) ISSN 2222-2839 (Online)
Vol 4, No.11, 2012

study's effort to relate firm characteristics to leverage class can be summarized in this way: a) industry class is linked to a
firm's leverage, but in a less pronounced and direct manner than has been previously suggested; b) variation in income,
measured in several ways, could not be shown to be associated with a firm's leverage. Modigliani and Miller (1958 and
1963) support this verdict, that financial leverage and firm value have insignificant relationship while it exists only when
those operate in taxable environment call for tax payments affecting capital structure.

 J. Fred Weston (1989) comments on MM’s propositions which state that Equilibrium in a perfect capital market
requires that the market value of a firm not be changed by its financing decisions and the required return on equity will
raise (linearly) with financial leverage. There is an inverse relationship among profitability change and leverage change
in short run provided with the fixed dividends and investments where the dominant mode of external financing is debt.
It has been observed that large firms are inclined to issue less equity. With the increase in firm size, the negative effect
of profitability on leverage should be stronger but if the smaller firms are provide with investment opportunities, it may
diminish correlation of profitability & leverage by larger equity issuance.(Rajan; Zingales, 1995).

The authors persist to elucidate about coverage ratio that a measure of the risk that share holders will not be able to
make predetermined payments and will have to surrender control i.e., the to interest expense & the ratio of earnings
before interest, taxes, and depreciation (EBITDA) ratio of earnings before interest and taxes (EBIT)to interest expense.
A basic issue for both measures is that they assume the rolling over of short-term liabilities including short term debt
and accounts payable, which may not necessarily be true during financial distress. More over Jensen (1989) argue that
the implication arising from inability to make fixed payments at high levels of debt may be different from those in low
debt levels. The case of first scenario explained above is more likely to lead to liquidation while the second may lead to
restructuring. Takeover pressures may force the firm to enhance leverage and the managers may increase their debts to
ensure the payment of future cash flows as a result of restructuring. This, in turn, may make the firm unattractive to
raiders (Zwiebel,1992).

The studies indicate that if the risk of the firm is increasing by leverage, it may lead the firm towards liquidation or
takeovers. We can generate a proposition out of this that the firm may need sufficient profitability to service the debts.
Bernanke Campbell, and Whited (1990) observed the restructuring activity in the 1980s also had substantial impact on
the cross-sectional distribution of leverage. A general perception is that Increased leverage and increased risk of the
firm may increase the probability of default and so the bankruptcy costs or the costs of financial distress. Rajan;
Zingales (1995) observed that the cost of financial distress are higher in the firm having high market-to-book ratios
that’s why a negative correlation is expected. There may be other potential reasons for why the market-to-book ratio is
negatively correlated with leverage. Fama and French (1992) recommended that there is a price of distressed risk as a
high discount rate may be used for the contribution of firms with high leverag in financial distress. Mostly the firms
with low market to book ratios demonstrate a negative correlation if preceding explanation is true. In fact the firms with
high market to book ratio illustrate negative correlation rather than the firms with low market-to-book ratios. It is not
always a chance that the scenarios mention above are caused by financial distress Rajan; Zingales (1995)

Managers may opt for less leverage in order to decrease the level of firm risk to shield their under diversified human
resource (Fama, 1980) or their unwillingness to embrace performance pressures related to obligation to expel huge
amount of cash ( Jensen, 1986). On the other hand, Harris and Raviv (1988) and Stulz (1988) recommend that
entrenchment motives may compel managers to increase leverage beyond the optimal point because they want to
increase voting power of their stakes in equity and diminish the possible takeover attempts. Ii means the entrenchment
motives lead to higher performance. The encouragement for limited liability stockholders to raise the risk of the firm by
increasing leverage has been extensively noted (Galai and Masulis, 1976).

Harris and Raviv (1991) provided that there are corresponding leverage ratios commonly accepted by the firm in a
given industry whereas leverage ratios vary across industries. When the firms increase there leverage, shareholders’ bid
for common shares with low market value and less dividend than the value at liquidation and fixed dividend offered
on preferred stock. Thus, the net effect on the firm is to increase its fixed obligations. In our opinion, it may lead to the
greater creditors’ influence and the representation in the board of directors of the company which may lead the
management to take risky projects for the company to maximize the returns as returns are the function of proportionate
risks. Moreover, as the common shareholder have a vote per share, so the voting rights of equity holders may decline
who intent to participate in the offer (Pinegar; Lease, 1986). Furthermore the author examines that leverage change may
not require to change the tax status before event that may influence the change in firm value. Specifically,
announcements of preferred-for-common exchange offers lead to positive firm revaluations in almost all of the


                                                               11
European Journal of Business and Management                                                                        www.iiste.org
ISSN 2222-1905 (Paper) ISSN 2222-2839 (Online)
Vol 4, No.11, 2012

leverage-increasing events. When there are preference to common share exchange offers, a negative change may occur
in firm value as revealed by signaling hypothesis.

According to Masulis' (1983) and DeAngelo and Masulis' (1980) assumption that a firm may question and optimal
level of debt that it could have may increase or diminish its value and may move push away or towards industry
average. Firms efforts to work out Optimal capital structure (DeAngelo and Masulis, 1980) is determined by various
agency costs bankruptcy or tax gain on losses from leverage usage ,compensating for other tax shield instruments of
depletion ,depreciation, ,amortization and investments tax credits. According to Robert L. Hirsch, SAIC, (2005); the
management of an oil reservoir over its multi-decade life is influenced by: 1) an operator’s other investment
opportunities 2) history of production, status of the reservoir and geology 3) nature and cost of production-enhancing
technologies; 4) enhancements timing ; 5) the financial condition of the operator; 6) actual and expected future oil
prices 7) political and environmental circumstances, etc. Risk as an important imperative of firms operating in an
industry, consistent earnings depending on the total cost affected by (Samuel H. Baker) output variability and
determines financial leverage decision. Output varies due to nature of firm operating environment.

Another research conducted by Hamada (1972), found the relationship of equity cost and leverage of firms across
industries. More variations were observed for the firms using leverage than that preferring unlevered capital structure.
A study by Hall and Leonard Weiss (1967) explained the presence of significant relationship of greater equity/debt
ratio with profitability, but also an influence of reducing risk, resulting in an increased profitability is observed.
According to Louis, Cheng and Davidson (1994), the market response to the debt announcements may be affected by
the growth of firm. The firm with high growth rate may absorb the increased financial leverage as it may have ability
to pay the incremental interest expense and visa versa.

 7. RESEARCH METHODOLOGY
The research to be conducted is a quantitative research involving an empirical study among different variables. The
sample size consists of 20 listed public limited companies from Fuel and Energy sector listed at Karachi Stock
Exchange (KSE). All companies except 20 listed public limited companies from Fuel and Energy sector listed at
Karachi Stock Exchange are excluded form the study. The core data for the research will be collected by using the
relevant annual reports of the companies and it would help in gaining authentic results. Balance sheet analysis of public
limited companies registered on the KSE (2000-2005), statistics provided by State bank of Pakistan and data issued by
DWH department will serve as guideline in measuring the financial performance of the companies by implying ration
analysis as financial performance indicators. For the collection of supportive data several websites, Research Journals
& articles will provide a significant guideline for studying the literature and previous studies being carried out on the
relevant topics. Instruments of data entry & analysis being used imply descriptive statistics, formulas, and charts
engage Microsoft Excel, software for data analysis.

There is a general belief that the financial leverage affects the performance of the companies. This study will measure
the relationship between financial leverage and the financial performance. To test the hypothesis, the main variables
used in the study consist of a dependent variable which is financial performance of fuel and energy sector while an
independent variable financial leverage in fuel and energy sector. Basically, the study aims at measuring the
relationship between the two stated variables. The financial performance will be measured by employing the ten key
indicators commonly used return on assets ( % ), return on equity ( % ), dividend cover ratio ( % ), dividend ratio to
equity ( % ), net profit margin ( % ), earning per share before tax, earning per share after tax ( % ), sales as % of total
assets ( % ), earning per share before tax growth( % ), sales growth ( % ). On the other hand the independent variable,
financial leverage will engage the key leverage indicators commonly used including the gearing ratio ( % ), debt equity
ratio ( % ) and debt equity ratio. The results will evaluate whether a positive relationship exists between the financial
leverage and financial performance or not?

 8. DATA ANALYSIS AND DISCUSSION
The data analysis shows the statistical results regarding financial leverage and the financial performance. Most
commonly used measure of financial leverage is calculation financial ratios, of which capital gearing ratio and debt to
equity ratio are being analyzed. Gearing ratio[i] demonstrates the level of financing provided by internal financer’s
fund (owner's) to external financer funds. The highly geared companies with high leverage ratio are more flexible to
respond in unfavorable circumstances as they are exposed to risk of fixed payment even in downturns. High levels of
equity provides a margin and can be viewed as a determined of financial strength. According to our data
summarization maximum gearing ratio is 87.13% in Pakistan’s Energy sector and minimum is 0%. Firms are using


                                                              12
European Journal of Business and Management                                                                      www.iiste.org
ISSN 2222-1905 (Paper) ISSN 2222-2839 (Online)
Vol 4, No.11, 2012

leverage with the combination of equity. Average of is 22.10% and it’s variance from mean average is 619 points
approximately, while standard deviation of 25% almost as shown in Table 1.

                               Table 1: Statistical Analysis of Various Leverage Indicators

              Financial leverage
                                                                                                         Standard
                    Among              Maximum               Minimum          Average        Variance
                                                                                                         Deviation
                  Companies
         gearing ratio ( % )                   87.133         0            22.10416683    619.3020724    24.88578053
         Debt equity ratio ( % )             1392.267    0.413333333       210.59985      128981.0135    359.1392675
         Debt equity ratio                     13.923    0.012305          2.453972583    11.87838562    3.44650339

Debt to equity ratio measures the company's financial leverage calculated by dividing its total
liabilities by stockholders' equity. It indicates what proportion of equity and debt the company is using to finance its
assets. Energy sector’s maximum debt/equity ratio is 13.92%, with a minimum of 0.012% and sector average is 2.45%;
showing 11 .87% variations from mean and a standard deviation of 3.446%.

     Table 2: Statistical Analysis of Various Performance Indicators

          Financial Performance of                                                                         Standard
                Companies                        Maximum      Minimum          Average       Variance      Deviation
        Return on assets ( % )                       37.3    -4.03333333    9.908333333    106.7877632   10.33381649
        Return on Equity ( % )                      83.55    -27.3666667    22.39083333    637.6461835   25.25165704
        Dividend cover ratio ( % )           658.166667                0       171.5425     22256.5739    149.186373
        Dividend ratio to equity ( % )                  27             0         9.7275    56.74994956   7.533256239
        Net profit margin ( % )                     58.25    -82.4666667          14.02    727.3790175    26.9699651
        Earning per share before tax         61.5333333      -1.23333333          25.69    325.7340234   18.04810304
        Earning per share after tax(%)               235     -18.7666667         20.105    2745.001904   52.39276576
        Sales as % of total assets( % )             626.4    10.2833333     163.2091667    34065.34522   184.5679962
        Earning per share before tax
        growth ( % )                                120.5    -320.416667    -12.8166667    10148.31687   100.7388548
        Sales growth ( % )                         204.75    -4.68333333         27.825    2022.703202   44.97447278

Table 2 shows the findings about financial performance indicators. Return on assets’[ii] maximum and minimum ratios
of the industry is 37.3% and -4.03%, while industry average is 9.9.Variance of 10.33 explains the variability of earning
on assets investment by using industry proposed financial leverage structure. ROE[iii] of this sector is quite high of
83.55% as maximum, while average of 2.3%, variability is 25.25% much greater when earning on equity trades off for
financing decision of by using leverage or equity financing. Dividend ratio to equity Industry average is 9.7, while
highest is 27%, standard deviation is 7.5 which is comparatively lesser than other performance indicators .It shows the
firms sensitivity for keeping shareholders satisfied, earning good industry perception. Net profit margin[iv] analysis
indicates 14.02% margin for energy sector companies showing the maximum returns of 58.25% after tax and a
minimum of -82.5%. The EPS[v] before taxes for the industry reaches to the peak at 61.5% while represents a
minimum of -1.2%. Earning per share before tax and after tax shows the average of approximately 25% and 20%
respectively. Maximum EPS before taxes growth is -320.4% that reaches up to 120.5% maximum in the industry with a
mean EPS growth of -12.58%. Sales as % of total assets show the average of 163% approximately while sales
growth[vi] is 27% average for the industry with a minimum of -4.6% and touching a height at
204.75%.


                                                                13
European Journal of Business and Management                                                                         www.iiste.org
ISSN 2222-1905 (Paper) ISSN 2222-2839 (Online)
Vol 4, No.11, 2012

                    Table 3: Correlations of various Financial Performance Indicators with Leverage Ratios
                                                                                                                   Debt
                                                             Gearing                                              equity
                    Financial indicators                    Ratio ( % )   Debt equity ratio ( % )                  ratio
     Return on assets ( % )                             -0.524531583            -0.093848976                -0.109757491
     Return on Equity ( % )                             -0.489766751             0.240329538                 0.221742643
     Dividend cover ratio ( % )                         -0.269137937             0.497179868                 0.477460399
     Dividend ratio to equity ( % )                     -0.402391189             -0.02726646                -0.033036793
     Net profit margin ( % )                            -0.216375712            -0.233401722                 0.174713067
     Earning per share before tax                       -0.455429789              0.23057712                 0.18052581
     Earning per share before tax                       -0.455429789              0.23057712                 0.18052581
     Earning per share after tax ( % )                  -0.351619287            -0.054309775                 0.101362849
     Sales as % of total assets ( % )                   -0.411185047             0.251475029                 0.193272234
     Earning per share before tax growth ( % )          -0.179575772              0.26298237                 0.259195851
     Sales growth ( % )                                  0.218433803             0.177118528                 0.137645603

Table 3 depicts the relationship among various leverage indicators and the financial performance indicators. Most of
the correlations between leverage and financial performance show a positive relationship among leverage and the
financial performance of the companies when we compare the debt to equity ratio with most of the financial
performance indicators. On the other hand, the gearing ratio shows most of the relationships negative with the leverage
indicators shown in figure 5. The justification in this regard is the possibility of having preferred stock in the capital
structure of some companies lying in the industry which is being the part of capital with fixed return. The gearing ratio
takes into account the effect of capital with return numerator which not only accommodates the debt but also the
outstanding shares of preferred stock. When the ratio is calculated by dividing the capital with fixed return to the capital
with variable return (which includes equity), the gearing ratio results may differ from that of debt to equity ratio. The
debt equity ratio takes into account the long term debt.


                  Figure 2: Relationship of various performance indicators with gearing ratio (%)


                                                              14
European Journal of Business and Management                                                                      www.iiste.org
ISSN 2222-1905 (Paper) ISSN 2222-2839 (Online)
Vol 4, No.11, 2012

Most of the financial performance indicators except ROA and Dividend cover ratio show the positive relationship with
the leverage indicators. The best possible reasoning that may support the fact is that the dividends cover ratio is not
directly related to the leverage. But it is only showing the adequacy of profit available for the payments to be made on
the account of dividends. The other ratio (ROA) results showing a negative correlation with leverage indicators
measures the profitability over the total assets financed by total capital employed which not only takes into account the
effects of debt but also the equity. The later variable in the capital employed may cause the ROA ratio to be
deteriorated in case of some companies which ultimately transforms the industry averages.


                Figure 3: Relationship of various performance indicators with debt equity ratio


The overall trend and relationship of financial performance indicators along with the leverage is still measuring a
positive relationship shown in Figure 5. It proves the H1 hypothesis of the study which says that a positive relationship
prevails between the leverage and financial performance and rejects the H0 hypothesis of the research. Hence, the
companies lying in the fuel and energy sector in Pakistan can improve at their financial performance by opting for the
optimal level of leverage for them.

 9. CONCLUSION
We can conclude the findings of the study by saying that the financial leverage has got a positive relationship with
financial performance and the alternate hypothesis id accepted. The null hypothesis is rejected by the results of the
study. Hence, the companies in the fuel and energy sector may enhance their financial performance and can play their
role for the growth of the economy while improving at their optimal capital structures. Leverage may translate into
profitability and value maximization of the firms in fuel and energy sector in Pakistan in long term. The fuel and
energy sector industry can play an important function in the uplift of the economy by reviewing its capital structure
priorities. The employment of debt in the capital structure of the companies may make a positive impact on the
performance. In order to maximize the return on investment leverage may be used as “the variable” while making
considerations to improve at financial health of the companies by raising their financial performance.


REFERENCES

     Balance sheet analysis of Joint stock companies Listed on the Karachi stock exchange 2000-2005.State bank of
     Pakistan Statistics and DWH department, State Bank of Pakistan.


                                                             15
European Journal of Business and Management                                                                     www.iiste.org
ISSN 2222-1905 (Paper) ISSN 2222-2839 (Online)
Vol 4, No.11, 2012

     Baker S.1973. Risk, Leverage and Profitability: An Industry Analysis. The Review of Economics and Statistics,
     55(4), pp. 503-507.
     Barnea, A, R. Haugen; and E. Talmor. 1987. Debt and Taxes: A Multiperiod Investigation. Journal of Banking and
     Finance, 11, pp.79-97.
      Bernanke, Benjamin, John Campbell, and Toni Whited, 1990, U.S. corporate leverage: developments in 1987 and
     1988. Brookings Papers on Economic Activity 1 ,pp. 255-278.
     “Country Analysis Brief”, Pakistan Energy Data, Statistics and Analysis - Oil, Gas, Electricity, Coal, EIA, Energy
     information administration, official energy statistics from U.S. Government, December 2006
     DeAngelo, H., and R.W. Masulis.1980. Optimal Capital Structure under Corporate and Personal Taxation Journal
     of Financial Economics, (8), pp. 3-29.
     Fama, Eugene F.1980. Agency problems and the theory of the firm. Journal ofPolitica1 Economy 88, pp. 288-307.
     Fama, Eugene, and Kenneth French. 1992. The cross-section of expected returns. Journal of Finance, 46, pp. 427-
     466.
     Ferri, M.; Jones, W. 1979 Determinants of Financial Structure: A New Methodological Approach”. The Journal of
     Finance, 34(3), pp. 631-644.
     Galai, D. and R. Masulis, 1976. The option pricing model and the risk factor of stock, Journal of Financial
     Economics,3, pp. 53-81.
     Gibbs, P. 1993. Determinants of Corporate Restructuring: The Relative Importance of Corporate Governance,
     Takeover Threat, and Free Cash Flow. Strategic Management Journal, 14, Special Issue: Corporate Restructuring,
     pp. 51-68.
     Hall, M., and L. Weiss, 1967. Firm Size and Profitability. Technology, Profit Risk, and Assessments of this review,
     49, pp. 319-331.
     Hamada, R.S., 1972.The Effect of the Firm's Capital Structure on the Systematic Risk of Common Stocks. Journal
     of Finance, 27, pp. 435-452.
     Harris, Milton, and Artur Raviv,1988. Corporate control contests and capital structure. Journal of Financial
     Economics, 20, pp. 55-86.
     Harris, M., and A. Raviv, 1991. The Theory of Capital Structure. Journal of Finance, 46, pp. 297-355.
     Hatfield, G., Cheng, L., and Davidson, W.1994.The determination of optimal Capital structure: the effect of firm
     and Industry debt ratios on market value. Journal of Financial and Strategic Decision,7 (3).
     Haugen, R.; Senbet, L. 1988. Bankruptcy and Agency Costs: Their Significance to the Theory of Optimal Capital
     Structure. The Journal of Financial and Quantitative Analysis, 23(1), pp. 27-38.
     Jensen, M. C.1986. Agency costs of free cash flow, corporate finance, and takeovers. American Economic
     Review, 76, pp. 323-339.
     Jensen, M. 1989. The eclipse of the public corporation. Harvard Business Review, 67, 61-75.
     Petroleum Exploration & Production Policy-2007. Ministry of Petroleum & Natural Resources Government of
     Pakistan.
     Pinegar, M.; Lease, R. 1986.The Impact of Preferred-for-Common Exchange Offers on Firm Value. The Journal of
     Finance, 41(4), pp. 795-814.
     Rajan, R.; Zingales, L. 1995.What Do We Know about Capital Structure? Some Evidence from International
     Data. The Journal of Finance, 50 (5), pp. 1421-1460.
     Raymar, S. 1991. A Model of Capital Structure when Earnings are Mean-Reverting. The Journal of Financial and
     Quantitative Analysis, 26(3), pp. 327-344.
     Scott, J. A.1976.Theory of Optimal Capital Structure. Bell Journal of Economics and Management Science, 7, pp.
     33-54.
     Stulz, R. 1988. Managerial control of voting rights: Financing policies and the market for corporate
     control. Journal of Financial Economics, 20, pp. 25-54.
     Modigliani, F., and Miller, M.H. 1958.The Cost of Capital, Corporate Finance and the Theory of
     Investment," American Economic Review, 48, pp. 261-296.


                                                             16
European Journal of Business and Management                                                                          www.iiste.org
ISSN 2222-1905 (Paper) ISSN 2222-2839 (Online)
Vol 4, No.11, 2012

      Modigliani, F., and Miller, M.H. 1963.Taxes and the Cost of Capital: A Correction. American Economic
      Review, 53, pp. 433-443.
      Mandelker, G.N., and Rhee, S.G., 1984.The Impact of the Degrees of Operating and Financial Leverage on
      Systematic Risk of Common Stock. Journal of Financial and Quantitative Analysis, 19, pp. 45-57.
      Weston, F. 1989.What MM Have Wrought. Financial Management, 18, (2), pp. 29-38.
      Zwiebel, J. 1992, Dynamic capital structure under managerial entrenchment. Working paper, Stanford University.


      APPENDIX

      Exhibit : Energy Overview

      Recoverable Coal Reserves (2003)                             3,362 million short tons
      Total Per Capita Energy Consumption                          12.4 million Btus
      (2003)

      Natural Gas Consumption (2004)                               967.6 billion cubic feet
      Coal Production (2004)                                       3.5 million short tons
      Coal Consumption (2004)                                      5.2 million short tons
      Electricity Installed Capacity (2004)                        20.4 gigawatts
      Electricity Production (2004)                                80.2 billion kilowatt hours
      Electricity Consumption (2004)                               74.6 billion kilowatt hours
      Total Energy Consumption (2004)                              2 quadrillion Btus*, of which Natural Gas (46%), Oil
                                                                   (35%), Hydroelectricity (14%), Coal (5%), Nuclear
                                                                   (1%), Other Renewables (0%)
      Energy Intensity (2004)                                      5,086.7 Btu per $2000-PPP


      Oil Production (2006)                                        59.4 thousand Barrels per day, of which 97% was crude
                                                                   oil.
      Oil Consumption (2006)                                       350 thousand barrels per day
      Crude Oil Distillation Capacity (2006)                       269 thousand barrels per day
      Proven Natural Gas Reserves (January 1,                      28.2 trillion cubic feet
      2006)


      Source: “Country Analysis Brief”, Energy Data, Statistics and Analysis - Oil, Gas, Electricity, Coal conducted by EIA
      (Energy information administration), December 2006.


[i] Capital Gearing Ratio= Capital with Fixed Return *100/ Equity
Debt to Equity Ratio=Total Liabilities *100/ Shareholder’s Equity
[ii] Return on assets= ROA= (100 x Net Profit After Tax/ Total Assets )
[iii] Return on Equity = (100 x Net Profit After Tax/ Equity (Common Stock)
[iv] Net profit margin= (100 x Net Profit After Tax/ Net Sales)

[v]   EPS=Earning per share

[vi] Sales growth (current year's 'sales - last year's sales / last year's sales)


                                                                   17
This academic article was published by The International Institute for Science,
Technology and Education (IISTE). The IISTE is a pioneer in the Open Access
Publishing service based in the U.S. and Europe. The aim of the institute is
Accelerating Global Knowledge Sharing.

More information about the publisher can be found in the IISTE’s homepage:
http://www.iiste.org


The IISTE is currently hosting more than 30 peer-reviewed academic journals and
collaborating with academic institutions around the world. Prospective authors of
IISTE journals can find the submission instruction on the following page:
http://www.iiste.org/Journals/

The IISTE editorial team promises to the review and publish all the qualified
submissions in a fast manner. All the journals articles are available online to the
readers all over the world without financial, legal, or technical barriers other than
those inseparable from gaining access to the internet itself. Printed version of the
journals is also available upon request of readers and authors.

IISTE Knowledge Sharing Partners

EBSCO, Index Copernicus, Ulrich's Periodicals Directory, JournalTOCS, PKP Open
Archives Harvester, Bielefeld Academic Search Engine, Elektronische
Zeitschriftenbibliothek EZB, Open J-Gate, OCLC WorldCat, Universe Digtial
Library , NewJour, Google Scholar

Contenu connexe

Tendances

India Strategy: All eyes on growth - Prabhudas Lilladher
India Strategy: All eyes on growth - Prabhudas LilladherIndia Strategy: All eyes on growth - Prabhudas Lilladher
India Strategy: All eyes on growth - Prabhudas LilladherIndiaNotes.com
 
Indian Economy
Indian EconomyIndian Economy
Indian Economykisnaneo
 
Special report-09-apr-2019-epic-research
Special report-09-apr-2019-epic-researchSpecial report-09-apr-2019-epic-research
Special report-09-apr-2019-epic-researchEpic Research Limited
 
1425386290 epl ar_13-14
1425386290 epl ar_13-141425386290 epl ar_13-14
1425386290 epl ar_13-14Prayag Kaushik
 
IERO NO 1/YEAR III/MARCH 2014
IERO NO 1/YEAR III/MARCH 2014IERO NO 1/YEAR III/MARCH 2014
IERO NO 1/YEAR III/MARCH 2014Rosa Kristiadi
 
C441424
C441424C441424
C441424aijbm
 
Economics liberalization and fiscal performance
Economics liberalization and fiscal performanceEconomics liberalization and fiscal performance
Economics liberalization and fiscal performancePrashant Kulkarni
 
Weekly media update 06.01.2014
Weekly media update 06.01.2014Weekly media update 06.01.2014
Weekly media update 06.01.2014BalmerLawrie
 

Tendances (11)

India Strategy: All eyes on growth - Prabhudas Lilladher
India Strategy: All eyes on growth - Prabhudas LilladherIndia Strategy: All eyes on growth - Prabhudas Lilladher
India Strategy: All eyes on growth - Prabhudas Lilladher
 
Indian Economy
Indian EconomyIndian Economy
Indian Economy
 
Special report-09-apr-2019-epic-research
Special report-09-apr-2019-epic-researchSpecial report-09-apr-2019-epic-research
Special report-09-apr-2019-epic-research
 
Weekly Market Review ; May 3, 2013
Weekly Market Review ; May 3, 2013Weekly Market Review ; May 3, 2013
Weekly Market Review ; May 3, 2013
 
1425386290 epl ar_13-14
1425386290 epl ar_13-141425386290 epl ar_13-14
1425386290 epl ar_13-14
 
IERO NO 1/YEAR III/MARCH 2014
IERO NO 1/YEAR III/MARCH 2014IERO NO 1/YEAR III/MARCH 2014
IERO NO 1/YEAR III/MARCH 2014
 
C441424
C441424C441424
C441424
 
Economics liberalization and fiscal performance
Economics liberalization and fiscal performanceEconomics liberalization and fiscal performance
Economics liberalization and fiscal performance
 
Akzo Nobel India Ltd.
Akzo Nobel India Ltd.Akzo Nobel India Ltd.
Akzo Nobel India Ltd.
 
Debt management
Debt managementDebt management
Debt management
 
Weekly media update 06.01.2014
Weekly media update 06.01.2014Weekly media update 06.01.2014
Weekly media update 06.01.2014
 

En vedette

Determinants of dividend payout policy of listed financial institutions in ghana
Determinants of dividend payout policy of listed financial institutions in ghanaDeterminants of dividend payout policy of listed financial institutions in ghana
Determinants of dividend payout policy of listed financial institutions in ghanaAlexander Decker
 
A unique common fixed point theorems in generalized d
A unique common fixed point theorems in generalized dA unique common fixed point theorems in generalized d
A unique common fixed point theorems in generalized dAlexander Decker
 
A universal model for managing the marketing executives in nigerian banks
A universal model for managing the marketing executives in nigerian banksA universal model for managing the marketing executives in nigerian banks
A universal model for managing the marketing executives in nigerian banksAlexander Decker
 
A usability evaluation framework for b2 c e commerce websites
A usability evaluation framework for b2 c e commerce websitesA usability evaluation framework for b2 c e commerce websites
A usability evaluation framework for b2 c e commerce websitesAlexander Decker
 
A validation of the adverse childhood experiences scale in
A validation of the adverse childhood experiences scale inA validation of the adverse childhood experiences scale in
A validation of the adverse childhood experiences scale inAlexander Decker
 
Abnormalities of hormones and inflammatory cytokines in women affected with p...
Abnormalities of hormones and inflammatory cytokines in women affected with p...Abnormalities of hormones and inflammatory cytokines in women affected with p...
Abnormalities of hormones and inflammatory cytokines in women affected with p...Alexander Decker
 
Dividend policy
Dividend policyDividend policy
Dividend policysaravanan
 

En vedette (7)

Determinants of dividend payout policy of listed financial institutions in ghana
Determinants of dividend payout policy of listed financial institutions in ghanaDeterminants of dividend payout policy of listed financial institutions in ghana
Determinants of dividend payout policy of listed financial institutions in ghana
 
A unique common fixed point theorems in generalized d
A unique common fixed point theorems in generalized dA unique common fixed point theorems in generalized d
A unique common fixed point theorems in generalized d
 
A universal model for managing the marketing executives in nigerian banks
A universal model for managing the marketing executives in nigerian banksA universal model for managing the marketing executives in nigerian banks
A universal model for managing the marketing executives in nigerian banks
 
A usability evaluation framework for b2 c e commerce websites
A usability evaluation framework for b2 c e commerce websitesA usability evaluation framework for b2 c e commerce websites
A usability evaluation framework for b2 c e commerce websites
 
A validation of the adverse childhood experiences scale in
A validation of the adverse childhood experiences scale inA validation of the adverse childhood experiences scale in
A validation of the adverse childhood experiences scale in
 
Abnormalities of hormones and inflammatory cytokines in women affected with p...
Abnormalities of hormones and inflammatory cytokines in women affected with p...Abnormalities of hormones and inflammatory cytokines in women affected with p...
Abnormalities of hormones and inflammatory cytokines in women affected with p...
 
Dividend policy
Dividend policyDividend policy
Dividend policy
 

Similaire à Relationship between financial leverage and financial performance

Black book project on power generation company
Black book project on power generation companyBlack book project on power generation company
Black book project on power generation companyAkash Gupta
 
Efficiency of Power Generation Companies in Pakistan: Application of Non-Para...
Efficiency of Power Generation Companies in Pakistan: Application of Non-Para...Efficiency of Power Generation Companies in Pakistan: Application of Non-Para...
Efficiency of Power Generation Companies in Pakistan: Application of Non-Para...NAUMAN MUSHTAQ
 
A PROJECT REPORT ON ANALYSIS OF FINANCIAL STATEMENTS OF NATIONAL THERMAL PO...
A PROJECT REPORT ON ANALYSIS OF FINANCIAL STATEMENTS  OF  NATIONAL THERMAL PO...A PROJECT REPORT ON ANALYSIS OF FINANCIAL STATEMENTS  OF  NATIONAL THERMAL PO...
A PROJECT REPORT ON ANALYSIS OF FINANCIAL STATEMENTS OF NATIONAL THERMAL PO...Rohit Kumar
 
International Journal of Humanities and Social Science Invention (IJHSSI)
International Journal of Humanities and Social Science Invention (IJHSSI)International Journal of Humanities and Social Science Invention (IJHSSI)
International Journal of Humanities and Social Science Invention (IJHSSI)inventionjournals
 
PSO internship report
PSO internship reportPSO internship report
PSO internship reportArif Mustafa
 
gmm.pdf
gmm.pdfgmm.pdf
gmm.pdfOmri6
 
in-enr-the-evolving-energy-landscape-india-april-2018-noexp.pdf
in-enr-the-evolving-energy-landscape-india-april-2018-noexp.pdfin-enr-the-evolving-energy-landscape-india-april-2018-noexp.pdf
in-enr-the-evolving-energy-landscape-india-april-2018-noexp.pdfAbhimit Kumar
 
Emperical study tanmay chakrabarty-14mb5058 (1)
Emperical study tanmay chakrabarty-14mb5058 (1)Emperical study tanmay chakrabarty-14mb5058 (1)
Emperical study tanmay chakrabarty-14mb5058 (1)Tanmay Chakrabarty
 
Emperical study tanmay chakrabarty-14mb5058 (1)
Emperical study tanmay chakrabarty-14mb5058 (1)Emperical study tanmay chakrabarty-14mb5058 (1)
Emperical study tanmay chakrabarty-14mb5058 (1)Tanmay Chakrabarty
 
Emperical study tanmay chakrabarty-14mb5058 (1)
Emperical study tanmay chakrabarty-14mb5058 (1)Emperical study tanmay chakrabarty-14mb5058 (1)
Emperical study tanmay chakrabarty-14mb5058 (1)Tanmay Chakrabarty
 
Emperical study tanmay chakrabarty-14mb5058 (1)
Emperical study tanmay chakrabarty-14mb5058 (1)Emperical study tanmay chakrabarty-14mb5058 (1)
Emperical study tanmay chakrabarty-14mb5058 (1)Tanmay Chakrabarty
 
Cause & effect relationshipt research paper qta -kashif ahmed saeed
Cause & effect relationshipt   research paper qta -kashif ahmed saeedCause & effect relationshipt   research paper qta -kashif ahmed saeed
Cause & effect relationshipt research paper qta -kashif ahmed saeedKashif Ahmed Saeed
 
58619593 financial-analysis-final-thesis-fauji-cement-pioneer-cement-1
58619593 financial-analysis-final-thesis-fauji-cement-pioneer-cement-158619593 financial-analysis-final-thesis-fauji-cement-pioneer-cement-1
58619593 financial-analysis-final-thesis-fauji-cement-pioneer-cement-1Kamran Hassan
 
Pakistan Budget overview 2013
Pakistan Budget overview 2013Pakistan Budget overview 2013
Pakistan Budget overview 2013Kausar Fecto
 
To find the relationship between capital structure and profitability. a compa...
To find the relationship between capital structure and profitability. a compa...To find the relationship between capital structure and profitability. a compa...
To find the relationship between capital structure and profitability. a compa...Tayyab Nihal
 
Study on Factors Affecting the Financial Performance of Enterprises
Study on Factors Affecting the Financial Performance of EnterprisesStudy on Factors Affecting the Financial Performance of Enterprises
Study on Factors Affecting the Financial Performance of Enterprisesijtsrd
 

Similaire à Relationship between financial leverage and financial performance (20)

Black book project on power generation company
Black book project on power generation companyBlack book project on power generation company
Black book project on power generation company
 
Efficiency of Power Generation Companies in Pakistan: Application of Non-Para...
Efficiency of Power Generation Companies in Pakistan: Application of Non-Para...Efficiency of Power Generation Companies in Pakistan: Application of Non-Para...
Efficiency of Power Generation Companies in Pakistan: Application of Non-Para...
 
A PROJECT REPORT ON ANALYSIS OF FINANCIAL STATEMENTS OF NATIONAL THERMAL PO...
A PROJECT REPORT ON ANALYSIS OF FINANCIAL STATEMENTS  OF  NATIONAL THERMAL PO...A PROJECT REPORT ON ANALYSIS OF FINANCIAL STATEMENTS  OF  NATIONAL THERMAL PO...
A PROJECT REPORT ON ANALYSIS OF FINANCIAL STATEMENTS OF NATIONAL THERMAL PO...
 
International Journal of Humanities and Social Science Invention (IJHSSI)
International Journal of Humanities and Social Science Invention (IJHSSI)International Journal of Humanities and Social Science Invention (IJHSSI)
International Journal of Humanities and Social Science Invention (IJHSSI)
 
PSO internship report
PSO internship reportPSO internship report
PSO internship report
 
gmm.pdf
gmm.pdfgmm.pdf
gmm.pdf
 
in-enr-the-evolving-energy-landscape-india-april-2018-noexp.pdf
in-enr-the-evolving-energy-landscape-india-april-2018-noexp.pdfin-enr-the-evolving-energy-landscape-india-april-2018-noexp.pdf
in-enr-the-evolving-energy-landscape-india-april-2018-noexp.pdf
 
Emperical study tanmay chakrabarty-14mb5058 (1)
Emperical study tanmay chakrabarty-14mb5058 (1)Emperical study tanmay chakrabarty-14mb5058 (1)
Emperical study tanmay chakrabarty-14mb5058 (1)
 
Emperical study tanmay chakrabarty-14mb5058 (1)
Emperical study tanmay chakrabarty-14mb5058 (1)Emperical study tanmay chakrabarty-14mb5058 (1)
Emperical study tanmay chakrabarty-14mb5058 (1)
 
Emperical study tanmay chakrabarty-14mb5058 (1)
Emperical study tanmay chakrabarty-14mb5058 (1)Emperical study tanmay chakrabarty-14mb5058 (1)
Emperical study tanmay chakrabarty-14mb5058 (1)
 
Emperical study tanmay chakrabarty-14mb5058 (1)
Emperical study tanmay chakrabarty-14mb5058 (1)Emperical study tanmay chakrabarty-14mb5058 (1)
Emperical study tanmay chakrabarty-14mb5058 (1)
 
Energy Consumption & Economic Growth
Energy Consumption & Economic GrowthEnergy Consumption & Economic Growth
Energy Consumption & Economic Growth
 
Mpra paper 16292
Mpra paper 16292Mpra paper 16292
Mpra paper 16292
 
Cause & effect relationshipt research paper qta -kashif ahmed saeed
Cause & effect relationshipt   research paper qta -kashif ahmed saeedCause & effect relationshipt   research paper qta -kashif ahmed saeed
Cause & effect relationshipt research paper qta -kashif ahmed saeed
 
58619593 financial-analysis-final-thesis-fauji-cement-pioneer-cement-1
58619593 financial-analysis-final-thesis-fauji-cement-pioneer-cement-158619593 financial-analysis-final-thesis-fauji-cement-pioneer-cement-1
58619593 financial-analysis-final-thesis-fauji-cement-pioneer-cement-1
 
Vijay Kumar Gaba
Vijay Kumar GabaVijay Kumar Gaba
Vijay Kumar Gaba
 
Pakistan Budget overview 2013
Pakistan Budget overview 2013Pakistan Budget overview 2013
Pakistan Budget overview 2013
 
Ijm 06 07_006
Ijm 06 07_006Ijm 06 07_006
Ijm 06 07_006
 
To find the relationship between capital structure and profitability. a compa...
To find the relationship between capital structure and profitability. a compa...To find the relationship between capital structure and profitability. a compa...
To find the relationship between capital structure and profitability. a compa...
 
Study on Factors Affecting the Financial Performance of Enterprises
Study on Factors Affecting the Financial Performance of EnterprisesStudy on Factors Affecting the Financial Performance of Enterprises
Study on Factors Affecting the Financial Performance of Enterprises
 

Plus de Alexander Decker

A trends of salmonella and antibiotic resistance
A trends of salmonella and antibiotic resistanceA trends of salmonella and antibiotic resistance
A trends of salmonella and antibiotic resistanceAlexander Decker
 
A transformational generative approach towards understanding al-istifham
A transformational  generative approach towards understanding al-istifhamA transformational  generative approach towards understanding al-istifham
A transformational generative approach towards understanding al-istifhamAlexander Decker
 
A time series analysis of the determinants of savings in namibia
A time series analysis of the determinants of savings in namibiaA time series analysis of the determinants of savings in namibia
A time series analysis of the determinants of savings in namibiaAlexander Decker
 
A therapy for physical and mental fitness of school children
A therapy for physical and mental fitness of school childrenA therapy for physical and mental fitness of school children
A therapy for physical and mental fitness of school childrenAlexander Decker
 
A theory of efficiency for managing the marketing executives in nigerian banks
A theory of efficiency for managing the marketing executives in nigerian banksA theory of efficiency for managing the marketing executives in nigerian banks
A theory of efficiency for managing the marketing executives in nigerian banksAlexander Decker
 
A systematic evaluation of link budget for
A systematic evaluation of link budget forA systematic evaluation of link budget for
A systematic evaluation of link budget forAlexander Decker
 
A synthetic review of contraceptive supplies in punjab
A synthetic review of contraceptive supplies in punjabA synthetic review of contraceptive supplies in punjab
A synthetic review of contraceptive supplies in punjabAlexander Decker
 
A synthesis of taylor’s and fayol’s management approaches for managing market...
A synthesis of taylor’s and fayol’s management approaches for managing market...A synthesis of taylor’s and fayol’s management approaches for managing market...
A synthesis of taylor’s and fayol’s management approaches for managing market...Alexander Decker
 
A survey paper on sequence pattern mining with incremental
A survey paper on sequence pattern mining with incrementalA survey paper on sequence pattern mining with incremental
A survey paper on sequence pattern mining with incrementalAlexander Decker
 
A survey on live virtual machine migrations and its techniques
A survey on live virtual machine migrations and its techniquesA survey on live virtual machine migrations and its techniques
A survey on live virtual machine migrations and its techniquesAlexander Decker
 
A survey on data mining and analysis in hadoop and mongo db
A survey on data mining and analysis in hadoop and mongo dbA survey on data mining and analysis in hadoop and mongo db
A survey on data mining and analysis in hadoop and mongo dbAlexander Decker
 
A survey on challenges to the media cloud
A survey on challenges to the media cloudA survey on challenges to the media cloud
A survey on challenges to the media cloudAlexander Decker
 
A survey of provenance leveraged
A survey of provenance leveragedA survey of provenance leveraged
A survey of provenance leveragedAlexander Decker
 
A survey of private equity investments in kenya
A survey of private equity investments in kenyaA survey of private equity investments in kenya
A survey of private equity investments in kenyaAlexander Decker
 
A study to measures the financial health of
A study to measures the financial health ofA study to measures the financial health of
A study to measures the financial health ofAlexander Decker
 
A study to evaluate the attitude of faculty members of public universities of...
A study to evaluate the attitude of faculty members of public universities of...A study to evaluate the attitude of faculty members of public universities of...
A study to evaluate the attitude of faculty members of public universities of...Alexander Decker
 
A study to assess the knowledge regarding prevention of pneumonia among middl...
A study to assess the knowledge regarding prevention of pneumonia among middl...A study to assess the knowledge regarding prevention of pneumonia among middl...
A study to assess the knowledge regarding prevention of pneumonia among middl...Alexander Decker
 
A study regarding analyzing recessionary impact on fundamental determinants o...
A study regarding analyzing recessionary impact on fundamental determinants o...A study regarding analyzing recessionary impact on fundamental determinants o...
A study regarding analyzing recessionary impact on fundamental determinants o...Alexander Decker
 
A study on would be urban-migrants’ needs and necessities in rural bangladesh...
A study on would be urban-migrants’ needs and necessities in rural bangladesh...A study on would be urban-migrants’ needs and necessities in rural bangladesh...
A study on would be urban-migrants’ needs and necessities in rural bangladesh...Alexander Decker
 
A study on the evaluation of scientific creativity among science
A study on the evaluation of scientific creativity among scienceA study on the evaluation of scientific creativity among science
A study on the evaluation of scientific creativity among scienceAlexander Decker
 

Plus de Alexander Decker (20)

A trends of salmonella and antibiotic resistance
A trends of salmonella and antibiotic resistanceA trends of salmonella and antibiotic resistance
A trends of salmonella and antibiotic resistance
 
A transformational generative approach towards understanding al-istifham
A transformational  generative approach towards understanding al-istifhamA transformational  generative approach towards understanding al-istifham
A transformational generative approach towards understanding al-istifham
 
A time series analysis of the determinants of savings in namibia
A time series analysis of the determinants of savings in namibiaA time series analysis of the determinants of savings in namibia
A time series analysis of the determinants of savings in namibia
 
A therapy for physical and mental fitness of school children
A therapy for physical and mental fitness of school childrenA therapy for physical and mental fitness of school children
A therapy for physical and mental fitness of school children
 
A theory of efficiency for managing the marketing executives in nigerian banks
A theory of efficiency for managing the marketing executives in nigerian banksA theory of efficiency for managing the marketing executives in nigerian banks
A theory of efficiency for managing the marketing executives in nigerian banks
 
A systematic evaluation of link budget for
A systematic evaluation of link budget forA systematic evaluation of link budget for
A systematic evaluation of link budget for
 
A synthetic review of contraceptive supplies in punjab
A synthetic review of contraceptive supplies in punjabA synthetic review of contraceptive supplies in punjab
A synthetic review of contraceptive supplies in punjab
 
A synthesis of taylor’s and fayol’s management approaches for managing market...
A synthesis of taylor’s and fayol’s management approaches for managing market...A synthesis of taylor’s and fayol’s management approaches for managing market...
A synthesis of taylor’s and fayol’s management approaches for managing market...
 
A survey paper on sequence pattern mining with incremental
A survey paper on sequence pattern mining with incrementalA survey paper on sequence pattern mining with incremental
A survey paper on sequence pattern mining with incremental
 
A survey on live virtual machine migrations and its techniques
A survey on live virtual machine migrations and its techniquesA survey on live virtual machine migrations and its techniques
A survey on live virtual machine migrations and its techniques
 
A survey on data mining and analysis in hadoop and mongo db
A survey on data mining and analysis in hadoop and mongo dbA survey on data mining and analysis in hadoop and mongo db
A survey on data mining and analysis in hadoop and mongo db
 
A survey on challenges to the media cloud
A survey on challenges to the media cloudA survey on challenges to the media cloud
A survey on challenges to the media cloud
 
A survey of provenance leveraged
A survey of provenance leveragedA survey of provenance leveraged
A survey of provenance leveraged
 
A survey of private equity investments in kenya
A survey of private equity investments in kenyaA survey of private equity investments in kenya
A survey of private equity investments in kenya
 
A study to measures the financial health of
A study to measures the financial health ofA study to measures the financial health of
A study to measures the financial health of
 
A study to evaluate the attitude of faculty members of public universities of...
A study to evaluate the attitude of faculty members of public universities of...A study to evaluate the attitude of faculty members of public universities of...
A study to evaluate the attitude of faculty members of public universities of...
 
A study to assess the knowledge regarding prevention of pneumonia among middl...
A study to assess the knowledge regarding prevention of pneumonia among middl...A study to assess the knowledge regarding prevention of pneumonia among middl...
A study to assess the knowledge regarding prevention of pneumonia among middl...
 
A study regarding analyzing recessionary impact on fundamental determinants o...
A study regarding analyzing recessionary impact on fundamental determinants o...A study regarding analyzing recessionary impact on fundamental determinants o...
A study regarding analyzing recessionary impact on fundamental determinants o...
 
A study on would be urban-migrants’ needs and necessities in rural bangladesh...
A study on would be urban-migrants’ needs and necessities in rural bangladesh...A study on would be urban-migrants’ needs and necessities in rural bangladesh...
A study on would be urban-migrants’ needs and necessities in rural bangladesh...
 
A study on the evaluation of scientific creativity among science
A study on the evaluation of scientific creativity among scienceA study on the evaluation of scientific creativity among science
A study on the evaluation of scientific creativity among science
 

Dernier

It will be International Nurses' Day on 12 May
It will be International Nurses' Day on 12 MayIt will be International Nurses' Day on 12 May
It will be International Nurses' Day on 12 MayNZSG
 
Monte Carlo simulation : Simulation using MCSM
Monte Carlo simulation : Simulation using MCSMMonte Carlo simulation : Simulation using MCSM
Monte Carlo simulation : Simulation using MCSMRavindra Nath Shukla
 
Unlocking the Secrets of Affiliate Marketing.pdf
Unlocking the Secrets of Affiliate Marketing.pdfUnlocking the Secrets of Affiliate Marketing.pdf
Unlocking the Secrets of Affiliate Marketing.pdfOnline Income Engine
 
A DAY IN THE LIFE OF A SALESMAN / WOMAN
A DAY IN THE LIFE OF A  SALESMAN / WOMANA DAY IN THE LIFE OF A  SALESMAN / WOMAN
A DAY IN THE LIFE OF A SALESMAN / WOMANIlamathiKannappan
 
Creating Low-Code Loan Applications using the Trisotech Mortgage Feature Set
Creating Low-Code Loan Applications using the Trisotech Mortgage Feature SetCreating Low-Code Loan Applications using the Trisotech Mortgage Feature Set
Creating Low-Code Loan Applications using the Trisotech Mortgage Feature SetDenis Gagné
 
BEST ✨ Call Girls In Indirapuram Ghaziabad ✔️ 9871031762 ✔️ Escorts Service...
BEST ✨ Call Girls In  Indirapuram Ghaziabad  ✔️ 9871031762 ✔️ Escorts Service...BEST ✨ Call Girls In  Indirapuram Ghaziabad  ✔️ 9871031762 ✔️ Escorts Service...
BEST ✨ Call Girls In Indirapuram Ghaziabad ✔️ 9871031762 ✔️ Escorts Service...noida100girls
 
Grateful 7 speech thanking everyone that has helped.pdf
Grateful 7 speech thanking everyone that has helped.pdfGrateful 7 speech thanking everyone that has helped.pdf
Grateful 7 speech thanking everyone that has helped.pdfPaul Menig
 
VIP Kolkata Call Girl Howrah 👉 8250192130 Available With Room
VIP Kolkata Call Girl Howrah 👉 8250192130  Available With RoomVIP Kolkata Call Girl Howrah 👉 8250192130  Available With Room
VIP Kolkata Call Girl Howrah 👉 8250192130 Available With Roomdivyansh0kumar0
 
Pharma Works Profile of Karan Communications
Pharma Works Profile of Karan CommunicationsPharma Works Profile of Karan Communications
Pharma Works Profile of Karan Communicationskarancommunications
 
Call Girls In DLf Gurgaon ➥99902@11544 ( Best price)100% Genuine Escort In 24...
Call Girls In DLf Gurgaon ➥99902@11544 ( Best price)100% Genuine Escort In 24...Call Girls In DLf Gurgaon ➥99902@11544 ( Best price)100% Genuine Escort In 24...
Call Girls In DLf Gurgaon ➥99902@11544 ( Best price)100% Genuine Escort In 24...lizamodels9
 
Monthly Social Media Update April 2024 pptx.pptx
Monthly Social Media Update April 2024 pptx.pptxMonthly Social Media Update April 2024 pptx.pptx
Monthly Social Media Update April 2024 pptx.pptxAndy Lambert
 
GD Birla and his contribution in management
GD Birla and his contribution in managementGD Birla and his contribution in management
GD Birla and his contribution in managementchhavia330
 
Mondelez State of Snacking and Future Trends 2023
Mondelez State of Snacking and Future Trends 2023Mondelez State of Snacking and Future Trends 2023
Mondelez State of Snacking and Future Trends 2023Neil Kimberley
 
Russian Faridabad Call Girls(Badarpur) : ☎ 8168257667, @4999
Russian Faridabad Call Girls(Badarpur) : ☎ 8168257667, @4999Russian Faridabad Call Girls(Badarpur) : ☎ 8168257667, @4999
Russian Faridabad Call Girls(Badarpur) : ☎ 8168257667, @4999Tina Ji
 
Value Proposition canvas- Customer needs and pains
Value Proposition canvas- Customer needs and painsValue Proposition canvas- Customer needs and pains
Value Proposition canvas- Customer needs and painsP&CO
 
Call Girls In Panjim North Goa 9971646499 Genuine Service
Call Girls In Panjim North Goa 9971646499 Genuine ServiceCall Girls In Panjim North Goa 9971646499 Genuine Service
Call Girls In Panjim North Goa 9971646499 Genuine Serviceritikaroy0888
 
Call Girls Navi Mumbai Just Call 9907093804 Top Class Call Girl Service Avail...
Call Girls Navi Mumbai Just Call 9907093804 Top Class Call Girl Service Avail...Call Girls Navi Mumbai Just Call 9907093804 Top Class Call Girl Service Avail...
Call Girls Navi Mumbai Just Call 9907093804 Top Class Call Girl Service Avail...Dipal Arora
 
VIP Call Girl Jamshedpur Aashi 8250192130 Independent Escort Service Jamshedpur
VIP Call Girl Jamshedpur Aashi 8250192130 Independent Escort Service JamshedpurVIP Call Girl Jamshedpur Aashi 8250192130 Independent Escort Service Jamshedpur
VIP Call Girl Jamshedpur Aashi 8250192130 Independent Escort Service JamshedpurSuhani Kapoor
 
9599632723 Top Call Girls in Delhi at your Door Step Available 24x7 Delhi
9599632723 Top Call Girls in Delhi at your Door Step Available 24x7 Delhi9599632723 Top Call Girls in Delhi at your Door Step Available 24x7 Delhi
9599632723 Top Call Girls in Delhi at your Door Step Available 24x7 DelhiCall Girls in Delhi
 

Dernier (20)

It will be International Nurses' Day on 12 May
It will be International Nurses' Day on 12 MayIt will be International Nurses' Day on 12 May
It will be International Nurses' Day on 12 May
 
Monte Carlo simulation : Simulation using MCSM
Monte Carlo simulation : Simulation using MCSMMonte Carlo simulation : Simulation using MCSM
Monte Carlo simulation : Simulation using MCSM
 
Forklift Operations: Safety through Cartoons
Forklift Operations: Safety through CartoonsForklift Operations: Safety through Cartoons
Forklift Operations: Safety through Cartoons
 
Unlocking the Secrets of Affiliate Marketing.pdf
Unlocking the Secrets of Affiliate Marketing.pdfUnlocking the Secrets of Affiliate Marketing.pdf
Unlocking the Secrets of Affiliate Marketing.pdf
 
A DAY IN THE LIFE OF A SALESMAN / WOMAN
A DAY IN THE LIFE OF A  SALESMAN / WOMANA DAY IN THE LIFE OF A  SALESMAN / WOMAN
A DAY IN THE LIFE OF A SALESMAN / WOMAN
 
Creating Low-Code Loan Applications using the Trisotech Mortgage Feature Set
Creating Low-Code Loan Applications using the Trisotech Mortgage Feature SetCreating Low-Code Loan Applications using the Trisotech Mortgage Feature Set
Creating Low-Code Loan Applications using the Trisotech Mortgage Feature Set
 
BEST ✨ Call Girls In Indirapuram Ghaziabad ✔️ 9871031762 ✔️ Escorts Service...
BEST ✨ Call Girls In  Indirapuram Ghaziabad  ✔️ 9871031762 ✔️ Escorts Service...BEST ✨ Call Girls In  Indirapuram Ghaziabad  ✔️ 9871031762 ✔️ Escorts Service...
BEST ✨ Call Girls In Indirapuram Ghaziabad ✔️ 9871031762 ✔️ Escorts Service...
 
Grateful 7 speech thanking everyone that has helped.pdf
Grateful 7 speech thanking everyone that has helped.pdfGrateful 7 speech thanking everyone that has helped.pdf
Grateful 7 speech thanking everyone that has helped.pdf
 
VIP Kolkata Call Girl Howrah 👉 8250192130 Available With Room
VIP Kolkata Call Girl Howrah 👉 8250192130  Available With RoomVIP Kolkata Call Girl Howrah 👉 8250192130  Available With Room
VIP Kolkata Call Girl Howrah 👉 8250192130 Available With Room
 
Pharma Works Profile of Karan Communications
Pharma Works Profile of Karan CommunicationsPharma Works Profile of Karan Communications
Pharma Works Profile of Karan Communications
 
Call Girls In DLf Gurgaon ➥99902@11544 ( Best price)100% Genuine Escort In 24...
Call Girls In DLf Gurgaon ➥99902@11544 ( Best price)100% Genuine Escort In 24...Call Girls In DLf Gurgaon ➥99902@11544 ( Best price)100% Genuine Escort In 24...
Call Girls In DLf Gurgaon ➥99902@11544 ( Best price)100% Genuine Escort In 24...
 
Monthly Social Media Update April 2024 pptx.pptx
Monthly Social Media Update April 2024 pptx.pptxMonthly Social Media Update April 2024 pptx.pptx
Monthly Social Media Update April 2024 pptx.pptx
 
GD Birla and his contribution in management
GD Birla and his contribution in managementGD Birla and his contribution in management
GD Birla and his contribution in management
 
Mondelez State of Snacking and Future Trends 2023
Mondelez State of Snacking and Future Trends 2023Mondelez State of Snacking and Future Trends 2023
Mondelez State of Snacking and Future Trends 2023
 
Russian Faridabad Call Girls(Badarpur) : ☎ 8168257667, @4999
Russian Faridabad Call Girls(Badarpur) : ☎ 8168257667, @4999Russian Faridabad Call Girls(Badarpur) : ☎ 8168257667, @4999
Russian Faridabad Call Girls(Badarpur) : ☎ 8168257667, @4999
 
Value Proposition canvas- Customer needs and pains
Value Proposition canvas- Customer needs and painsValue Proposition canvas- Customer needs and pains
Value Proposition canvas- Customer needs and pains
 
Call Girls In Panjim North Goa 9971646499 Genuine Service
Call Girls In Panjim North Goa 9971646499 Genuine ServiceCall Girls In Panjim North Goa 9971646499 Genuine Service
Call Girls In Panjim North Goa 9971646499 Genuine Service
 
Call Girls Navi Mumbai Just Call 9907093804 Top Class Call Girl Service Avail...
Call Girls Navi Mumbai Just Call 9907093804 Top Class Call Girl Service Avail...Call Girls Navi Mumbai Just Call 9907093804 Top Class Call Girl Service Avail...
Call Girls Navi Mumbai Just Call 9907093804 Top Class Call Girl Service Avail...
 
VIP Call Girl Jamshedpur Aashi 8250192130 Independent Escort Service Jamshedpur
VIP Call Girl Jamshedpur Aashi 8250192130 Independent Escort Service JamshedpurVIP Call Girl Jamshedpur Aashi 8250192130 Independent Escort Service Jamshedpur
VIP Call Girl Jamshedpur Aashi 8250192130 Independent Escort Service Jamshedpur
 
9599632723 Top Call Girls in Delhi at your Door Step Available 24x7 Delhi
9599632723 Top Call Girls in Delhi at your Door Step Available 24x7 Delhi9599632723 Top Call Girls in Delhi at your Door Step Available 24x7 Delhi
9599632723 Top Call Girls in Delhi at your Door Step Available 24x7 Delhi
 

Relationship between financial leverage and financial performance

  • 1. European Journal of Business and Management www.iiste.org ISSN 2222-1905 (Paper) ISSN 2222-2839 (Online) Vol 4, No.11, 2012 Relationship between Financial Leverage and Financial Performance: Evidence from Fuel & Energy Sector of Pakistan Shehla Akhtar. Mohammad Ali Jinnah University, Islamabad shehlaakhter@gmail.com Benish Javed Mohammad Ali Jinnah University, Islamabad benishsasha@yahoo.com Atiya Maryam Mohammad Ali Jinnah University, Islamabad attiamar@gmail.com Haleema Sadia Mohammad Ali Jinnah University, Islamabad sadia.haleema@gmail.com ABSTRACT Fuel and energy sector serves as the backbone of the economy. The segment provides support, not only for the economic development of the country by showing positive trends towards the sectoral growth, but also serves as a steering wheel for the growth of manufacturing, trading and service sector. It provides significant inputs for production, trade and service. A general concept prevails that the financial leverage is helpful to enhance the financial performance of the companies. For measuring the impact of financial leverage on the financial health of the companies, it is essential to know whether a positive relationship exists between the financial leverage and financial performance or not? So, this study is intended to test the hypothesis and to measure a relationship between the financial leverage and the financial performance of the fuel and energy sector in Pakistan. The paper also examines the generalization that firms with higher profitability may choose high leverage by using various statistical tools. The findings of the study show a positive relationship between the financial leverage and the financial performance of the companies by accepting the alternate hypothesis H1 and Ho is rejected. The results of the study confirm that the firms having higher profitability may improve their financial performance by having high levels of financial leverage. The study provides evidence by evaluating different facts. It reveals that the players of the fuel and energy in Pakistan can improve at their financial performance by employing the financial leverage and can arrive at a sustainable future growth by making vital decisions about the choice of their optimal capital structure. Key Words: Financial leverage, Firms’ Performance, Key Indicators- Financial Ratios, Fuel and Energy Sector in Pakistan 1. INTRODUCTION There is a general perception that a relationship exists between the financial leverage and the performance of the companies. In this study, we test the hypothesis. Employing a sample of 20 listed public limited companies from Fuel and Energy sector listed at Karachi Stock Exchange (KSE). The study aimed at measuring the relationship between financial leverage and the financial performance. To test the hypothesis, the main variables used in the study consist of a dependent variable which is financial performance of fuel and energy sector while an independent variable financial leverage in fuel and energy sector. Basically, the study aims at measuring the relationship between the two stated variables. The key financial performance indicators used in the study are return on assets ( % ), return on equity ( % ), dividend cover ratio ( % ), dividend ratio to equity ( % ), net profit margin ( % ), earning per share before tax, earning per share after tax ( % ), sales as % of total assets ( % ), earning per share before tax growth( % ), sales growth ( % ). Financial leverage of the industry will engage the key leverage indicators commonly used including the gearing ratio ( % ), debt equity ratio ( % ) and debt equity ratio. The results will assess the real scenario about the relationship of financial leverage with financial performance of the industry. 2. BACKGROUND Energy serves as a steering wheel for the economy of a country to step towards sustainable economic growth. According to Statistics and Analysis of Energy Data, in December 2006, Electricity, Oil, Gas, and Coal conducted by EIA (Energy information administration), Pakistan has shown a nominal expansion in its energy sector, in spite of the major disaster of 7
  • 2. European Journal of Business and Management www.iiste.org ISSN 2222-1905 (Paper) ISSN 2222-2839 (Online) Vol 4, No.11, 2012 earthquake happen in 2005. Pakistan's economy has improved from years of slow growth, due to droughts and other natural disasters in various sectors of economy. In fiscal year 2004-05, the gross domestic product of Pakistan has shown a growth rate of 8.4% while in year 2005-06, the GDP growth rate of 6.6 % was achieved. In year 2004-05 high growth in inflation 9.1% resulted in increase in prices of oil, house rents and shortage in basic food item. In order to implement control measures for reducing inflation, the State Bank of Pakistan declared the interest rates would rise. As a result of such strategy, the inflation rate decline to 7.6% by the end of the year 2005-06. The two major donors to Pakistan The World Bank and International Monetary Fund (IMF) have recognized the positive growth and progress in performance in the country’s restructuring, but they pointed out the slow growth sectors i.e, energy sector and public institutions. In current period, two major reasons for increased imports of oil from Middle East are the increased consumption and flat production in the country. Pakistan is relying on oil and petroleum products import due to lack of refining capacity. 50% of total energy utilization in Pakistan is covered by the natural gas reserves. All domestic natural gas production is currently consumed by the country but higher production is required by Pakistan to be an importer of natural gas. In this regard, Pakistan is making efforts to explore various LNG and pipeline import options in order to meet the expected demand growth. The demand for electricity in country is rapidly increasing. In order to meet expected demand in 2010, 50% growth in capacity is required as per government estimates. Economic survey of Pakistan year 2006-07 provides that the economy of the country is demonstrating 7.6% growth per annum for the period of previous three years, as in this regard government is trying to maintain it for future growth. The government realizes a quite strong relationship between economic growth of energy and its demand and making efforts in this regard. Government is taking new project in action like, setting up of new nuclear power plant, overhauling existing power generation plants to enhance their generation capacity, utilizing 175 billion tones of Thar coal reserves, import of LNG; increase in oil and gas exploration in the country; import of piped natural gas from Iran and Turkmenistan’s; exploiting the affordable alternate energy resources. By promoting efficient use of energy resources the supply can be increase. Production of crude oil per day showed up an increase of 1.7% from to 65,385 barrels per day to 66,485 barrels during the month of July-March 2006-07. The production of crude oil has showed a raise of 18.2 million barrels in the months of July-March 2006-07 from 17.9 million barrels in contrast of July –March last year, which indicates a raise of 1.7%. Pakistan’s CNG fleet is number 1 in Asia and the Number 3rdin the world’s. The government has already invested Rs 60 billion in this sector and trying to start different projects as well. The incredible expansion in this sector has created 60,000 new jobs. With the collaborative effort of Federal Government and Cabinet Division, collectively trying to provide motivation to the people by giving relief in interest payment of the loans, which is essential to acquire new CNG vehicles. For this purpose, the cities of Hyderabad, Quetta, Peshawar, Islamabad, Rawalpindi, Lahore and Karachi, are cutting out diesel vehicles to replace it by CNG vehicles for intra-city hauling. The whole range of wagons, mini buses and new buses, will be converted on CNG – or dual fuel transportation. Provincial governments in country are also taking steps to sponsor CNG conversions. In this regard government of Punjab announced 20% capital cost for every new CNG vehicle (Energy-Overview of the Economy, Economic Survey of Pakistan fiscal year 2006-07). The country Government states the policy objectives for the energy sector in “Petroleum Exploration & Production Policy 2007" published by Ministry of Petroleum & Natural Resources; the objectives include the promotion of Foreign Direct investment in country through increased healthy competition for investments in the energy sector, promotion of local oil and gas companies of Pakistan for stated sector investment opportunities, training of country officials in Energy and Petroleum sector to according to international standards and creating an environment of retaining in the region. Further more they aim at promotion of enhanced Energy and Petroleum activity in the front line areas by offering incentive competitive environment. The Government of Pakistan is also working on project to build a pipeline from Iran’s natural gas reserves to Indian marketplace across the country’s region (Statistics and Analysis of Energy Data, Electricity, Oil, Gas, Coal conducted by EIA (Energy information administration), 2006) .In august 2006, Pakistan resigned a memorandum of understanding 2005 until 2007 with Iran. Price to be paid for Gas is the major concern for both countries India and Pakistan. The three countries selected an international consultant to act as a mediator for the solution of pricing issue. Pakistani administrators focused on their ability to maintain the pipeline while Iran took the responsibility to cover 60 % of the construction cost .The annual expected earning from this pipeline is for Pakistan could be $70 million in transit fees. If India chooses to quit its share in the pipeline project, Iran and Pakistan have agreed to work on a bilateral pipeline project. Dolphin Project in Qatar is a 8
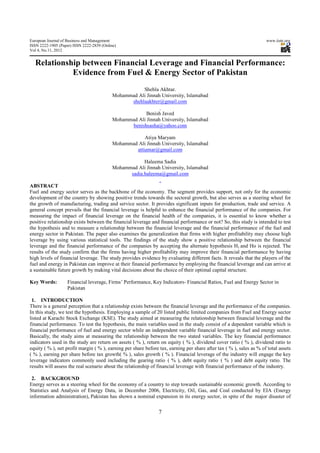
  • 3. European Journal of Business and Management www.iiste.org ISSN 2222-1905 (Paper) ISSN 2222-2839 (Online) Vol 4, No.11, 2012 second import possibility under consideration. Sub sea pipeline from Oman will help out supply of natural gas to Pakistan. A pipe line from Turkmenistan to Pakistan through Afghanistan is another alternative for Pakistan. The Price charged by Turkmenistan and the security situation of Afghanistan are major constraint in this regard. Source: Ministry of Petroleum and Natural Resources in Pakistan Figure 1: Proposed regional Gas Pipeline routes In short, we can say that the fuel and energy sector is making a significant contribution towards the economic growth of the country along with current developments, pursued by further prospects for future development. 3. SIGNIFICANCE & STUDY RATIONAL Energy serves as a steering wheel for the economy of a country to step towards sustainable economic growth. Energy is used as an input for various industries, and is also used as a commodity to be used in commerce and trade activities. Energy is the most vital resource for the industrial growth as it functions like a backbone on which the whole industrial body is dependent. To prosper, a country needs to embrace the growth in energy sector. More or less each and every production unit working in the economy is using the energy as a raw material to base its production by using such resource. Particularly for the manufacturing sector its significance is same as the Importance of blood in veins. The study conducted for observing the impact of financial leverage on the financial performance of the companies will help out the companies to know about the effect and increase the profitability by considering the option of leverage, if it proves to make a significant positive impact on financial performance. The fuel and energy sector is the major consideration of the study as this sector is growing rapidly and serves as the primary concern to provide the input to the other industries. The change in oil & gas prices creates a jerk to the other industries if it is raised because it may raise the proportionate costs of production in various industries and even a common consumer may suffer a lot as the results of inflation and reduced purchasing power. Not only the manufacturing sector suffers but various financial sector industries also have deep concerns as their revenues may also squeeze due to increased inflation, lower purchasing powers etc. and also other economic effects. There is a general hypothesis that leverage increases the risk of the firm which in turn increases the proportionate returns leading to the ultimate wealth maximization of the shareholders, which is to be tested in the study. If leverage brings returns and ultimately the maximization of value to the company, the long term sustainable growth in fuel and energy sector is possible. If the fuel and energy sector is growing, new developments will be observed, it will lead towards the overall country’s industrial growth as many other industrial players are dependent on fuel and energy for production. So, the study carries a great significance not only for the fuel and energy sector but also for the dependent bodies. It makes a considerable meaning even if we say the trade activity revolves around the fuel and energy sector in the whole world. 4. DIRECTION FOR FUTURE RESEARCH The research will provide a direction for further research on fuel and energy sector in Pakistan regarding the impact of financial leverage on the performance of companies operating, measuring a cause and effect relationship. It may lead to the 9
  • 4. European Journal of Business and Management www.iiste.org ISSN 2222-1905 (Paper) ISSN 2222-2839 (Online) Vol 4, No.11, 2012 future researches to be carried out by analyzing the individual company’s performance and making a comparison with the whole industry by using the industry performance as bench marks. After measuring the relationship between the leverage and the financial performance, a further study to measure the significance of financial leverage for the sector under discussion can be carried out and what impact would it make on the financial performance if the financial leverage of the companies is increased or reduced and how can the industry players maximize their shareholders’ wealth by using leverage. How the firm’s stock value is influenced by using the different levels of leverage and how companies lying in such sector or the industry players can achieve the sustainable growth by implying the leverage concept. What impact the leverage can make on the sectoral risks and the company specific risks and how to measure, evaluate, and control the systematic and asystematic risks involved for levered companies in such industry. What impact would the increased risks by leverage can make over the required rate of return of the companies? These are some questions which may be answered in several studies for the fuel and energy sector in Pakistan to lead towards the sustainable future growth. 5. HYPOTHESIS- H1: Financial leverage has got a positive relationship with financial performance of the companies operating in fuel and energy sector. 6. LITERATURE REVIEW The Stock leverage can be defined as the ratio of total liabilities to total assets. It can be seen as alternative for the residual claim of equity holders. However, the stock leverage may not be a healthy indicator in terms of identifying the firms default risk in near future (Rajan; Zingales, 1995). The earnings are independently and identically distributed, so the leverage remains same in each period (Scott, 1976). The multi period earnings and leverage relationship is examined by Barnea, Haugen, and Talmo, (1987). In their point of view adequate earnings cause brings losses for tax benefits as Raymar (1991) find that the leverage increases with the ratio of operating earnings to value. According to Barnea, Haugen, and Talmo, (1987), the leverage to risk relationship is dependent upon the economy-wide pricing variables while Raymar (1991) comes across the result that optimal leverage generally decreases with business risk. The diminished future debt usage implies smaller terminal firm value (Haugen; Senbet, 1998). They further elaborate that the default acts as the deterrent to leverage in their model, and default occurs primarily due to a depressed value of the firm, Sensitivity of firm’s earnings is paramount in the determination of the debt optimum. Thus, stable (low Sensitivity of firm’s earnings) firms with high earnings risk may be highly levered. If earnings processes are heterogeneous (either as reflected by sensitivity of firm’s earnings or in a more general sense), simple earnings variability measures would not adequately capture the relation between a firm's business risk and its use of debt. The free cash flow indicators identified in literature are observed as low levels of financial leverage, inadequate valuable investment opportunities; considerable and sustainable cash flows; and high level of diversification (Jensen, 1986). While in view of Gibbs (1993) no relationship exists with investment opportunity and initial financial leverage. Management has incentives to minimize the liquidation risks of the companies. Moreover, the management may opt to avoid the corrective action of the capital market by financing unprofitable projects internally with retained earnings. This, too, has the effect of reducing leverage. Thus, we can infer that such action of management may reduce the risk of the firm by reducing leverage and so the returns as result. The author further explains that with decreasing board power, the management may tend to be stable and in a position to resist takeover. Decreasing values of leverage and investment opportunity are expected to increase likelihood of capital structure reforms due to takeover threat. The ultimate findings of the author reveal that the. Degree of operating leverage (Mandelker, G.N., and S.G. Rhee,1984) also determines the capital structure mix, as firm then exposed to industry influence at some scale and those having higher degree of operating leverage may have less debt percentage and vice versa. In an empirical study (Hatfield, Cheng, Davidson, 1994) of high debt and low debt firms belonging from the same industry, the results shown that in opposition of the perception of market decision of granting finances by comparing firm’s leverage ratio with the industry average has been proved to reverse case. Ferri; Jones (1979) has observed the relationship between leverage and size of the firm as it is a general perception that the likelihood of larger firms to be diversified is more, as they can access to the capital markets easily, may benefit from the higher credit ratings for issue of debt, and lower interest rates on external financing. It reveals’ that leverage may enhance the profit after taxes due to lower interest rates and ultimately the higher earnings may result in the higher EPS or dividend payout ratios which may increase the firm’s performance. Even if the marginal earnings as the result of lower interest rates and tax shields are retained for the company’s growth, it may maximize the company’s value in long term and may lead towards the achievement of wealth maximization objective for which the real owners invest. So, the author found the relationship between the size of the firm and leverage class. More over, the paper investigated possible linkages between a firm's financial structure and its industry class, variability in income, and operating leverage. The results of the 10
  • 5. European Journal of Business and Management www.iiste.org ISSN 2222-1905 (Paper) ISSN 2222-2839 (Online) Vol 4, No.11, 2012 study's effort to relate firm characteristics to leverage class can be summarized in this way: a) industry class is linked to a firm's leverage, but in a less pronounced and direct manner than has been previously suggested; b) variation in income, measured in several ways, could not be shown to be associated with a firm's leverage. Modigliani and Miller (1958 and 1963) support this verdict, that financial leverage and firm value have insignificant relationship while it exists only when those operate in taxable environment call for tax payments affecting capital structure. J. Fred Weston (1989) comments on MM’s propositions which state that Equilibrium in a perfect capital market requires that the market value of a firm not be changed by its financing decisions and the required return on equity will raise (linearly) with financial leverage. There is an inverse relationship among profitability change and leverage change in short run provided with the fixed dividends and investments where the dominant mode of external financing is debt. It has been observed that large firms are inclined to issue less equity. With the increase in firm size, the negative effect of profitability on leverage should be stronger but if the smaller firms are provide with investment opportunities, it may diminish correlation of profitability & leverage by larger equity issuance.(Rajan; Zingales, 1995). The authors persist to elucidate about coverage ratio that a measure of the risk that share holders will not be able to make predetermined payments and will have to surrender control i.e., the to interest expense & the ratio of earnings before interest, taxes, and depreciation (EBITDA) ratio of earnings before interest and taxes (EBIT)to interest expense. A basic issue for both measures is that they assume the rolling over of short-term liabilities including short term debt and accounts payable, which may not necessarily be true during financial distress. More over Jensen (1989) argue that the implication arising from inability to make fixed payments at high levels of debt may be different from those in low debt levels. The case of first scenario explained above is more likely to lead to liquidation while the second may lead to restructuring. Takeover pressures may force the firm to enhance leverage and the managers may increase their debts to ensure the payment of future cash flows as a result of restructuring. This, in turn, may make the firm unattractive to raiders (Zwiebel,1992). The studies indicate that if the risk of the firm is increasing by leverage, it may lead the firm towards liquidation or takeovers. We can generate a proposition out of this that the firm may need sufficient profitability to service the debts. Bernanke Campbell, and Whited (1990) observed the restructuring activity in the 1980s also had substantial impact on the cross-sectional distribution of leverage. A general perception is that Increased leverage and increased risk of the firm may increase the probability of default and so the bankruptcy costs or the costs of financial distress. Rajan; Zingales (1995) observed that the cost of financial distress are higher in the firm having high market-to-book ratios that’s why a negative correlation is expected. There may be other potential reasons for why the market-to-book ratio is negatively correlated with leverage. Fama and French (1992) recommended that there is a price of distressed risk as a high discount rate may be used for the contribution of firms with high leverag in financial distress. Mostly the firms with low market to book ratios demonstrate a negative correlation if preceding explanation is true. In fact the firms with high market to book ratio illustrate negative correlation rather than the firms with low market-to-book ratios. It is not always a chance that the scenarios mention above are caused by financial distress Rajan; Zingales (1995) Managers may opt for less leverage in order to decrease the level of firm risk to shield their under diversified human resource (Fama, 1980) or their unwillingness to embrace performance pressures related to obligation to expel huge amount of cash ( Jensen, 1986). On the other hand, Harris and Raviv (1988) and Stulz (1988) recommend that entrenchment motives may compel managers to increase leverage beyond the optimal point because they want to increase voting power of their stakes in equity and diminish the possible takeover attempts. Ii means the entrenchment motives lead to higher performance. The encouragement for limited liability stockholders to raise the risk of the firm by increasing leverage has been extensively noted (Galai and Masulis, 1976). Harris and Raviv (1991) provided that there are corresponding leverage ratios commonly accepted by the firm in a given industry whereas leverage ratios vary across industries. When the firms increase there leverage, shareholders’ bid for common shares with low market value and less dividend than the value at liquidation and fixed dividend offered on preferred stock. Thus, the net effect on the firm is to increase its fixed obligations. In our opinion, it may lead to the greater creditors’ influence and the representation in the board of directors of the company which may lead the management to take risky projects for the company to maximize the returns as returns are the function of proportionate risks. Moreover, as the common shareholder have a vote per share, so the voting rights of equity holders may decline who intent to participate in the offer (Pinegar; Lease, 1986). Furthermore the author examines that leverage change may not require to change the tax status before event that may influence the change in firm value. Specifically, announcements of preferred-for-common exchange offers lead to positive firm revaluations in almost all of the 11
  • 6. European Journal of Business and Management www.iiste.org ISSN 2222-1905 (Paper) ISSN 2222-2839 (Online) Vol 4, No.11, 2012 leverage-increasing events. When there are preference to common share exchange offers, a negative change may occur in firm value as revealed by signaling hypothesis. According to Masulis' (1983) and DeAngelo and Masulis' (1980) assumption that a firm may question and optimal level of debt that it could have may increase or diminish its value and may move push away or towards industry average. Firms efforts to work out Optimal capital structure (DeAngelo and Masulis, 1980) is determined by various agency costs bankruptcy or tax gain on losses from leverage usage ,compensating for other tax shield instruments of depletion ,depreciation, ,amortization and investments tax credits. According to Robert L. Hirsch, SAIC, (2005); the management of an oil reservoir over its multi-decade life is influenced by: 1) an operator’s other investment opportunities 2) history of production, status of the reservoir and geology 3) nature and cost of production-enhancing technologies; 4) enhancements timing ; 5) the financial condition of the operator; 6) actual and expected future oil prices 7) political and environmental circumstances, etc. Risk as an important imperative of firms operating in an industry, consistent earnings depending on the total cost affected by (Samuel H. Baker) output variability and determines financial leverage decision. Output varies due to nature of firm operating environment. Another research conducted by Hamada (1972), found the relationship of equity cost and leverage of firms across industries. More variations were observed for the firms using leverage than that preferring unlevered capital structure. A study by Hall and Leonard Weiss (1967) explained the presence of significant relationship of greater equity/debt ratio with profitability, but also an influence of reducing risk, resulting in an increased profitability is observed. According to Louis, Cheng and Davidson (1994), the market response to the debt announcements may be affected by the growth of firm. The firm with high growth rate may absorb the increased financial leverage as it may have ability to pay the incremental interest expense and visa versa. 7. RESEARCH METHODOLOGY The research to be conducted is a quantitative research involving an empirical study among different variables. The sample size consists of 20 listed public limited companies from Fuel and Energy sector listed at Karachi Stock Exchange (KSE). All companies except 20 listed public limited companies from Fuel and Energy sector listed at Karachi Stock Exchange are excluded form the study. The core data for the research will be collected by using the relevant annual reports of the companies and it would help in gaining authentic results. Balance sheet analysis of public limited companies registered on the KSE (2000-2005), statistics provided by State bank of Pakistan and data issued by DWH department will serve as guideline in measuring the financial performance of the companies by implying ration analysis as financial performance indicators. For the collection of supportive data several websites, Research Journals & articles will provide a significant guideline for studying the literature and previous studies being carried out on the relevant topics. Instruments of data entry & analysis being used imply descriptive statistics, formulas, and charts engage Microsoft Excel, software for data analysis. There is a general belief that the financial leverage affects the performance of the companies. This study will measure the relationship between financial leverage and the financial performance. To test the hypothesis, the main variables used in the study consist of a dependent variable which is financial performance of fuel and energy sector while an independent variable financial leverage in fuel and energy sector. Basically, the study aims at measuring the relationship between the two stated variables. The financial performance will be measured by employing the ten key indicators commonly used return on assets ( % ), return on equity ( % ), dividend cover ratio ( % ), dividend ratio to equity ( % ), net profit margin ( % ), earning per share before tax, earning per share after tax ( % ), sales as % of total assets ( % ), earning per share before tax growth( % ), sales growth ( % ). On the other hand the independent variable, financial leverage will engage the key leverage indicators commonly used including the gearing ratio ( % ), debt equity ratio ( % ) and debt equity ratio. The results will evaluate whether a positive relationship exists between the financial leverage and financial performance or not? 8. DATA ANALYSIS AND DISCUSSION The data analysis shows the statistical results regarding financial leverage and the financial performance. Most commonly used measure of financial leverage is calculation financial ratios, of which capital gearing ratio and debt to equity ratio are being analyzed. Gearing ratio[i] demonstrates the level of financing provided by internal financer’s fund (owner's) to external financer funds. The highly geared companies with high leverage ratio are more flexible to respond in unfavorable circumstances as they are exposed to risk of fixed payment even in downturns. High levels of equity provides a margin and can be viewed as a determined of financial strength. According to our data summarization maximum gearing ratio is 87.13% in Pakistan’s Energy sector and minimum is 0%. Firms are using 12
  • 7. European Journal of Business and Management www.iiste.org ISSN 2222-1905 (Paper) ISSN 2222-2839 (Online) Vol 4, No.11, 2012 leverage with the combination of equity. Average of is 22.10% and it’s variance from mean average is 619 points approximately, while standard deviation of 25% almost as shown in Table 1. Table 1: Statistical Analysis of Various Leverage Indicators Financial leverage Standard Among Maximum Minimum Average Variance Deviation Companies gearing ratio ( % ) 87.133 0 22.10416683 619.3020724 24.88578053 Debt equity ratio ( % ) 1392.267 0.413333333 210.59985 128981.0135 359.1392675 Debt equity ratio 13.923 0.012305 2.453972583 11.87838562 3.44650339 Debt to equity ratio measures the company's financial leverage calculated by dividing its total liabilities by stockholders' equity. It indicates what proportion of equity and debt the company is using to finance its assets. Energy sector’s maximum debt/equity ratio is 13.92%, with a minimum of 0.012% and sector average is 2.45%; showing 11 .87% variations from mean and a standard deviation of 3.446%. Table 2: Statistical Analysis of Various Performance Indicators Financial Performance of Standard Companies Maximum Minimum Average Variance Deviation Return on assets ( % ) 37.3 -4.03333333 9.908333333 106.7877632 10.33381649 Return on Equity ( % ) 83.55 -27.3666667 22.39083333 637.6461835 25.25165704 Dividend cover ratio ( % ) 658.166667 0 171.5425 22256.5739 149.186373 Dividend ratio to equity ( % ) 27 0 9.7275 56.74994956 7.533256239 Net profit margin ( % ) 58.25 -82.4666667 14.02 727.3790175 26.9699651 Earning per share before tax 61.5333333 -1.23333333 25.69 325.7340234 18.04810304 Earning per share after tax(%) 235 -18.7666667 20.105 2745.001904 52.39276576 Sales as % of total assets( % ) 626.4 10.2833333 163.2091667 34065.34522 184.5679962 Earning per share before tax growth ( % ) 120.5 -320.416667 -12.8166667 10148.31687 100.7388548 Sales growth ( % ) 204.75 -4.68333333 27.825 2022.703202 44.97447278 Table 2 shows the findings about financial performance indicators. Return on assets’[ii] maximum and minimum ratios of the industry is 37.3% and -4.03%, while industry average is 9.9.Variance of 10.33 explains the variability of earning on assets investment by using industry proposed financial leverage structure. ROE[iii] of this sector is quite high of 83.55% as maximum, while average of 2.3%, variability is 25.25% much greater when earning on equity trades off for financing decision of by using leverage or equity financing. Dividend ratio to equity Industry average is 9.7, while highest is 27%, standard deviation is 7.5 which is comparatively lesser than other performance indicators .It shows the firms sensitivity for keeping shareholders satisfied, earning good industry perception. Net profit margin[iv] analysis indicates 14.02% margin for energy sector companies showing the maximum returns of 58.25% after tax and a minimum of -82.5%. The EPS[v] before taxes for the industry reaches to the peak at 61.5% while represents a minimum of -1.2%. Earning per share before tax and after tax shows the average of approximately 25% and 20% respectively. Maximum EPS before taxes growth is -320.4% that reaches up to 120.5% maximum in the industry with a mean EPS growth of -12.58%. Sales as % of total assets show the average of 163% approximately while sales growth[vi] is 27% average for the industry with a minimum of -4.6% and touching a height at 204.75%. 13
  • 8. European Journal of Business and Management www.iiste.org ISSN 2222-1905 (Paper) ISSN 2222-2839 (Online) Vol 4, No.11, 2012 Table 3: Correlations of various Financial Performance Indicators with Leverage Ratios Debt Gearing equity Financial indicators Ratio ( % ) Debt equity ratio ( % ) ratio Return on assets ( % ) -0.524531583 -0.093848976 -0.109757491 Return on Equity ( % ) -0.489766751 0.240329538 0.221742643 Dividend cover ratio ( % ) -0.269137937 0.497179868 0.477460399 Dividend ratio to equity ( % ) -0.402391189 -0.02726646 -0.033036793 Net profit margin ( % ) -0.216375712 -0.233401722 0.174713067 Earning per share before tax -0.455429789 0.23057712 0.18052581 Earning per share before tax -0.455429789 0.23057712 0.18052581 Earning per share after tax ( % ) -0.351619287 -0.054309775 0.101362849 Sales as % of total assets ( % ) -0.411185047 0.251475029 0.193272234 Earning per share before tax growth ( % ) -0.179575772 0.26298237 0.259195851 Sales growth ( % ) 0.218433803 0.177118528 0.137645603 Table 3 depicts the relationship among various leverage indicators and the financial performance indicators. Most of the correlations between leverage and financial performance show a positive relationship among leverage and the financial performance of the companies when we compare the debt to equity ratio with most of the financial performance indicators. On the other hand, the gearing ratio shows most of the relationships negative with the leverage indicators shown in figure 5. The justification in this regard is the possibility of having preferred stock in the capital structure of some companies lying in the industry which is being the part of capital with fixed return. The gearing ratio takes into account the effect of capital with return numerator which not only accommodates the debt but also the outstanding shares of preferred stock. When the ratio is calculated by dividing the capital with fixed return to the capital with variable return (which includes equity), the gearing ratio results may differ from that of debt to equity ratio. The debt equity ratio takes into account the long term debt. Figure 2: Relationship of various performance indicators with gearing ratio (%) 14
  • 9. European Journal of Business and Management www.iiste.org ISSN 2222-1905 (Paper) ISSN 2222-2839 (Online) Vol 4, No.11, 2012 Most of the financial performance indicators except ROA and Dividend cover ratio show the positive relationship with the leverage indicators. The best possible reasoning that may support the fact is that the dividends cover ratio is not directly related to the leverage. But it is only showing the adequacy of profit available for the payments to be made on the account of dividends. The other ratio (ROA) results showing a negative correlation with leverage indicators measures the profitability over the total assets financed by total capital employed which not only takes into account the effects of debt but also the equity. The later variable in the capital employed may cause the ROA ratio to be deteriorated in case of some companies which ultimately transforms the industry averages. Figure 3: Relationship of various performance indicators with debt equity ratio The overall trend and relationship of financial performance indicators along with the leverage is still measuring a positive relationship shown in Figure 5. It proves the H1 hypothesis of the study which says that a positive relationship prevails between the leverage and financial performance and rejects the H0 hypothesis of the research. Hence, the companies lying in the fuel and energy sector in Pakistan can improve at their financial performance by opting for the optimal level of leverage for them. 9. CONCLUSION We can conclude the findings of the study by saying that the financial leverage has got a positive relationship with financial performance and the alternate hypothesis id accepted. The null hypothesis is rejected by the results of the study. Hence, the companies in the fuel and energy sector may enhance their financial performance and can play their role for the growth of the economy while improving at their optimal capital structures. Leverage may translate into profitability and value maximization of the firms in fuel and energy sector in Pakistan in long term. The fuel and energy sector industry can play an important function in the uplift of the economy by reviewing its capital structure priorities. The employment of debt in the capital structure of the companies may make a positive impact on the performance. In order to maximize the return on investment leverage may be used as “the variable” while making considerations to improve at financial health of the companies by raising their financial performance. REFERENCES Balance sheet analysis of Joint stock companies Listed on the Karachi stock exchange 2000-2005.State bank of Pakistan Statistics and DWH department, State Bank of Pakistan. 15
  • 10. European Journal of Business and Management www.iiste.org ISSN 2222-1905 (Paper) ISSN 2222-2839 (Online) Vol 4, No.11, 2012 Baker S.1973. Risk, Leverage and Profitability: An Industry Analysis. The Review of Economics and Statistics, 55(4), pp. 503-507. Barnea, A, R. Haugen; and E. Talmor. 1987. Debt and Taxes: A Multiperiod Investigation. Journal of Banking and Finance, 11, pp.79-97. Bernanke, Benjamin, John Campbell, and Toni Whited, 1990, U.S. corporate leverage: developments in 1987 and 1988. Brookings Papers on Economic Activity 1 ,pp. 255-278. “Country Analysis Brief”, Pakistan Energy Data, Statistics and Analysis - Oil, Gas, Electricity, Coal, EIA, Energy information administration, official energy statistics from U.S. Government, December 2006 DeAngelo, H., and R.W. Masulis.1980. Optimal Capital Structure under Corporate and Personal Taxation Journal of Financial Economics, (8), pp. 3-29. Fama, Eugene F.1980. Agency problems and the theory of the firm. Journal ofPolitica1 Economy 88, pp. 288-307. Fama, Eugene, and Kenneth French. 1992. The cross-section of expected returns. Journal of Finance, 46, pp. 427- 466. Ferri, M.; Jones, W. 1979 Determinants of Financial Structure: A New Methodological Approach”. The Journal of Finance, 34(3), pp. 631-644. Galai, D. and R. Masulis, 1976. The option pricing model and the risk factor of stock, Journal of Financial Economics,3, pp. 53-81. Gibbs, P. 1993. Determinants of Corporate Restructuring: The Relative Importance of Corporate Governance, Takeover Threat, and Free Cash Flow. Strategic Management Journal, 14, Special Issue: Corporate Restructuring, pp. 51-68. Hall, M., and L. Weiss, 1967. Firm Size and Profitability. Technology, Profit Risk, and Assessments of this review, 49, pp. 319-331. Hamada, R.S., 1972.The Effect of the Firm's Capital Structure on the Systematic Risk of Common Stocks. Journal of Finance, 27, pp. 435-452. Harris, Milton, and Artur Raviv,1988. Corporate control contests and capital structure. Journal of Financial Economics, 20, pp. 55-86. Harris, M., and A. Raviv, 1991. The Theory of Capital Structure. Journal of Finance, 46, pp. 297-355. Hatfield, G., Cheng, L., and Davidson, W.1994.The determination of optimal Capital structure: the effect of firm and Industry debt ratios on market value. Journal of Financial and Strategic Decision,7 (3). Haugen, R.; Senbet, L. 1988. Bankruptcy and Agency Costs: Their Significance to the Theory of Optimal Capital Structure. The Journal of Financial and Quantitative Analysis, 23(1), pp. 27-38. Jensen, M. C.1986. Agency costs of free cash flow, corporate finance, and takeovers. American Economic Review, 76, pp. 323-339. Jensen, M. 1989. The eclipse of the public corporation. Harvard Business Review, 67, 61-75. Petroleum Exploration & Production Policy-2007. Ministry of Petroleum & Natural Resources Government of Pakistan. Pinegar, M.; Lease, R. 1986.The Impact of Preferred-for-Common Exchange Offers on Firm Value. The Journal of Finance, 41(4), pp. 795-814. Rajan, R.; Zingales, L. 1995.What Do We Know about Capital Structure? Some Evidence from International Data. The Journal of Finance, 50 (5), pp. 1421-1460. Raymar, S. 1991. A Model of Capital Structure when Earnings are Mean-Reverting. The Journal of Financial and Quantitative Analysis, 26(3), pp. 327-344. Scott, J. A.1976.Theory of Optimal Capital Structure. Bell Journal of Economics and Management Science, 7, pp. 33-54. Stulz, R. 1988. Managerial control of voting rights: Financing policies and the market for corporate control. Journal of Financial Economics, 20, pp. 25-54. Modigliani, F., and Miller, M.H. 1958.The Cost of Capital, Corporate Finance and the Theory of Investment," American Economic Review, 48, pp. 261-296. 16
  • 11. European Journal of Business and Management www.iiste.org ISSN 2222-1905 (Paper) ISSN 2222-2839 (Online) Vol 4, No.11, 2012 Modigliani, F., and Miller, M.H. 1963.Taxes and the Cost of Capital: A Correction. American Economic Review, 53, pp. 433-443. Mandelker, G.N., and Rhee, S.G., 1984.The Impact of the Degrees of Operating and Financial Leverage on Systematic Risk of Common Stock. Journal of Financial and Quantitative Analysis, 19, pp. 45-57. Weston, F. 1989.What MM Have Wrought. Financial Management, 18, (2), pp. 29-38. Zwiebel, J. 1992, Dynamic capital structure under managerial entrenchment. Working paper, Stanford University. APPENDIX Exhibit : Energy Overview Recoverable Coal Reserves (2003) 3,362 million short tons Total Per Capita Energy Consumption 12.4 million Btus (2003) Natural Gas Consumption (2004) 967.6 billion cubic feet Coal Production (2004) 3.5 million short tons Coal Consumption (2004) 5.2 million short tons Electricity Installed Capacity (2004) 20.4 gigawatts Electricity Production (2004) 80.2 billion kilowatt hours Electricity Consumption (2004) 74.6 billion kilowatt hours Total Energy Consumption (2004) 2 quadrillion Btus*, of which Natural Gas (46%), Oil (35%), Hydroelectricity (14%), Coal (5%), Nuclear (1%), Other Renewables (0%) Energy Intensity (2004) 5,086.7 Btu per $2000-PPP Oil Production (2006) 59.4 thousand Barrels per day, of which 97% was crude oil. Oil Consumption (2006) 350 thousand barrels per day Crude Oil Distillation Capacity (2006) 269 thousand barrels per day Proven Natural Gas Reserves (January 1, 28.2 trillion cubic feet 2006) Source: “Country Analysis Brief”, Energy Data, Statistics and Analysis - Oil, Gas, Electricity, Coal conducted by EIA (Energy information administration), December 2006. [i] Capital Gearing Ratio= Capital with Fixed Return *100/ Equity Debt to Equity Ratio=Total Liabilities *100/ Shareholder’s Equity [ii] Return on assets= ROA= (100 x Net Profit After Tax/ Total Assets ) [iii] Return on Equity = (100 x Net Profit After Tax/ Equity (Common Stock) [iv] Net profit margin= (100 x Net Profit After Tax/ Net Sales) [v] EPS=Earning per share [vi] Sales growth (current year's 'sales - last year's sales / last year's sales) 17
  • 12. This academic article was published by The International Institute for Science, Technology and Education (IISTE). The IISTE is a pioneer in the Open Access Publishing service based in the U.S. and Europe. The aim of the institute is Accelerating Global Knowledge Sharing. More information about the publisher can be found in the IISTE’s homepage: http://www.iiste.org The IISTE is currently hosting more than 30 peer-reviewed academic journals and collaborating with academic institutions around the world. Prospective authors of IISTE journals can find the submission instruction on the following page: http://www.iiste.org/Journals/ The IISTE editorial team promises to the review and publish all the qualified submissions in a fast manner. All the journals articles are available online to the readers all over the world without financial, legal, or technical barriers other than those inseparable from gaining access to the internet itself. Printed version of the journals is also available upon request of readers and authors. IISTE Knowledge Sharing Partners EBSCO, Index Copernicus, Ulrich's Periodicals Directory, JournalTOCS, PKP Open Archives Harvester, Bielefeld Academic Search Engine, Elektronische Zeitschriftenbibliothek EZB, Open J-Gate, OCLC WorldCat, Universe Digtial Library , NewJour, Google Scholar