
Recommandé
Contenu connexe
Tendances
Tendances (20)
Similaire à Lec # 5, cardiovascular system
Similaire à Lec # 5, cardiovascular system (20)
Lec # 5, cardiovascular system
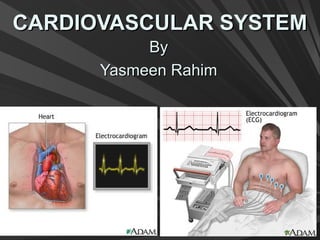
- 1. CARDIOVASCULAR SYSTEMCARDIOVASCULAR SYSTEM ByBy Yasmeen RahimYasmeen Rahim
- 2. OBJECTIVESOBJECTIVES By the end of this presentation, learners will beBy the end of this presentation, learners will be able to:able to: Review anatomy and physiology of heart.Review anatomy and physiology of heart. Define ECG and list indications for ECG.Define ECG and list indications for ECG. Identify different kinds of arrhythmias.Identify different kinds of arrhythmias. Discuss different kinds of heart blocks.Discuss different kinds of heart blocks. Describe the nursing care for patient in blocks.Describe the nursing care for patient in blocks. Discuss types and care for client withDiscuss types and care for client with temporary and permanent pacemakers.temporary and permanent pacemakers.
- 4. HEARTHEART Heart is a hollow muscular organ, locatedHeart is a hollow muscular organ, located in mediastinum.in mediastinum. It lies with the lungs on the either side andIt lies with the lungs on the either side and the diaphragm below.the diaphragm below. The base of heart lies parallel with theThe base of heart lies parallel with the edge of sternum.edge of sternum. The apex of the heart is at theThe apex of the heart is at the midclavicular line at the 5midclavicular line at the 5thth intercoastalintercoastal space.space.
- 5. CONT.CONT. Heart size varies according to person’sHeart size varies according to person’s body size (closed fist).body size (closed fist). The organ is roughly about 12 cm longThe organ is roughly about 12 cm long and 9 cm wide.and 9 cm wide. The heart is enclosed by a thick doubleThe heart is enclosed by a thick double wall sac called pericardium.wall sac called pericardium. Pericardium is composed of three layers;Pericardium is composed of three layers; epicardium, myocardium and endocardium.epicardium, myocardium and endocardium.
- 6. LAYERS OF HEARTLAYERS OF HEART EPICARDIUM:EPICARDIUM: the outermost layer ofthe outermost layer of heart, composed of a serous membrane.heart, composed of a serous membrane. MYOCARDIUM:MYOCARDIUM: it makes up the largestit makes up the largest portion of the heart’s wall. This layer ofportion of the heart’s wall. This layer of muscle tissue contracts with each beat.muscle tissue contracts with each beat. ENDOCARDIUM:ENDOCARDIUM: the innermost layer ofthe innermost layer of the heart wall composed of endothelialthe heart wall composed of endothelial cells that lines the heart chamber andcells that lines the heart chamber and valves.valves.
- 8. CHAMBERS OF HEARTCHAMBERS OF HEART The heart is divided into four chambers:The heart is divided into four chambers: Right atriumRight atrium Right ventricleRight ventricle Left atriumLeft atrium Right atriumRight atrium
- 9. VALVESVALVES Heart has four valves:Heart has four valves: – Tricuspid valveTricuspid valve – Bicuspid valveBicuspid valve – Pulmonic valvePulmonic valve – Aortic valveAortic valve Valves close and open in response toValves close and open in response to change in pressure within the chamber.change in pressure within the chamber. They serve as one way door in order toThey serve as one way door in order to prevent regurgitation of blood from oneprevent regurgitation of blood from one chamber to another.chamber to another.
- 14. Cont…Cont… Coronary arteries originate from aorta,Coronary arteries originate from aorta, immediately above aortic valveimmediately above aortic valve 2 main branches: Right and Left coronary2 main branches: Right and Left coronary arteryartery LCA has 2 major branches: Left anteriorLCA has 2 major branches: Left anterior descending (LAD) and Left circumflexdescending (LAD) and Left circumflex artery (LCA)artery (LCA)
- 16. CARDIAC CONDUCTIONCARDIAC CONDUCTION Sinoatrial (SA) node – Fires at 60–100Sinoatrial (SA) node – Fires at 60–100 beats/minutebeats/minute Intranodal pathwayIntranodal pathway Atrioventricular (AV) node – Fires at 40-60Atrioventricular (AV) node – Fires at 40-60 beats/minutebeats/minute Atrioventricular bundle of HisAtrioventricular bundle of His – Ventricular tissue fires at 20-40 beats/minuteVentricular tissue fires at 20-40 beats/minute and can occur at this point and downand can occur at this point and down Right and left bundle branchesRight and left bundle branches Purkinje fibersPurkinje fibers
- 18. ELECTROCARDIOGRAMELECTROCARDIOGRAM ConductionConduction of an actionof an action potentialpotential through thethrough the heart canheart can be shownbe shown by anby an electrocardielectrocardi ogramogram (ECG).(ECG).
- 19. CARDIAC CYCLECARDIAC CYCLE SystoleSystole == period ofperiod of ventricularventricular contraction.contraction. DiastoleDiastole == period ofperiod of ventricularventricular relaxation.relaxation.
- 20. CARDIAC CYCLECARDIAC CYCLE Contraction of the myocardium generatesContraction of the myocardium generates pressure changes which result in thepressure changes which result in the orderly movement of blood.orderly movement of blood. Blood flows from an area ofBlood flows from an area of highhigh pressurepressure to an area ofto an area of low pressurelow pressure,, unless flow is blocked by a valve.unless flow is blocked by a valve. Events on the right and left sides of theEvents on the right and left sides of the heart are the same, but pressures areheart are the same, but pressures are lower on the right side of the heart.lower on the right side of the heart.
- 21. ATRIAL SYSTOLEATRIAL SYSTOLE The heart is full of blood and the ventriclesThe heart is full of blood and the ventricles are relaxed and are about ¾ full.are relaxed and are about ¾ full. Both the atria contract and 30% bloodBoth the atria contract and 30% blood passes down to the ventricles (atrial kick)passes down to the ventricles (atrial kick) The atrio-ventricular valves open due toThe atrio-ventricular valves open due to blood pressure.blood pressure. 70% of the blood flows70% of the blood flows passivelypassively down todown to the ventricles as a result of pressurethe ventricles as a result of pressure difference b/w atrias and ventriclesdifference b/w atrias and ventricles
- 23. VENTRICULAR SYSTOLEVENTRICULAR SYSTOLE The first part of ventricular systole is known asThe first part of ventricular systole is known as isovolumetric contraction period.isovolumetric contraction period. It begins with the closure of AV valve (lub sound).It begins with the closure of AV valve (lub sound). In additional 0.02 to 0.03 sec semilunar valvesIn additional 0.02 to 0.03 sec semilunar valves remain closed.remain closed. During this period volume remain same but theDuring this period volume remain same but the ventricles are contracting (ventricles are contracting (↑↑pressure)pressure) The atrias are relax.The atrias are relax. IVC is an interval between the closing of the AVIVC is an interval between the closing of the AV valves and the opening of the semilunar valvesvalves and the opening of the semilunar valves (aortic and pulmonary valves).(aortic and pulmonary valves).
- 25. VENTRICULAR SYSTOLEVENTRICULAR SYSTOLE Second phase of ventricular systole isSecond phase of ventricular systole is known as ejection phase.known as ejection phase. The increase pressure of blood in theThe increase pressure of blood in the ventricles opens the semi-lunar valves.ventricles opens the semi-lunar valves. Blood passes into the aorta andBlood passes into the aorta and pulmonary arteries due to pressurepulmonary arteries due to pressure difference.difference.
- 27. VENTRICULAR DIASTOLEVENTRICULAR DIASTOLE This phase is known as isovolumetricThis phase is known as isovolumetric relaxation phase.relaxation phase. Pressure in the ventricles falls below that inPressure in the ventricles falls below that in the arteriesthe arteries Blood under high pressure in the arteriesBlood under high pressure in the arteries causes the semi lunar valves to shut.causes the semi lunar valves to shut. This produces the second heart sound, ‘dub’.This produces the second heart sound, ‘dub’. During diastole, all the muscle in the heartDuring diastole, all the muscle in the heart relaxes for 0.03 to 0.06 secs.relaxes for 0.03 to 0.06 secs.
- 29. VENTRICULAR DIASTOLEVENTRICULAR DIASTOLE This phase is marked by ventricular filling.This phase is marked by ventricular filling. When pressure in ventricles become lessWhen pressure in ventricles become less than atria, AV valves open and blood flowsthan atria, AV valves open and blood flows into ventricles.into ventricles. This is known as rapid filling period.This is known as rapid filling period. Ventricular blood volume at the end ofVentricular blood volume at the end of diastole is 120 ml (EDV) and ESV is 50diastole is 120 ml (EDV) and ESV is 50 ml.ml. Atria contract in the later half of thisAtria contract in the later half of this phase.
- 33. FUNCTIONARY TERMSFUNCTIONARY TERMS Automaticity:Automaticity: the ability of specialized cells inthe ability of specialized cells in the heart known as pacemaker cells tothe heart known as pacemaker cells to spontaneously generate an action potential,spontaneously generate an action potential, thus causing depolarization.thus causing depolarization. Conductivity:Conductivity: the ability of cardiac cells tothe ability of cardiac cells to conduct action potentials, thus transmitting theconduct action potentials, thus transmitting the electrical signal from one cell to another.electrical signal from one cell to another. Contractility:Contractility: the ability of cardiac muscle tothe ability of cardiac muscle to shorten in response to depolarization.shorten in response to depolarization.
- 34. Cont..Cont.. Excitability:Excitability: the ability of cardiac tissue tothe ability of cardiac tissue to respond to a stimulus and generate an actionrespond to a stimulus and generate an action potential.potential. Rhythmicity:Rhythmicity: the ability of cardiac cells tothe ability of cardiac cells to spontaneously generate an action potentialspontaneously generate an action potential at a regular rate.at a regular rate. STROKE VOLUMESTROKE VOLUME is the amount of bloodis the amount of blood ejected per ventricular contraction.ejected per ventricular contraction. Normal value is 60 – 100 ml / beat.Normal value is 60 – 100 ml / beat. Stroke volume = EDV - ESVStroke volume = EDV - ESV
- 35. Cont..Cont.. CARDIAC OUTPUTCARDIAC OUTPUT is the amount of bloodis the amount of blood ejected from left ventricle (in liters) in eachejected from left ventricle (in liters) in each minute.minute. Cardiac output = Heart rateCardiac output = Heart rate ×× Stroke volume.Stroke volume. Normal CO for an adult ranges from 4 – 8Normal CO for an adult ranges from 4 – 8 L/minL/min CARDIAC INDEXCARDIAC INDEX is cardiac output per squareis cardiac output per square meter of body surface area.meter of body surface area. Ranges from 2.8 – 4.2 L/minute/mRanges from 2.8 – 4.2 L/minute/m2.2. CI = CO / body surface areaCI = CO / body surface area
- 36. HEART RATEHEART RATE Heart rateHeart rate determinesdetermines the frequencythe frequency with which thewith which the blood isblood is ejected fromejected from heart.heart. Therefore ifTherefore if HR increasesHR increases then CO willthen CO will increase andincrease and vice versa.vice versa.
- 37. REGULATION OF HRREGULATION OF HR Heart rate is under autonomic and adrenalHeart rate is under autonomic and adrenal catecholamine influence.catecholamine influence. Sympathetic NS (norepinephrine increasesSympathetic NS (norepinephrine increases depolarization rate)depolarization rate) Parasympathetic NS (acetylcholine decreaseParasympathetic NS (acetylcholine decrease rate of depolarization)rate of depolarization) Adrenal medulla secretes epinephrine andAdrenal medulla secretes epinephrine and norepinephrine (act on heart same way asnorepinephrine (act on heart same way as SNS)SNS)
- 38. REGULATION OF STROKEREGULATION OF STROKE VOLUMEVOLUME Factors involved in regulation of strokeFactors involved in regulation of stroke volume are:volume are: PreloadPreload AfterloadAfterload ContractilityContractility
- 39. PRELOADPRELOAD Preload is aPreload is a passive stretching forcepassive stretching force exertedexerted on the ventricular muscle at the end of diastoleon the ventricular muscle at the end of diastole or just before systoleor just before systole It is work imposed on heart before contractionIt is work imposed on heart before contraction begins.begins. Preload is caused by the volume of blood inPreload is caused by the volume of blood in the ventricle at the end of diastole.the ventricle at the end of diastole. It is determined by venous return and stretchIt is determined by venous return and stretch of muscle fibre.of muscle fibre.
- 40. FRANK STARLING’S LAWFRANK STARLING’S LAW Force of myocardial contraction is determinedForce of myocardial contraction is determined by the length of muscle cell fibersby the length of muscle cell fibers Increasing myocardial stretch increases theIncreasing myocardial stretch increases the force of systoleforce of systole Amount of blood entering right atrium (CVP)Amount of blood entering right atrium (CVP) Right heart preload decrease when personRight heart preload decrease when person holds breath and bear down and vice versaholds breath and bear down and vice versa
- 42. AFTERLOADAFTERLOAD Afterload is the force or pressure againstAfterload is the force or pressure against which a cardiac chamber must eject bloodwhich a cardiac chamber must eject blood during systoleduring systole The most critical factor determiningThe most critical factor determining afterload is vascular resistance : systemicafterload is vascular resistance : systemic vascular resistance (LV) and pulmonaryvascular resistance (LV) and pulmonary vascular resistancevascular resistance (RV).(RV). Decrease SVR will increase SV and viceDecrease SVR will increase SV and vice versa.versa. Afterload increases in stenosis of aorticAfterload increases in stenosis of aortic valve.valve.
- 45. CONTRACTILITYCONTRACTILITY Contractility refers to the ability of cardiacContractility refers to the ability of cardiac muscle fibers to shorten when stimulatedmuscle fibers to shorten when stimulated and is considered to be independent ofand is considered to be independent of preload and afterload.preload and afterload. It is strongly influenced by number ofIt is strongly influenced by number of calcium ions that are available tocalcium ions that are available to participate in the contractile process (actinparticipate in the contractile process (actin myosin filament interaction)myosin filament interaction)
- 47. PATIENT ASSESSMENTPATIENT ASSESSMENT CARDIOVASCULAR SYSTEMCARDIOVASCULAR SYSTEM
- 48. HISTORY OF PRESENT ILLNESSHISTORY OF PRESENT ILLNESS Symptoms analysis: normal baseline, onset, Precipitating andSymptoms analysis: normal baseline, onset, Precipitating and palliative factors, quantity and quality, region and radiation,palliative factors, quantity and quality, region and radiation, severity and time.severity and time. Chest painChest pain Nausea and/or vomitingNausea and/or vomiting DyspneaDyspnea EdemaEdema PalpitationsPalpitations Syncope/dizzinessSyncope/dizziness Cough and hemoptysisCough and hemoptysis CyanosisCyanosis Extremity pain or paresthesiasExtremity pain or paresthesias FatigueFatigue OrthopneaOrthopnea Past medical historyPast medical history MedicationsMedications Risk factors (age, diet, smoking, sedentary life style etc)Risk factors (age, diet, smoking, sedentary life style etc)
- 49. PHYSICAL EXAMPHYSICAL EXAM InspectionInspection – General appearanceGeneral appearance – Jugular venousJugular venous distension (JVD)distension (JVD) – SkinSkin – ExtremitiesExtremities PalpationPalpation – PulsesPulses PercussionPercussion AuscultationAuscultation – Good stethoscopeGood stethoscope – PositioningPositioning – Normal tones – SNormal tones – S11/S/S22 – MurmursMurmurs
- 50. MURMURSMURMURS TimingTiming LocationLocation TransmissionTransmission PitchPitch QualityQuality IntensityIntensity Grade 1 – Barely audibleGrade 1 – Barely audible Grade 2 – Clearly audibleGrade 2 – Clearly audible Grade 3 – ModeratelyGrade 3 – Moderately loudloud Grade 4 – Loud with aGrade 4 – Loud with a thrillthrill Grade 5 – Very loud withGrade 5 – Very loud with an easily palpable thrillan easily palpable thrill Grade 6 – Very loud, noGrade 6 – Very loud, no stethoscope needed,stethoscope needed, palpable and visible thrillpalpable and visible thrill
- 52. IMPORTANT CARDIAC LABSIMPORTANT CARDIAC LABS Coagulation studies – PTT, APTT and PT/INR,Coagulation studies – PTT, APTT and PT/INR, platelet, fibrinogen level etc.platelet, fibrinogen level etc. Electrolytes – Potassium, magnesium, and calcium.Electrolytes – Potassium, magnesium, and calcium. Lipid studies – Cholesterol, LDL, HDL, triglycerides.Lipid studies – Cholesterol, LDL, HDL, triglycerides. Enzymes – CK-MM, CK-MB, CK-BB, Troponin.Enzymes – CK-MM, CK-MB, CK-BB, Troponin. Hematological studies – RBC, HB, HCT, WBC, ESRHematological studies – RBC, HB, HCT, WBC, ESR Blood chemistry – electrolytes, ABGs, BUN, Cr,Blood chemistry – electrolytes, ABGs, BUN, Cr, proteins etc.proteins etc. CRP, D- dimerCRP, D- dimer
- 53. DIAGNOSTIC STUDIESDIAGNOSTIC STUDIES Standard 12 lead Electrocardiogram.Standard 12 lead Electrocardiogram. Continuous cardiac monitoringContinuous cardiac monitoring Electrophysiology studies (Holter monitoring)Electrophysiology studies (Holter monitoring) Chest radiographyChest radiography EchocardiographyEchocardiography TransesophagealTransesophageal EchocardiographyEchocardiography Exercise stress testingExercise stress testing CT scanningCT scanning MRIMRI Cardiac catheterizationCardiac catheterization Coronary angiographyCoronary angiography
- 54. 12 LEAD12 LEAD ELECTROCARDIOGRAM (ECG)ELECTROCARDIOGRAM (ECG) The electrocardiogram is a graphic record ofThe electrocardiogram is a graphic record of the direction and magnitude of the electricalthe direction and magnitude of the electrical activity that is generated by the depolarizationactivity that is generated by the depolarization and repolarization of the atria and ventricles.and repolarization of the atria and ventricles. The electrocardiogram (ECG) is aThe electrocardiogram (ECG) is a representation of the electrical events of therepresentation of the electrical events of the cardiac cycle.cardiac cycle. Each event has a distinctive waveform, theEach event has a distinctive waveform, the study of which can lead to greater insight into astudy of which can lead to greater insight into a patient’s cardiac pathophysiology.patient’s cardiac pathophysiology.
- 55. Cont.Cont. P wave of ECG represents depolarizationP wave of ECG represents depolarization of SA nodeof SA node QRS complex represents depolarization ofQRS complex represents depolarization of ventricular conduction systemventricular conduction system T wave occur during the last half of systoleT wave occur during the last half of systole and represents repolarization of theand represents repolarization of the ventriclesventricles
- 57. CHEST LEADSCHEST LEADS V1:V1: fourth intercostal space, right of thefourth intercostal space, right of the sternum.sternum. V2:V2: fourth intercostal space to the left of thefourth intercostal space to the left of the sternum.sternum. V3:V3: Between leads V2 and V4Between leads V2 and V4 V4:V4: fifth intercostal space in the mid-clavicularfifth intercostal space in the mid-clavicular lineline V5:V5: horizontally even with V4, but in thehorizontally even with V4, but in the anterior axillary line.anterior axillary line. V6:V6: horizontally even with V4 and V5 in thehorizontally even with V4 and V5 in the midaxillary line.midaxillary line.
- 58. LIMB LEADSLIMB LEADS RA:RA: on the right arm.on the right arm. LA:LA: on the left arm.on the left arm. RL:RL: on the right leg. (ground lead or earth lead)on the right leg. (ground lead or earth lead) LL:LL: on the left leg.on the left leg. Lead I is the voltage between the left arm (LA)Lead I is the voltage between the left arm (LA) electrode and right arm (RA) electrode.electrode and right arm (RA) electrode. Lead II is the voltage between the left leg (LL)Lead II is the voltage between the left leg (LL) electrode and the right arm (RA) electrode.electrode and the right arm (RA) electrode. Lead III is the voltage between the left leg (LL)Lead III is the voltage between the left leg (LL) electrode and the left arm (LA) electrode.electrode and the left arm (LA) electrode.
- 60. AUGMENTED LEADSAUGMENTED LEADS LeadLead augmented vector right (aVR)augmented vector right (aVR) has thehas the positive electrode on the right arm. The negativepositive electrode on the right arm. The negative electrode is a combination of the left armelectrode is a combination of the left arm electrode and the left leg electrode.electrode and the left leg electrode. LeadLead augmented vector left (aVL)augmented vector left (aVL) has thehas the positive electrode on the left arm. The negativepositive electrode on the left arm. The negative electrode is a combination of the right armelectrode is a combination of the right arm electrode and the left leg electrode.electrode and the left leg electrode. LeadLead augmented vector foot (aVF)augmented vector foot (aVF) has thehas the positive electrode on the left leg. The negativepositive electrode on the left leg. The negative electrode is a combination of the right armelectrode is a combination of the right arm electrode and the left arm electrode.electrode and the left arm electrode.
- 61. CONT.CONT. Each lead has both a positive and aEach lead has both a positive and a negative pole.negative pole. When electrical current travel alongWhen electrical current travel along towards a positive pole, waveform is antowards a positive pole, waveform is an upward deflection.upward deflection. When current travels toward a negativeWhen current travels toward a negative pole, deflection is downward.pole, deflection is downward.
- 63. ECG PAPERECG PAPER The measurement of time is calculatedThe measurement of time is calculated along the horizontal lines in seconds.along the horizontal lines in seconds. – Each small square = 0.04 secEach small square = 0.04 sec – Each large square = 0.20 secEach large square = 0.20 sec – 5 large boxes = 1 sec5 large boxes = 1 sec Measurement of energy (voltage orMeasurement of energy (voltage or amplitude) is represented along theamplitude) is represented along the vertical lines in millivolts or millimeters.vertical lines in millivolts or millimeters. – Each small square = 0.1 mV or 1 mmEach small square = 0.1 mV or 1 mm – Each large square = 0.5 mV or 5 mmEach large square = 0.5 mV or 5 mm
- 65. What types of pathology can weWhat types of pathology can we identify and study from EKGs?identify and study from EKGs? ArrhythmiasArrhythmias Myocardial ischemia and infarctionMyocardial ischemia and infarction PericarditisPericarditis Chamber hypertrophyChamber hypertrophy Electrolyte disturbances (i.e.Electrolyte disturbances (i.e. hyperkalemia, hypokalemia)hyperkalemia, hypokalemia) Drug toxicity (i.e. digoxin and drugs whichDrug toxicity (i.e. digoxin and drugs which prolong the QT interval)prolong the QT interval)
- 66. ECG WAVEFORMSECG WAVEFORMS The baseline is also known as theThe baseline is also known as the isoelectric line.isoelectric line. The heart’s electrical activity producesThe heart’s electrical activity produces several waveforms.several waveforms. The waveforms are:The waveforms are: – P waveP wave – QRS complexQRS complex – T waveT wave
- 68. P WAVEP WAVE Measured from the beginning of the PMeasured from the beginning of the P wave to the end of P wave.wave to the end of P wave. It represents Atrial depolarization.It represents Atrial depolarization. Normal P wave precedes a QRS complex.Normal P wave precedes a QRS complex. To evaluate P wave look for threeTo evaluate P wave look for three characteristics:characteristics: – LocationLocation – ConfigurationConfiguration – DeflectionDeflection
- 69. CONT.CONT. If all of the P waves do not look alike thenIf all of the P waves do not look alike then the impulse may be coming in the atriathe impulse may be coming in the atria and not the SA node.and not the SA node. If pacemaker site is in the atria, P wavesIf pacemaker site is in the atria, P waves are upright (positive deflection).are upright (positive deflection). If it’s at AV junction, they may be invertedIf it’s at AV junction, they may be inverted in lead II.in lead II. It is normally 2.5mm or less in height andIt is normally 2.5mm or less in height and 0.11 sec or less in duration.0.11 sec or less in duration.
- 70. QRS COMPLEXQRS COMPLEX Q wave:Q wave: is the firstis the first negative deflectionnegative deflection following the P wave.following the P wave. R wave:R wave: the firstthe first positive deflectionpositive deflection extending above baseline following the Pextending above baseline following the P wave and Q wave.wave and Q wave. S wave:S wave: is the firstis the first negative deflectionnegative deflection extending below baseline following the Rextending below baseline following the R wave.wave.
- 72. CONT.CONT. QRS complex represents the ventricularQRS complex represents the ventricular depolarization (ventricular systole).depolarization (ventricular systole). Normal duration of QRS complex is 0.04Normal duration of QRS complex is 0.04 to 0.12 seconds.to 0.12 seconds. It is measured from the beginning of the QIt is measured from the beginning of the Q wave (where it begins to deviate from thewave (where it begins to deviate from the baseline) to the end of the S wave (wherebaseline) to the end of the S wave (where the S wave returns to the isoelectric line).the S wave returns to the isoelectric line).
- 73. T WAVET WAVE T wave represents ventricularT wave represents ventricular repolarization (ventricular diastole).repolarization (ventricular diastole). The end of the T wave is the point where itThe end of the T wave is the point where it returns to the isoelectric line.returns to the isoelectric line. T wave always follows the QRS complex.T wave always follows the QRS complex. Normal T wave is positive and upright.Normal T wave is positive and upright. Its normal value is .10 sec to 0.25 sec.Its normal value is .10 sec to 0.25 sec. Inverted or negative deflecting T wavesInverted or negative deflecting T waves are suggestive of myocardial ischemia orare suggestive of myocardial ischemia or ventricular conduction delay.ventricular conduction delay.
- 74. CONT.CONT. Peaked, tall T waves usually indicatePeaked, tall T waves usually indicate Hyperkalemia.Hyperkalemia.
- 75. U WAVEU WAVE The U wave is the first gradual or abrupt slopeThe U wave is the first gradual or abrupt slope after the end of the T wave.after the end of the T wave. It probably represents the final stage ofIt probably represents the final stage of repolarization of the ventricles.repolarization of the ventricles. U wave are rounded and symmetrical.U wave are rounded and symmetrical. U waves are measured from the beginning ofU waves are measured from the beginning of the U wave to the end of the U wave.the U wave to the end of the U wave. Prominent U waves may indicate hypokalemiaProminent U waves may indicate hypokalemia and also the effect of an excessive amount ofand also the effect of an excessive amount of digoxin in conduction system.digoxin in conduction system.
- 77. P-R INTERVALP-R INTERVAL P-R interval represents the interval of timeP-R interval represents the interval of time between atrial depolarization andbetween atrial depolarization and ventricular depolarization.ventricular depolarization. A normal P-R interval indicates that theA normal P-R interval indicates that the electrical impulse is being conducted andelectrical impulse is being conducted and travels through the atria, AV node, AVtravels through the atria, AV node, AV junction, bundle of His, bundle branchesjunction, bundle of His, bundle branches and Purkinje fibers.and Purkinje fibers.
- 78. CONT.CONT. The P-R interval is measured from theThe P-R interval is measured from the beginning of the P wave to the beginningbeginning of the P wave to the beginning of the QRS complex.of the QRS complex. Normal duration of P-R interval is 0.12 toNormal duration of P-R interval is 0.12 to 0.20 seconds.0.20 seconds.
- 80. QRS COMPLEXQRS COMPLEX It is a large waveform representingIt is a large waveform representing ventricular depolarization.ventricular depolarization. Not all QRS complex has all threeNot all QRS complex has all three componentscomponents Measured from the starting of Q wave tillMeasured from the starting of Q wave till end of S waveend of S wave Normal QRS complex is 0.06 to 0.11Normal QRS complex is 0.06 to 0.11 seconds.seconds.
- 82. ST SEGMENTST SEGMENT The ST segment marks the beginning ofThe ST segment marks the beginning of the ventricular repolarization.the ventricular repolarization. The ST segment extends from the end ofThe ST segment extends from the end of the QRS complex to the beginning of the Tthe QRS complex to the beginning of the T wave.wave. A normal ST segment is flat on theA normal ST segment is flat on the isoelectric line or baseline.isoelectric line or baseline. Elevated or depressed more than 1mm ofElevated or depressed more than 1mm of ST segment may be indicative of an MI.ST segment may be indicative of an MI.
- 84. ST SEGMENTST SEGMENT DEPRESSION ELEVATIONDEPRESSION ELEVATION
- 85. QT INTERVALQT INTERVAL The QT interval represents the length of timeThe QT interval represents the length of time for both ventricular depolarization andfor both ventricular depolarization and repolarization.repolarization. It is measured from the beginning of the QIt is measured from the beginning of the Q wave to the end of the T wave on the isoelectricwave to the end of the T wave on the isoelectric line.line. Its normal value is 0.32 to 0.43 sec.Its normal value is 0.32 to 0.43 sec. A short QT interval may indicate aA short QT interval may indicate a hypercalcemia in patients taking digitalis.hypercalcemia in patients taking digitalis. A prolong QT interval is caused byA prolong QT interval is caused by antiarrhythmatics or may indicateantiarrhythmatics or may indicate HypocalcemiaHypocalcemia
- 86. NORMAL QT INTERVALNORMAL QT INTERVAL
- 87. PROLONG QT INTERVALPROLONG QT INTERVAL
- 90. STEPS TO READING ECGSTEPS TO READING ECG Is theIs the RhythmRhythm regular or irregular?regular or irregular? What is theWhat is the RateRate? Both atrial and ventricle.? Both atrial and ventricle. Do theDo the P wavesP waves all look the same? Is thereall look the same? Is there a P wave for every QRS and conversely aa P wave for every QRS and conversely a QRS complexQRS complex for every P wave?for every P wave? Are all the complexes withinAre all the complexes within Normal TimeNormal Time LimitsLimits? (PR interval, QRS complex and ST? (PR interval, QRS complex and ST segment)segment) IdentifyIdentify the rhythm and any abnormalities.the rhythm and any abnormalities.
- 92. RATERATE 6 SECOND METHOD:6 SECOND METHOD: It is performed only if the rhythm is regular.It is performed only if the rhythm is regular. Identify a 6 second strip.Identify a 6 second strip. Locate 3 second markers (30 large boxes).Locate 3 second markers (30 large boxes). Count complete QRS complex in a 6-secondCount complete QRS complex in a 6-second strip and multiply it by 10.strip and multiply it by 10. This gives you an approximate number ofThis gives you an approximate number of beats per minutes.beats per minutes.
- 94. CONT.CONT. THE SEQUENCE METHOD:THE SEQUENCE METHOD: Locate an R wave on a dark black line of aLocate an R wave on a dark black line of a large box.large box. Label the consecutive heavy black lines asLabel the consecutive heavy black lines as follows: 300, 150, 100, 75, 60 and 50.follows: 300, 150, 100, 75, 60 and 50. If next R wave falls in between two heavyIf next R wave falls in between two heavy black lines for e.g. between 70 and 60black lines for e.g. between 70 and 60 then the heart rate would be 65.then the heart rate would be 65.
- 96. # Of Big# Of Big BoxesBoxes RateRate 11 300300 22 150150 33 100100 44 7575 55 6060 66 5050
- 98. NORMAL INTERVAL TIMINGNORMAL INTERVAL TIMING PR interval – 0.12 to 0.20 secondsPR interval – 0.12 to 0.20 seconds QRS interval – less then 0.12QRS interval – less then 0.12 QT interval – varies with rate.QT interval – varies with rate.
- 99. DETERMINATION OF CARDIACDETERMINATION OF CARDIAC RHYTHMRHYTHM Correct determination of cardiac rhythmCorrect determination of cardiac rhythm requires a systematic evaluation of ECG.requires a systematic evaluation of ECG. Following steps are used to determineFollowing steps are used to determine cardiac rhythm:cardiac rhythm: – Calculate the atrial rate (P wave)Calculate the atrial rate (P wave) – Calculate ventricular rate (QRS complex)Calculate ventricular rate (QRS complex) – Determine regularity and shape of P waveDetermine regularity and shape of P wave – Determine regularity, shape and width of QRSDetermine regularity, shape and width of QRS – Measure the PR intervalMeasure the PR interval – Interpret the arrhythmiaInterpret the arrhythmia
- 100. COMMON ARRHYTHMIASCOMMON ARRHYTHMIAS Arrhythmias originating in the sinus node.Arrhythmias originating in the sinus node. Arrhythmias originating in the atria.Arrhythmias originating in the atria. Arrhythmias originating in the junction.Arrhythmias originating in the junction. Arrhythmias originating in the ventricles.Arrhythmias originating in the ventricles. Atrioventricular BlocksAtrioventricular Blocks
- 101. NORMAL SINUS RHYTHMNORMAL SINUS RHYTHM Normal sinus rhythm record an impulse that start inNormal sinus rhythm record an impulse that start in the sinus node and progresses to the ventriclesthe sinus node and progresses to the ventricles through a normal conduction pathway.through a normal conduction pathway. Atrial and ventricular rhythms: regularAtrial and ventricular rhythms: regular Atrial and ventricular rates: 60 – 100 bpmAtrial and ventricular rates: 60 – 100 bpm P waves: rounded, smooth, upright and precedingP waves: rounded, smooth, upright and preceding every QRS complex.every QRS complex. PR interval: 0.12 to 0.20 seconds.PR interval: 0.12 to 0.20 seconds. QRS complex: 0.04 to 0.10 sec, less than 0.12 secQRS complex: 0.04 to 0.10 sec, less than 0.12 sec T wave: uprightT wave: upright QT interval: 0.36 sec to 0.44 secQT interval: 0.36 sec to 0.44 sec
- 103. SINUS ARRHYTHMIASINUS ARRHYTHMIA Sinus arrhythmia occurs when the sinusSinus arrhythmia occurs when the sinus node discharges irregularly.node discharges irregularly. Associated with the phases of respiration:Associated with the phases of respiration: during inspiration sinus node fires fasterduring inspiration sinus node fires faster and vice versa.and vice versa. Looks like normal sinus rhythm except forLooks like normal sinus rhythm except for the sinus irregularity.the sinus irregularity.
- 106. SINUS BRADYCARDIASINUS BRADYCARDIA Sinus bradycardia is characterized by a sinusSinus bradycardia is characterized by a sinus rate below 60 bpm and regular rhythm.rate below 60 bpm and regular rhythm. It may occur normally during sleep or in aIt may occur normally during sleep or in a person with a well conditioned heart (athletes).person with a well conditioned heart (athletes). May be a response of vagal stimulation, anyMay be a response of vagal stimulation, any disease process (MI, raised ICP etc) anddisease process (MI, raised ICP etc) and medications (digitalis, beta blockers, Camedications (digitalis, beta blockers, Ca Channel blocker).Channel blocker). Treat only if patient is symptomatic.Treat only if patient is symptomatic.
- 109. SINUS TACHYCARDIASINUS TACHYCARDIA Sinus tachycardia is a sinus rhythm at aSinus tachycardia is a sinus rhythm at a rate greater than 100 bpm.rate greater than 100 bpm. It is normal response to exercise andIt is normal response to exercise and emotion.emotion. Persistent sinus tachycardia indicatesPersistent sinus tachycardia indicates underlying problem like fever, acute bloodunderlying problem like fever, acute blood loss, pain, shock, anxiety etc.loss, pain, shock, anxiety etc. It is normal physiologic response toIt is normal physiologic response to decrease cardiac output.decrease cardiac output.
- 111. SINUS ARRESTSINUS ARREST Sinus arrest is a failure of the SA node toSinus arrest is a failure of the SA node to initiate an impulse resulting in the absenceinitiate an impulse resulting in the absence of a P wave, QRS complex and T wave.of a P wave, QRS complex and T wave. It is also known as sinus pause or cardiacIt is also known as sinus pause or cardiac sandstill.sandstill. Usually with the exception of missingUsually with the exception of missing PQRST complex, the ECG will be normal.PQRST complex, the ECG will be normal.
- 114. ATRIAL ARRHYTHMIASATRIAL ARRHYTHMIAS Atrial arrhythmias the most commonAtrial arrhythmias the most common cardiac rhythm disturbance as result fromcardiac rhythm disturbance as result from impulses originating in areas outside theimpulses originating in areas outside the sinoatrial node (SA node).sinoatrial node (SA node). These arrhythmias can affect ventricularThese arrhythmias can affect ventricular filling time.filling time.
- 115. PREMATURE ATRIALPREMATURE ATRIAL CONTRACTIONCONTRACTION Premature atrial contraction originatesPremature atrial contraction originates outside the SA node, usually results fromoutside the SA node, usually results from an irritable focus (ectopic pacemaker).an irritable focus (ectopic pacemaker). Irritable focus in the atria fires before theIrritable focus in the atria fires before the next sinus node impulse is due to fire.next sinus node impulse is due to fire. P wave configuration is abnormal asP wave configuration is abnormal as compare to sinus P wave.compare to sinus P wave. Normal QRS complex .Normal QRS complex .
- 116. CONT.CONT. Rhythm would be regular except whenRhythm would be regular except when PAC occur.PAC occur. PR interval may be normal or prolonged.PR interval may be normal or prolonged. T wave embedded with p wave.T wave embedded with p wave. It can occur in healthy people as a result ofIt can occur in healthy people as a result of emotions, tobacco, alcohol and caffeine.emotions, tobacco, alcohol and caffeine. It can also associated with diseaseIt can also associated with disease processes like rheumatic heart diseases,processes like rheumatic heart diseases, ischemic heart diseases, mitral stenosis,ischemic heart diseases, mitral stenosis, heart failure, certain electrolyte imbalancesheart failure, certain electrolyte imbalances and medications etc.and medications etc.
- 118. PAROXYSMAL SUPRAVENTRICULARPAROXYSMAL SUPRAVENTRICULAR TACHYCARDIATACHYCARDIA PSVT is the sudden onset of a rapid firingPSVT is the sudden onset of a rapid firing from an ectopic foci resulting in a heartfrom an ectopic foci resulting in a heart rate of 150 – 250 bpm.rate of 150 – 250 bpm. Occurs when a single ectopic site in oneOccurs when a single ectopic site in one of the atria takes over pacing the heartof the atria takes over pacing the heart instead of the SA node.instead of the SA node. The brief period of tachycardia alternatesThe brief period of tachycardia alternates with periods of normal sinus rhythm.with periods of normal sinus rhythm.
- 119. CONT.CONT. P wave may precede QRS complex, may beP wave may precede QRS complex, may be hidden in QRS complex or may be mergedhidden in QRS complex or may be merged with T wave.with T wave. P wave may be negative because ofP wave may be negative because of retrograde conduction from AV node to atria.retrograde conduction from AV node to atria. QRS complex is usually normal.QRS complex is usually normal. Rhythm of PSVT is regular.Rhythm of PSVT is regular. PSVT can be terminated with vagalPSVT can be terminated with vagal stimulation (carotid massage), Valsalvastimulation (carotid massage), Valsalva maneuver or IV adenosine.maneuver or IV adenosine.
- 123. ATRIAL FLUTTERATRIAL FLUTTER Atrial flutter is an accelerated rhythm fromAtrial flutter is an accelerated rhythm from rapid firing of an ectopic atrial focus at raterapid firing of an ectopic atrial focus at rate of 250 to 350 bpm.of 250 to 350 bpm. The AV node prevent too many atrialThe AV node prevent too many atrial impulses from reaching to the ventricles.impulses from reaching to the ventricles. Rapid atrial rate producesRapid atrial rate produces saw toothsaw tooth PP waves on the ECG.waves on the ECG.
- 124. CONT.CONT. P wave has classic saw tooth appearanceP wave has classic saw tooth appearance with atrial rate of 250 – 350 bpm.with atrial rate of 250 – 350 bpm. Flutter block; 2:1, 3:1 or 4:1 (flutter toFlutter block; 2:1, 3:1 or 4:1 (flutter to ventricular ratio).ventricular ratio). QRS has normal configuration.QRS has normal configuration. Atrial rhythm is regular but ventricularAtrial rhythm is regular but ventricular rhythm would be regular or irregular both.rhythm would be regular or irregular both. Treatment goal is to reestablish sinusTreatment goal is to reestablish sinus rhythm and ventricular control.rhythm and ventricular control.
- 127. ATRIAL FIBRILLATIONATRIAL FIBRILLATION Atrial fibrillation is characterized by rapid,Atrial fibrillation is characterized by rapid, chaotic atrial ectopic rhythm with atrial ratechaotic atrial ectopic rhythm with atrial rate of 350 – 500 bpm.of 350 – 500 bpm. The ventricles respond only to thoseThe ventricles respond only to those impulses that make it through AV node.impulses that make it through AV node. P waves are not present.P waves are not present. Normal QRS complex.Normal QRS complex. Rhythm is irregular.Rhythm is irregular.
- 132. MULTIFOCAL ATRIALMULTIFOCAL ATRIAL TACHYCARDIATACHYCARDIA In this arrhythmia, atrial tachycardiaIn this arrhythmia, atrial tachycardia occurs with three or more atrial foci firingoccurs with three or more atrial foci firing intermittently.intermittently. P wave morphology results from firing ofP wave morphology results from firing of three or more atrial foci.three or more atrial foci. Atrial rate is between 100 to 250 bpm.Atrial rate is between 100 to 250 bpm. Rhythm is usually irregular.Rhythm is usually irregular. QRS complex are normal.QRS complex are normal.
- 134. JUNCTIONAL RHYTHMJUNCTIONAL RHYTHM Junctional rhythm originates from AV junction.Junctional rhythm originates from AV junction. It occurs when SA node fails to conductIt occurs when SA node fails to conduct impulses.impulses. The Junctional rate ranges between 50 to 70The Junctional rate ranges between 50 to 70 bpm.bpm. P wave appear inverted before QRS complex.P wave appear inverted before QRS complex. Buried P wave inside the QRS complex.Buried P wave inside the QRS complex. Normal QRS followed by inverted P wave.Normal QRS followed by inverted P wave.
- 139. PREMATURE JUNCTIONALPREMATURE JUNCTIONAL CONTRACTIONCONTRACTION Premature junctional contraction is anPremature junctional contraction is an ectopic impulse from AV junction occurectopic impulse from AV junction occur before next sinus impulse.before next sinus impulse. QRS complex is narrow <0.12 sec.QRS complex is narrow <0.12 sec. P wave may occur before, during or afterP wave may occur before, during or after QRS complex.QRS complex. Occur in healthy people or in people withOccur in healthy people or in people with underlying heart disease.underlying heart disease. Rhythm is irregular.Rhythm is irregular.
- 141. PREMATURE VENTRICULARPREMATURE VENTRICULAR CONTRACTIONCONTRACTION They are caused by firing of an ectopicThey are caused by firing of an ectopic impulse in the ventricles before nextimpulse in the ventricles before next expected impulse from SA node.expected impulse from SA node. As a result of this, no P wave occur.As a result of this, no P wave occur. QRS complex is wide and bizarre appearsQRS complex is wide and bizarre appears interrupting normal sinus rhythm.interrupting normal sinus rhythm. After a premature beat there is aAfter a premature beat there is a compensatory pause.compensatory pause.
- 143. CONT.CONT. If PVC occur after each sinus beat then itIf PVC occur after each sinus beat then it is known as ventricular bigeminy.is known as ventricular bigeminy. If PVC occur after two consecutive sinusIf PVC occur after two consecutive sinus beats then it is known as ventricularbeats then it is known as ventricular trigeminy.trigeminy. When PVC appear in one form it is calledWhen PVC appear in one form it is called as unifocal PVC and different PVC areas unifocal PVC and different PVC are known as multifocal PVC.known as multifocal PVC.
- 149. VENTRICULAR TACHYCARDIAVENTRICULAR TACHYCARDIA This is characterized by rapidly occurringThis is characterized by rapidly occurring series of PVCs with no normal beats inseries of PVCs with no normal beats in between.between. Absent P wave.Absent P wave. QRS is wide and bizarre with rate moreQRS is wide and bizarre with rate more than 100 to 250 bpm.than 100 to 250 bpm. Rhythm is regular.Rhythm is regular. Extremely dangerous as this can result inExtremely dangerous as this can result in low cardiac output.low cardiac output.
- 153. TOSARDES DE POINTESTOSARDES DE POINTES Tosardes de pointes means twisting of points,Tosardes de pointes means twisting of points, is a special form of ventricular tachycardia.is a special form of ventricular tachycardia. QRS complexes rotate about the baseline,QRS complexes rotate about the baseline, deflecting downward and upward for severaldeflecting downward and upward for several beats.beats. P waves are absent.P waves are absent. QRS complex is wide and bizarre.QRS complex is wide and bizarre. Tachycardia rate is between 100 – 300 bpm.Tachycardia rate is between 100 – 300 bpm. Rhythm is irregular.Rhythm is irregular. IV magnesium sulphate is drug of choice.IV magnesium sulphate is drug of choice.
- 157. VENTRICULAR FIBRILLATIONVENTRICULAR FIBRILLATION Ventricular defibrillation is rapid, irregularVentricular defibrillation is rapid, irregular and ineffective depolarization of theand ineffective depolarization of the ventricles.ventricles. ECG tracing display bizarre fibrillatoryECG tracing display bizarre fibrillatory wave pattern.wave pattern. P wave, QRS complex and T wave areP wave, QRS complex and T wave are impossible to identify.impossible to identify. Rate and rhythm cannot be determined.Rate and rhythm cannot be determined.
- 160. IDIOVENTRICULAR RHYTHMIDIOVENTRICULAR RHYTHM Normal ventricular rate is 20 to 40 bpmNormal ventricular rate is 20 to 40 bpm and when this rate accelerates aboveand when this rate accelerates above sinus rate making ventricle the primarysinus rate making ventricle the primary pacemaker.pacemaker. Absent P wave.Absent P wave. QRS is wide and bizarre.QRS is wide and bizarre. It occur regularly at rate of 50 to 100 bpm.It occur regularly at rate of 50 to 100 bpm. Rhythm is usually regular.Rhythm is usually regular.
- 163. VENTRICULAR ASYSTOLEVENTRICULAR ASYSTOLE It is absence of any electrical activity.It is absence of any electrical activity. No P wave, no QRS complex, no pulse andNo P wave, no QRS complex, no pulse and no cardiac output.no cardiac output. It is always fatal as patient is unresponsiveIt is always fatal as patient is unresponsive therefore it has to be treated immediately.therefore it has to be treated immediately. Flat line on ECG.Flat line on ECG.
- 166. ATRIOVENTRICULAR BLOCKATRIOVENTRICULAR BLOCK The termThe term AtrioventricularAtrioventricular block is used toblock is used to describedescribe arrhythmias inarrhythmias in which there iswhich there is delay or faileddelay or failed conduction ofconduction of supraventricularsupraventricular impulses into theimpulses into the ventricles.ventricles.
- 167. FIRST DEGREEFIRST DEGREE ATRIOVENTRICULAR BLOCKATRIOVENTRICULAR BLOCK First degree AV block is defined asFirst degree AV block is defined as prolonged AV conduction time ofprolonged AV conduction time of supraventricular impulses into thesupraventricular impulses into the ventricles.ventricles. This delay usually occur in the AV nodeThis delay usually occur in the AV node and all impulses are conducted to theand all impulses are conducted to the ventricles but with delayed conductionventricles but with delayed conduction times.times. It is characterized by a constant prolongIt is characterized by a constant prolong PR interval.PR interval.
- 169. CONT.CONT. P waves are present and preceding everyP waves are present and preceding every QRS complex.QRS complex. It can be due to coronary artery disease,It can be due to coronary artery disease, rheumatic heart disease, administration ofrheumatic heart disease, administration of digitalis, beta blockers or ca channeldigitalis, beta blockers or ca channel blockers.blockers. Nurse should observe rhythm closely for 2Nurse should observe rhythm closely for 2 degree and 3 degree block.degree and 3 degree block.
- 171. SECOND DEGREE AV BLOCKSECOND DEGREE AV BLOCK Second degree AV block occur whenSecond degree AV block occur when impulses from AV node at time fails to beimpulses from AV node at time fails to be conducted to the ventricles.conducted to the ventricles. It is divided into two distinct categories:It is divided into two distinct categories: type I block occurring in the AV node andtype I block occurring in the AV node and type II occurring below the AV node in thetype II occurring below the AV node in the bundle of His or bundle branch system.bundle of His or bundle branch system.
- 172. SECOND DEGREE AV BLOCKSECOND DEGREE AV BLOCK MOBITZ I (WENCHEBACK)MOBITZ I (WENCHEBACK) It refer to as Wencheback block in whichIt refer to as Wencheback block in which there is a progressive increase inthere is a progressive increase in conduction times of consecutive atrialconduction times of consecutive atrial impulses into the ventricles until oneimpulses into the ventricles until one impulse fails to conduct.impulse fails to conduct. It is usually associated with the blockIt is usually associated with the block above the bundle of His.above the bundle of His. PR interval gradually lengthen until one PPR interval gradually lengthen until one P wave fails to conduct and is not followedwave fails to conduct and is not followed by QRS.by QRS.
- 176. SECOND DEGREE AV BLOCKSECOND DEGREE AV BLOCK MOBITZ IIMOBITZ II This type of block is due to sudden failure ofThis type of block is due to sudden failure of conduction of an atrial impulse to the ventriclesconduction of an atrial impulse to the ventricles without progressive increase in conduction time ofwithout progressive increase in conduction time of consecutive P waves.consecutive P waves. This is less common than Mobitz Type I but is moreThis is less common than Mobitz Type I but is more serious (often precedes to 3 degree block).serious (often precedes to 3 degree block). Conduction pattern would be occasionally orConduction pattern would be occasionally or repetitive, 2:1, 3:1,…repetitive, 2:1, 3:1,… PR interval remain constant although they may bePR interval remain constant although they may be normal or slightly prolong.normal or slightly prolong. Wide QRS complex due to bundle branch block.Wide QRS complex due to bundle branch block.
- 178. THIRD DEGREE AV BLOCKTHIRD DEGREE AV BLOCK Complete AV block occurs when no PComplete AV block occurs when no P waves are conducted to the ventricles.waves are conducted to the ventricles. It is complete failure of conduction of allIt is complete failure of conduction of all atrial impulses to ventricles.atrial impulses to ventricles. The atria and ventricle are controlled byThe atria and ventricle are controlled by independent pacemaker.independent pacemaker. P waves and QRS are present on ECGP waves and QRS are present on ECG but without relationship.but without relationship.
- 182. SUMMARY OF LEADSSUMMARY OF LEADS Limb LeadsLimb Leads Precordial LeadsPrecordial Leads BipolarBipolar I, II, IIII, II, III (standard limb leads)(standard limb leads) -- UnipolarUnipolar aVR, aVL, aVFaVR, aVL, aVF (augmented limb leads)(augmented limb leads) VV11-V-V66
- 184. ARRANGEMENT OF LEADS ON THEARRANGEMENT OF LEADS ON THE ECG PAPERECG PAPER
- 186. ANATOMIC GROUPSANATOMIC GROUPS (LATERAL WALL)(LATERAL WALL)
- 187. ANATOMIC GROUPSANATOMIC GROUPS (INFERIOR WALL)(INFERIOR WALL)
- 189. EFFECT OF ELECTROLYTES ON ECGEFFECT OF ELECTROLYTES ON ECG POTASSIUM:POTASSIUM: – It is found primarily in the intracellularIt is found primarily in the intracellular compartment.compartment. – It is important for cardiac cell repolarization.It is important for cardiac cell repolarization. – It also helps in maintaining stable polarizedIt also helps in maintaining stable polarized state of cardiac cells.state of cardiac cells. – Two abnormalities of potassium areTwo abnormalities of potassium are hyperkalemia and hypokalemia.hyperkalemia and hypokalemia. – Hyperkalemia cause tall, narrow and peakedHyperkalemia cause tall, narrow and peaked T wave.T wave. – Hypokalemia indicate presence of prominentHypokalemia indicate presence of prominent U wave and short T wave.U wave and short T wave.
- 192. CONT.CONT. CALCIUM:CALCIUM: – Calcium is important for initiation and propagationCalcium is important for initiation and propagation of electrical impulses and myocardial contractility.of electrical impulses and myocardial contractility. – Calcium abnormalities are less common thanCalcium abnormalities are less common than potassium abnormalities.potassium abnormalities. – Hypercalcemia causes shortening of the QTHypercalcemia causes shortening of the QT interval as a result of short ST segment.interval as a result of short ST segment. – Sometimes ST depression and T wave inversionSometimes ST depression and T wave inversion can also be seen.can also be seen. – Hypocalcemia prolong QT interval as a result ofHypocalcemia prolong QT interval as a result of prolong ST segment.prolong ST segment. – T wave can be inverted in some cases.T wave can be inverted in some cases.
- 195. CARDIAC BIOMARKERSCARDIAC BIOMARKERS Cardiac markersCardiac markers are substances releasedare substances released from heart muscles when it is damaged asfrom heart muscles when it is damaged as a result of an injury.a result of an injury. Normally these enzymes are present in lowNormally these enzymes are present in low amounts in the blood of healthy people.amounts in the blood of healthy people. Used in conjunction with history,Used in conjunction with history, signs/symptoms, exam and ECG changessigns/symptoms, exam and ECG changes to make diagnosis.to make diagnosis.
- 196. CHARACTERISTICSCHARACTERISTICS Easy to measure.Easy to measure. Inexpensive.Inexpensive. Cardiac specific.Cardiac specific. Direct proportional relationship betweenDirect proportional relationship between the extent of injury and enzyme levels.the extent of injury and enzyme levels. Rapid serum levels after injury.Rapid serum levels after injury. Stay for long time in serum.Stay for long time in serum.
- 200. Cardiac Rhythm: SupraventricularCardiac Rhythm: Supraventricular NORMAL SINUS RHYTHMNORMAL SINUS RHYTHM Impuses originate at S-A node at normal rateImpuses originate at S-A node at normal rate SINUS TACHYCARDIASINUS TACHYCARDIA Impuses originate at S-A node at rapid rateImpuses originate at S-A node at rapid rate
- 201. Cardiac Rhythm: SupraventricularCardiac Rhythm: Supraventricular ATRIAL FLUTTERATRIAL FLUTTER Impulses travel in circular course in atria – No interval between T and PImpulses travel in circular course in atria – No interval between T and P ATRIAL FIBRILLATIONATRIAL FIBRILLATION Impuses have chaotic, random pathways in atriaImpuses have chaotic, random pathways in atria
- 202. Activation Sequence DisordersActivation Sequence Disorders A-V BLOCK, FIRST DEGREEA-V BLOCK, FIRST DEGREE Atrio-ventricular conduction lengthenedAtrio-ventricular conduction lengthened A-V BLOCK, SECOND DEGREEA-V BLOCK, SECOND DEGREE Sudden dropped QRS-complexSudden dropped QRS-complex
- 203. Pathophysiological indications ofPathophysiological indications of EKGEKG Shortened QT interval :Shortened QT interval : Hypercalcemia, someHypercalcemia, some drugs.drugs. Prolonged QT interval :Prolonged QT interval : Hypocalcemia, someHypocalcemia, some drugs.drugs. Flattened or inverted T waves :Flattened or inverted T waves : CoronaryCoronary ischemia, left ventricular hypertrophy, digoxinischemia, left ventricular hypertrophy, digoxin effect, some drugs.effect, some drugs. Hyperacute T waves :Hyperacute T waves : Possibly the firstPossibly the first manifestation of acute myocardial infarction.manifestation of acute myocardial infarction. Prominent U waves :Prominent U waves : Hypokalemia.Hypokalemia.
- 204. GROUP ACTIVITYGROUP ACTIVITY Cardiac cycle. Preload, afterload and contractility.Cardiac cycle. Preload, afterload and contractility. 12 lead ECG. (waves, intervals and segments). Steps12 lead ECG. (waves, intervals and segments). Steps in reading ECG, methods of taking heart rate fromin reading ECG, methods of taking heart rate from rhythm strip.rhythm strip. Sinus node arrhythmias.Sinus node arrhythmias. Atrial arrhythmias.Atrial arrhythmias. Junctional arrhythmias and idioventricular rhythm.Junctional arrhythmias and idioventricular rhythm. Ventricular arrhythmias.Ventricular arrhythmias. Heart block, 1 degree and 2 degree)Heart block, 1 degree and 2 degree) Heart block 3 degree. Cardiac enzymes.Heart block 3 degree. Cardiac enzymes.