Designing an enzyme based nanobiosensor using molecular (2011)
absolute-molar-mass-uhplc
1. †skenrick@wyatt.com ‡aberges@wyatt.com
Application Note
Wyatt Technology Corporation
Absolute Molar Mass in UHPLC
via the µDAWN and UT-rEX
Sophia Kenrick, Ph.D.† and Aym Berges, Ph.D.‡
Size exclusion chromatography (SEC) is widely used for
characterizing the size and composition of aggregates or
fragments in a biomolecular sample. Conventional SEC
relies on reference standards to calibrate column elu-
tion time as a function of molar mass. However, these
standards often do not accurately represent the confor-
mation of the sample, or the sample may exhibit column
interactions that change its elution properties relative
to the standard. Coupling a light scattering detector,
such as the miniDAWNTM TREOS®, to SEC enables ab-
solute quantification of a molecule’s molar mass, irre-
spective of elution time.
Ultra-high performance liquid chromatography
(UHPLC) enables fast, efficient separation of biomolec-
ular samples. Compared to standard SEC, UHP-SEC
provides improved resolution, higher throughput, less
solvent and smaller sample consumption for analysis of
precious biological samples. Detectors designed for
standard HPLC, however, have proven incompatible
with this technology. The Wyatt µDAWNTM multi-angle
light scattering (MALS) detector and Optilab
UT-
rEXTM refractive index (RI) detector, designed specifi-
cally for UHPLC applications, combine to measure the
absolute molecular weight (or molar mass) and size of
eluting species in UHPLC.
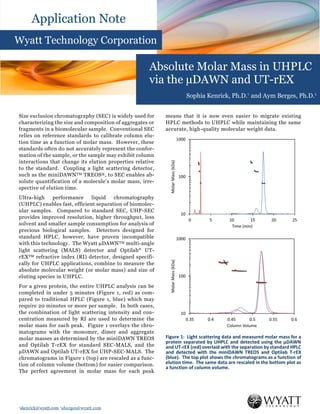
For a given protein, the entire UHPLC analysis can be
completed in under 5 minutes (Figure 1, red) as com-
pared to traditional HPLC (Figure 1, blue) which may
require 20 minutes or more per sample. In both cases,
the combination of light scattering intensity and con-
centration measured by RI are used to determine the
molar mass for each peak. Figure 1 overlays the chro-
matograms with the monomer, dimer and aggregate
molar masses as determined by the miniDAWN TREOS
and Optilab T-rEX for standard SEC-MALS, and the
µDAWN and Optilab UT-rEX for UHP-SEC-MALS. The
chromatograms in Figure 1 (top) are rescaled as a func-
tion of column volume (bottom) for easier comparison.
The perfect agreement in molar mass for each peak
means that it is now even easier to migrate existing
HPLC methods to UHPLC while maintaining the same
accurate, high-quality molecular weight data.
Figure 1: Light scattering data and measured molar mass for a
protein separated by UHPLC and detected using the µDAWN
and UT-rEX (red) overlaid with the separation by standard HPLC
and detected with the miniDAWN TREOS and Optilab T-rEX
(blue). The top plot shows the chromatograms as a function of
elution time. The same data are rescaled in the bottom plot as
a function of column volume.