OP04:Relating BGBD to soil quality along an agricultural land use gradient
•
1 like•318 views

A presentation by Dr. Anne Akol: A study of soil biota of the Mabira forest ecosystem, Uganda

Recommended
Recommended
More Related Content
More from CSM _BGBD biodiversity
More from CSM _BGBD biodiversity (20)
Recently uploaded
Recently uploaded (20)
OP04:Relating BGBD to soil quality along an agricultural land use gradient
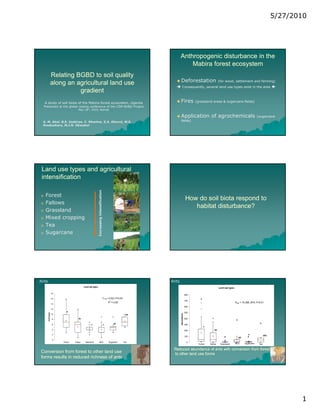
- 1. 5/27/2010 Anthropogenic disturbance in the Mabira forest ecosystem Relating BGBD to soil quality along an agricultural land use Deforestation (for wood, settlement and farming) Consequently, several land use types exist in the area gradient A study of soil biota of the Mabira forest ecosystem, Uganda Fires (grassland areas & sugarcane fields) Presented at the global closing conference of the CSM-BGBD Project CSM- May 18th, 2010; Nairobi Application of agrochemicals (sugarcane A. M. Akol, B.E. Isabirye, C. Nkwiine, S.A. Okurut, M.S. fields) Rwakaikara, M.J.N. Okwakol Land use types and agricultural intensification nsification o Forest How do soil biota respond to o Fallows habitat disturbance? Increasing inten o Grassland o Mixed cropping o Tea o Sugarcane Ants Ants Land use types Land use types 18 800 16 F5,90 = 5.623; P<0.001 2 700 R = 0.238 Kobs = 18.366; df=5; P<0.01 14 600 12 a 500 richn ess undance 10 ab 8 bc 400 abu 6 c c bc 300 c 4 200 bc 2 abc 100 a a ab 0 Forest Fallow Grassland MCS Sugarcane Tea 0 Forest Fallow Grassland MCS Sugarcane Tea Reduced abundance of ants with conversion from forest Conversion from forest to other land use to other land use forms forms results in reduced richness of ants 1
- 2. 5/27/2010 Variation in earthworm density across land use types Response of termites to land use conversions a 300 30.00 250 a a 25.00 P<0.05 B ms ( m ) 2 200 20.00 i asg - mean#/m2 150 15.00 o 100 ab 10.00 b b 50 5.00 0 0.00 Forest Fallow Mixed Tea Grassland Sugarcane Forest Fallow Tea MCS Grassland Sugarcane LUTs land-use type 2000.0 Variation in earthworm biomass across land-use type bna c ( ds q ) A a d n ein v / s m 1500.0 140 a 1000.0 120 a P<0.05 ab 100 500.0 2 gm/m 80 60 0.0 40 abc e d d bc w st ea an e n e lo c la ix T 20 or rc M al ss -500.0 F F a ra ug 0 G S Forest Fallow Tea MCS Grassland Sugarcane LUT land-use type Ants Ants Land use intensification Land use intensification 18 800 16 F2,93 = 11.447; P<0.001 700 Kobs = 11.173; df=2; P<0.01 2 14 R = 0.198 600 12 a 500 rich n ess 10 abundance e e 400 8 b b 300 6 b 200 4 a 100 2 a 0 0 high low medium high low medium Increasing intensification results in reduced Reduced richness of ant genera with intensification numerical strength Earthworm abundance declines with intensification Abundance of E/worms y = -9.2092x + 220.74 P< 0.007 Assessing soil quality 1200 1000 A bundance 800 Is belowground biodiversity relevant? 600 400 200 0 0 5 10 15 20 LUI 2
- 3. 5/27/2010 Separation of LUTs by BGBD sub-indicator Separation of LUTs by AGBD sub-indicator 1 1.2 a a 0.9 a a 1 0.8 a 0.7 b 0.8 b 0.6 b b c b BGBD AGBD 0.5 0.6 bc 0.4 0.4 0.3 0.2 0.2 0.1 0 Grassland MCS Fallow Forest MCS Sugarcane Tea 0 Fallow Forest Grassland Sugarcane Tea 1 a How does soil 0.9 0.8 quality in the 0.7 b bc LUTs compare by 0.6 bc G ISQ cd d sub-indicator? 0.5 0.4 An intensification value computed for @ of the 96 points. 0.3 Values used to derive 5 sub-indicators of soil quality: 0.2 AGBD, BGBD, Organic, Chemical, Physical 0.1 Grassland Tea 0 MCS Sugarcane Fallow Forest y = 0.0002x + 0.5338 Physical VS LUI R2 = 3E-05 y = -0.0094x + 0.6148 BGBD Vs LUI Which sub-indicators are P < 0.961 R2 = 0.1137 1.2 P < 0.001 1 sensitive to intensification? 1.2 0.8 1 P hy s ic a l 0.8 B GB D 0.6 0.6 y = -0.0308x + 0.7945 0.4 GISQ Vs LUI 0.4 R2 = 0.6254 0.2 0.2 P<0.0001 y = -0.0098x + 0.4997 1.2 0 Organic Vs LUI 2 0 R = 0.092 0 5 10 15 20 0 5 10 15 20 1 P < 0.003 LUI 1 LUI 0.8 G IS Q 0.8 0.6 O rg a n ic 0.6 0.4 0.4 0.2 y = -0.0351x + 0.9343 AGBD Vs LUI 0.2 2 R = 0.6675 0 P < 0.0001 0 5 10 15 20 y = 0.0009x + 0.2357 0 1.2 Chemical Vs LUI LUI R2 = 0.0018 0 5 10 15 20 1 P < 0.684 0.8 1.2 LUI A GB D 1 0.6 C h e m ic a l 0.8 0.6 0.4 Increasing Organic parameters (soil intensification 0.2 0.4 0 0.2 0 carbon/organic matter) 0 5 10 15 20 associated with decline 0 5 10 15 20 correlated with LUI LUI in soil quality defined by LUI AGBD, BGBD, GISQ 1.2 1 1 1.2 F C B R2 = 0.58, P<0.0001 A R2 = 0.04, P>0.05 R2 = 0.18, P<0.0001 0.9 0.9 R2 = 0.003, P>0.05 1 1 a 0.8 0.8 AGBD Sub-Indicator a Chemical Sub-Indicator BGBD Sub-Indicator Physical Sub-Indicator 0.7 0.7 0.8 0.8 ab b 0.6 b 0.6 bc 0.6 0.5 c 0.6 0.5 c 0.4 0.4 0.4 0.3 0.4 0.3 0.2 0.2 0.2 0.1 0.2 Multiple Past Tree Multiple Past Tree 0 Grazing Monoculture Cropping Cutting 0.1 0 Grazing Monoculture Cropping Cutting Multiple Past Tree Monocultur Multiple Past Tree 0 0 Grazing Monoculture Cropping Cutting Grazing e Cropping Cutting 1 0.9 E D R2 = 0.18, P<0.0001 0.9 R2 = 0.58, P<0.0001 a Which sub-indicator Which sub- Organic sub- 0.8 can discriminate 0.8 indicator can 0.7 ab a indicator Organic SubIndicator broad categories of 0.7 discriminate 0.6 was able to 0.6 b separate the bc b disturbance? GIEQ 0.5 broad 0.5 c 0.4 land use categories of b 0.4 0.3 forms based disturbance? 0.3 0.2 on 0.2 0.1 Multiple Past Tree disturbance 0.1 0 Grazing MonocultureCropping Cutting Multiple Past Tree 0 Grazing MonocultureCropping Cutting 3
- 4. 5/27/2010 Key conclusions Acknowledgements Above- Above- and Below-ground biodiversity are Below- GEF- GEF-UNEP, TSBF-CIAT TSBF- sensitive to disturbance Fellow colleagues Combining these parameters with physical and chemical parameters g p gives a more Mabira forest authorities & robust indicator of soil quality communities iti Restricting assessments of soil quality to chemical or physical parameters may not give a true picture of the impacts of disturbance on ecosystems 4