Boost PC performance: How more available memory can improve productivity
Coastal Processes on the Holderness Coast
1. 2 Coastal Processes
N
St Abb’s Head
1
Flamborough Head
Solway Firth
Great Orme
11
2
The Wash
10
Bardsey Sound
3
9
St David’s Head
The Severn
The
Thames
8
7
4
Land’s End
5
6
Selsey Bill
Portland Bill
0
100km
Major Cell Boundary
Scale
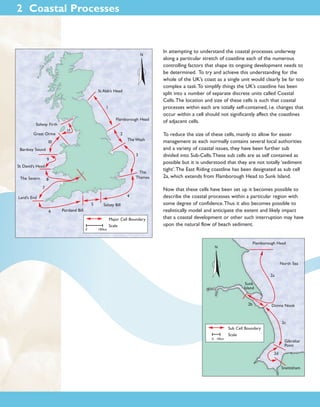
In attempting to understand the coastal processes underway
along a particular stretch of coastline each of the numerous
controlling factors that shape its ongoing development needs to
be determined. To try and achieve this understanding for the
whole of the UK’s coast as a single unit would clearly be far too
complex a task.To simplify things the UK’s coastline has been
split into a number of separate discrete units called Coastal
Cells.The location and size of these cells is such that coastal
processes within each are totally self-contained, i.e. changes that
occur within a cell should not significantly affect the coastlines
of adjacent cells.
To reduce the size of these cells, mainly to allow for easier
management as each normally contains several local authorities
and a variety of coastal issues, they have been further sub
divided into Sub-Cells.These sub cells are as self contained as
possible but it is understood that they are not totally ‘sediment
tight’.The East Riding coastline has been designated as sub cell
2a, which extends from Flamborough Head to Sunk Island.
Now that these cells have been set up it becomes possible to
describe the coastal processes within a particular region with
some degree of confidence.Thus it also becomes possible to
realistically model and anticipate the extent and likely impact
that a coastal development or other such interruption may have
upon the natural flow of beach sediment.
Flamborough Head
N
North Sea
2a
Sunk
Island
2b
Donna Nook
2c
Sub Cell Boundary
Scale
0 10km
Gibraltar
Point
2d
Snettisham
2. Erosion
As we have seen the rapid erosion of the East Riding coastline is not a new phenomenon, the
people of this area have had to deal with its consequences since early settlements began to
develop following the ice age. Documentary evidence records the loss of up to 14 villages so far
since Roman times, all that now remains is a legacy of road names leading to long lost villages.
With such a long history it might be expected that the processes that lead to erosion would be
well understood, this is not the case however. Numerous studies have attempted to determine
the causes and suggest solutions to this erosion problem but as yet no conclusive answer has
been found.
Clockwise rotation in flood tide around Flamborough
Head creates northerly flow
N
Flamborough Head
Bridlington
Smithic Sands and Flamborough Head reduce local
wave activity and realign wave front
Barmston
Driffield
Pre
fro domin
mt
he ant w
nor ave
th e s
ast
Hornsea
Beverley
Kingston
Upon Hull
Falling ebb tide
producing north
westerly currents of up
to 0.25m/s
Mappleton
Advancing flood tide
producing south easterly
currents of up to 0.5m/s
Tunstall
Withernsea
The Binks glacial ridge
reduces wave activity
around Spurn Point
Easington
River
Humber
Net tide current direction
Net wave transport direction
This situation is understandable
however as it turns out that the
coastal processes that lead to erosion
are far more complex than may appear
at first sight.The difficulty lies in the
fact that cliff recession is not a static
measurable quantity but a dynamic
system driven by a random mix of
wave and tidal forces.
To complicate things further the
erosion that these forces generate is
then in turn controlled by the sediment
that it produces.This second system
relies upon the formation and retention
of a stable beach as in absorbing wave
energy a beach protects the underlying
clay strata and cliffs, thus preventing
erosion. Ironically reducing erosion in
this way slows down the production of
sand, which then reduces beach levels
leading to increased erosion.Thus cliff
erosion is ultimately driven by storm
seas and is governed by the cycle of
beach growth and loss.
Spurn Point
North Landing, Flamborough
3. If beach sand could be contained through
effective beach control systems such as a
groyne field or the development of a
stable bay, cliff erosion would locally stop.
Beach levels however tend to fluctuate
due to interruptions in the southerly
supply of beach sand or following storms
that temporarily draw sand offshore. If
this lowering of beach levels leads to
exposure of the underlying clay surfaces
then irreversible erosion will occur.
Flamborough Head
Bridlington
Storms may drive up to 40,000m^3 of sand south around Flamborough.
Smithic Sands - offshore sand banks deposited in
lee of cliffs store and regulate supply of sand.
Wave and tidal forces lead to erosion of clay cliffs and bed strata, this eroded
material is then transported southwards by wave and tidal forces.
Driffield
Wave action moves sand in net southerly direction .
Muds and clays in suspention move south and offshore.
Larger cobbles and rock remain and collect offshore.
Hornsea
Beverley
Since cliff erosion is tied to so many
unpredictable quantities accurate
prediction of future erosion is
impossible.The only means available to
forecast erosion is through analysis of
historical records. If coastal processes
remain unchanged then it can be
assumed that past and future erosion
rates at each location will remain fairly
similar. So to foretell erosion it is first
necessary to establish past erosion.The
East Riding of Yorkshire began this
exercise in 1951 and has since built up
an extensive record of historical erosion
data for the entire East Riding coastline.
This erosion record is now updated
every six months, and is becoming more
accurate as the data set increases.
Small quantities of sand transported north by net northerly tide
cycle, possibly balancing that driven southwards.
N
Cliff erosion rates of up to 1.8m/yr liberate up to 1 million
m^3 of sediment. Erosion of the clay foreshore produces up
to a further 2 million m^3 therefore annual sediment
production can be up to 3 million m^3.
Mappleton
Total sediment quantities
Sediment Gradings
% of Total
Clays <64m^–6
79%
Fine Sands <128m^–6
12.5%
Sands Shingle >128m^–6 4.5%
Cobbles Boulders >0.15m 1%
Tunstall
Kingston
Upon Hull
Quantity m^3/year
2,370,000
375,000
225,000
30,000
Withernsea
Easington
River
Humber
Spurn
Point
Direction of net sand flow
Direction of net mud flow
Long term control of erosion would require permanent protection of the cliff and foreshore
clays. Simply defending the cliff toe through construction of a seawall or other such defence
would still allow the foreshore to erode, ultimately undermining the structure. Maintaining a
beach through effective sand control is therefore the aim when defending a frontage, the beach
itself also provides a valuable amenity asset. Once established a beach can be contained through
construction of a groyne field, the physical barrier that these structures provide prevents sand
moving along and past the frontage. Storms can still draw sand directly seaward so beach sand is
still lost and foreshore erosion does occur but at a much reduced rate.
Defending a frontage through the construction of a beach control system can however lead to
problems immediately down-drift, as following their construction these structures promote the
retention of sand which then reduces the supply down-drift. However this initial response is
relatively short term as once the defences are filled, sand will overtop and bypass them, leading
to the restoration of the drift system. In the longer term cyclic reductions in defended beach
levels will recreate the post construction conditions as the defences attempt to restore sand
levels, also in raising foreshore sand levels sand movement will tend to move offshore, the net
effect is a destabilising of down drift sand supply.
Sediments move offshore or
continue on to the Humber
estuary then to beaches
southwards
4. Mechanics of Cliff Erosion
Beach levels fluctuate constantly in response to changing sediment supplies and sea conditions,
however these changes in beach profile only become permanent following erosion of the
underlying clay substrate as once lost this material cannot be regained. Erosion of these clay
surfaces occurs whenever they are exposed either to the direct shearing force of moving water
or the abrasive action of moving sand. Either way erosion only occurs when wave or tidal forces
are of sufficient strength to transport sediments. In the near-shore zone waves which strike the
beach at an angle dominate whereas in deeper water tidal currents take over, both producing a
net southerly drift.
Wa
ve
bea s pu
ch sh s
at
an and u
ang p
le
Wa
ves
s
at a trike
n a bea
ngl
e ch
nt
me
ve
mo
rly
the d
ou san
t s ch
Ne bea
of
Gravity draws water
and sand back
perpendicular to beach
Movement of beach sand due to wave action
Beach sediments found along the East Riding coastline
are derived from erosion of the cliffs and foreshore.
This glacial till material is mainly composed of clays but
it also contains a mixture of fine to course sands and a
small amount of larger cobbles and rocks.
Once released by the sea these sediments are first
sorted and then transported away by wave and tidal
forces. Fine clays and muds that form the bulk of this
material are put into suspension then rapidly carried
south and offshore, most ending up within the Humber
Estuary. Sands move more slowly southwards mainly
under wave action and remain within the near-shore
zone, forming the beaches that can be seen at the base
of the cliffs. Larger cobbles and rocks tend to be drawn
offshore where they remain and gather, as in deeper
water waves are no longer capable of moving them.
Over time a blanket of such material develops, helping
to protect the underlying clay.
5. Clay Erosion
Of the four distinct zones identified on the profiles overleaf
erosion of clay surface can be seen to be occurring in three of
them:-
Zone 1 - The cliff face:
The most visible of the erosion zones, the cliff face undergoes
erosion whenever the tide is high enough to allow wave action
to strike its base.Wave impact and abrasion forces are then
capable of removing material so steepening the cliff face to a
point where it collapses spilling material onto the beach, this
clay is then rapidly removed by subsequent tides. If beach levels
are particularly low then a higher number of tides will reach the
cliffs and more erosion will occur.This erosion state will usually
continue until beach levels recover, which can be anything from
months to several years. A period of relative calm will then
follow until the cycle repeats again which may be in years or even decades time.
As unpredictable beach levels play such an important roll in controlling cliff erosion rates there
is considerable variation in erosion over time and at each location. Opposite stable managed
frontages erosion has been reduced to near zero, whereas on exposed stretches erosion rates
have on occasion been consistently recorded at over a metre a month. The average rate
however for the Holderness area south of Atwick has in the long term been fairly consistent at
just over 1.7m/year.
Tunstall
Cowden
6. Zone 2
Zone 3
Variable thickness
mobile sand layer
0 to about 4 metres 0 to about 5 centimetres
deep on upper beach
deep offshore
Incoming waves drive sand
inshore and southward
Zone 4
Offshore clay face
Eroding cliff face
Zone 1
Cobble/Rock layer
Incoming waves gather
and hold rock inshore
TYPICAL BEACH PROFILE
Level in metres above ODN
Cliff erosion
1 to 2m/yr
Slow vertical erosion of about 2 to 4cm/yr
No erosion
Clay face probably eroding to
keep pace with cliffs
Approx. distance offshore of cliff in metres
Level in metres above ODN
TYPICAL CLAY EROSION RATES
Summer calm weather builds sand on
upper beach
Winter’s rough seas pull sand down beach
to offshore sand banks
Approx. distance offshore of cliff in metres
CHANGES IN BEACH PROFILE IN RESPONSE TO CHANGING CONDITIONS
7. Zone 2 - The near-shore zone:
Fronting the cliffs and covering the underlying clay is a wave driven highly mobile layer of sand
and shingle, that can be anything from several metres deep to entirely absent, depending upon
sediment supply and wave conditions. As erosion of the clay only happens when it is exposed to
wave and tidal forces the depth and profile of this beach determines where and when erosion
can occur.
Normally a typical beach will develop and dissipate on a steady
cycle lasting several years as littoral transport drives waves of
sand southwards, this allows intermittent but steady erosion of
the foreshore. Storm conditions can however cause rapid
changes in beach profile by drawing sand offshore, possibly
stripping a beach of all its sand in a single tide. During this time
continued rough seas can cause rapid erosion of the newly
exposed clay. Recovery from such an event can then take
several months as calmer seas return sand to the upper beach.
As can be seen opposite these changes in beach profile can be
seen as a seasonal beach response, this accounts for the
increased erosion rates recorded over the winter months.
Further offshore in deeper water wave forces reduce in power
so the sand layer tends to be more stable, however it is often
only a few centimetres thick. Erosion over this area occurs as a
result of the steady movement of this thin sand layer as it leads
to abrasion of the under lying clay surface.
Few measurements have been taken of the long-term erosion
rate of this clay strata however it can be assumed that since the
overall profile remains fairly constant then erosion of the
foreshore matches cliff erosion rates.This gives an erosion rate
lowering of between 2 to 4 centimetres per year.
Skipsea
Zone 3 - The offshore clay face:
A feature of the Holderness coastline that has been observed along most of its length during
hydro-graphic seabed surveys is the presence of an offshore submerged clay cliff face that can be
up to several metres high. It has been suggested that this cliff may be a fossil cliff line dating to
the early Holocene times.
This cliff forms the boundary between the eroding inshore zone and the stable offshore seabed.
Due to its inaccessibility few if any measurements of the erosion of this face have been made.
Evidence suggests however that it is eroding at approximately the same rate of retreat as the
main cliff line i.e. approximately 1.7m/year.
8. Zone 4 - The offshore seabed:
Offshore of these eroding surfaces the seabed is protected by a thin rocky layer formed by the
collecting together through onshore wave forces, of larger eroded materials. In isolation waves
are able to move quite large obstacles however when grouped together they act as one and
become immobile. Over time the thickening of this layer will provide protection to the
underlying clay preventing any further lowering.Thus the depth, location and likely-hood of the
formation of this layer depends upon the quantity and size of rock contained within the original
clay body.
The total erosion volume is therefore the sum of these onshore and offshore volumes. Erosion
of the cliff is readily measurable and has been calculated to be just under one million metres
cubed per year. Estimates for the unseen offshore erosion vary but suggest a volume of twice
that of the cliff erosion, giving a total of approximately 3 million metres cubed per year.
North Landing, Flamborough