Recommandé

Recommandé
Contenu connexe
Plus de Kelli Buckreus
Plus de Kelli Buckreus (20)
Dernier
Dernier (20)
An Epidemiological Profile of Diabetes in Pregnancy among First Nations and non-First Nations Women in Alberta
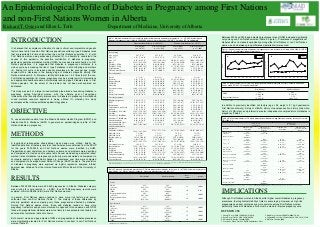
- 1. An Epidemiological Profile of Diabetes in Pregnancy among First Nations and non-First Nations Women in Alberta This study was part of a larger mixed methods plan aimed at examining diabetes in pregnancy among Aboriginal women, with the ultimate goal of developing interventions that can effectively improve care for diabetes in pregnancy. A multiphase mixed methods research approach is being utilized (7), whereby this study encompassed the initial quantitative epidemiology phase. OBJECTIVE To use administrative data from the Alberta Perinatal Health Program (APHP) and Alberta Health & Wellness (AHW) to generate an epidemiological profile of First Nations diabetes in pregnancy. METHODS A longitudinal retrospective observational study design was utilized. Briefly, deidentified data from all delivery records of adult women were obtained from the APHP for the years 2000-2009, and First Nations women were identified by AHW. Pregestational, past obstetrical, and delivery outcomes and problems were described and compared via t-tests and chi-square tests. Annual crude and age-adjusted (direct method) rates of diabetes in pregnancy by ethnicity were calculated and compared via chi-square analysis. Longitudinal changes in prevalence over time were computed and compared via Average Annual Percent Change (AAPC) analysis. The predictors of diabetes in pregnancy were explored via logistic regression analyses. Ethical approval was obtained from the Human Research Ethics Board of the University of Alberta. Women without diabetes (n = 407,855) Women with diabetes (n = 19,173) First Nations (n = 26,793) Non-First Nations (n = 381,092) First Nations (n = 1,513) Non-First Nations (n = 17,660) 24.7 (5.8) 8.1% (7.8-8.4) 6.9% (6.6-7.2) 51.8% (51.2-52.4) 0.4% (0.4-0.5) 10.8% (10.5-11.2) 0.9% (0.8-1.0) 0.1% (0.0-0.1) 28.7 (5.5)† 1.2% (1.2-1.3)† 15.2% (15.0-15.3)† 15.9 (15.8-16.0)† 0.6% (0.5-0.6)† 8.0% (7.9-8.1)† 0.9% (0.9-1.0) 0.1% (0.0-0.1) 28.9 (6.2) 2.7% (3.3-5.6) 20.0% (17.9-22.1) 52.5% (49.9-55.0) 0.7% (0.3-1.2) 31.7% (29.3-34.1) 4.2% (3.3-5.4) 0.3% (0.1-0.8) 31.6 (5.3)‡ 0.2% (0.2-0.3)‡ 30.0% (29.4-30.7)‡ 11.4% (10.9-11.9)‡ 0.7% (0.6-0.8) 18.4% (17.9-19.0)‡ 3.3% (3.0-3.5)‡ 0.1% (0.0-0.2)‡ Pre-existing Age (years) Age ≤ 17 Age ≥ 35 Rural Weight ≤ 45 kg Weight ≥ 91 kg Hypertension Chronic renal disease Past obstetrical Parity Preterm Neonatal death Stillbirth Abortion Cesarean section SGA LGA Major fetal anomaly 1.7 (1.9) 8.3% (7.9-8.7) 1.0% (0.9-1.1) 1.9% (1.7-2.0) 7.3% (6.9-7.6) 11.6% (11.2-11.9) 0.7% (0.6-0.8) 1.6% (1.4-1.74 0.8% (0.7-0.9) 0.9 (1.1)† 4.8% (4.7-4.9)† 0.5% (0.5-0.6)† 0.9% (0.8-0.9)† 4.9% (4.9-5.0)† 12.2% (12.1-12.3)† 0.7 % (0.6-0.7) 1.0% (1.00-1.1)† 0.6% (0.5-0.6)† 1.1 (1.4)‡ 7.9% (7.3-8.4)‡ 0.9% (0.8-1.1)‡ 2.2% (2.0-2.4)‡ 6.0% (5.7-6.4)‡ 18.9% (18.3-19.8) 0.7% (0.6-0.9)‡ 3.0% (2.7-3.2)‡ 0.8% (0.7-1.0) 2.2 (2.1) 12.8% (11.0-14.8) 1.7% (1.1-2.4) 5.0% (3.9-6.2) 9.1% (7.7-10.6) 20.2% (18.2-22.3) 0.3% (0.1-0.7) 6.9% (5.7-8.3) 1.1% (0.7-1.8) 2.9% (2.7-3.1) 4.4% (4.2-4.7) 2.4% (2.2-2.6) 1.2% (1.0-1.3) 2.3% (2.1-2.5) 13.8% (13.4-14.3) 54.7% (54.1-55.3) 0.9% (0.8-1.1) 9.5% (9.2-9.9) 6.6% (6.3-6.9) 2.9 (2.7) 10.4% (10.1-10.8) 3.4% (3.3-3.4)† 5.7% (5.6-5.7)† 1.9% (1.9-2.0)† 1.5% (1.4-1.5)† 0.6% (0.5-0.6)† 14.4% (14.3-14.6)† 17.0% (16.9-17.2)† 0.1% (0.0-0.1)† 1.6% (1.5-1.6)† 0.9% (0.8-0.9)† 2.1 (2.2)† 5.1% (5.1-5.2)† 3.5% (2.6-4.6) 8.1% (6.7-9.7) 5.6% (4.5-6.9) 1.5% (0.9-2.2) 1.3% (0.8-2.0) 5.1% (4.1-6.3) 49.4% (46.8-51.9) 0.6% (0.3-1.2) 7.2% (5.9-8.6) 3.5% (2.6-4.6) 5.6 (3.6) 30.7% (28.4-33.1) 3.9% (3.6-4.3) 12.2% (11.7-12.7) 3.9% (3.9-4.2)‡ 2.2% (2.0-2.5)‡ 0.5% (0.4-0.7)‡ 4.3% (4.1-4.7) 14.3% (13.8-14.8)‡ 0.1% (0.0-0.1)‡ 0.9% (0.8-1.04)‡ 0.4% (0.3-0.5)‡ 4.4 (3.0)‡ 19.8% (19.2-2.4)‡ 23.8% (23.1-24.3) 7.8 (2.0) 8.9 (1.4) 3411.5 (706.0) 8.0% (7.6-8.3) 16.7% (16.3-17.2) 38.5 (2.7) 71.2% (70.5-72.8) 9.2% (8.9-9.6) 1.2% (1.1-1.3) 8.6% (8.3-9.0) 1.8% (1.6-2.0) 19.1% (18.6-19.5) 0.9% (0.8-1.0) 27.3% (27.1-27.4)† 7.9 (1.7)† 8.8 (1.1)† 3338.5 (620.8)† 7.1% (7.0-7.2)† 11.1% (10.9-11.1)† 38.7 (2.4)† 88.3% (88.2-88.6)† 8.8% (8.7-8.9)† 0.7% (0.6-0.7)† 11.2% (11.1-11.3)† 1.5% (1.4-1.5)† 25.5% (25.4-25.6)† 0.6% (0.5-0.6)† 41.7% (39.2-44.2) 7.5 (2.1) 8.6 (1.6) 3577.5 (805.4) 7.2% (6.0-8.6) 29.3% (27.0-31.6) 37.8 (2.6) 74.7% (69.3-79.6) 17.3% (15.4-19.3) 2.1% (1.5-2.9) 16.7% (14.8-15.7) 1.4% (0.8-2.3) 35.4% (33.0-37.8) 0.9% (0.5-1.5) 40.9% (40.2-41.7) 7.8 (1.9)‡ 8.8 (1.1)‡ 3326.8 (65.1)‡ 8.6% (8.2-9.0) 12.9% (12.4-13.4)‡ 38.0 (2.1)‡ 86.3% (85.4-87.1)‡ 14.7% (14.2-15.3)‡ 0.6% (0.5-0.8)‡ 19.4% (18.8-20.0)‡ 1.7% (1.5-2.1) 39.8% (39.0-40.9)‡ 0.4% (0.3-0.5)‡ First Nations Non-First Nations Rate ratio* p-value In general, First Nations women tended to have more risk factors and poorer outcomes than non-First Nations (Table 1). The majority of these differences by ethnicity persisted when comparing only those pregnancies affected by diabetes. Among First Nations women alone, those with diabetes tended to have more pregnancy risk factors and poorer outcomes. As opposed to those women with GDM, those with pregestational diabetes were more likely to have antenatal risk factors and adverse infant outcomes (data not shown). Both overall crude and age-adjusted GDM and pregesational diabetes prevalence were significantly elevated for First Nations women in contrast to non-First Nations women (Table 2). * First Nations-to-non-First Nations 8 7 6 5 4 3 2 First Nations B Non First Nations 25 20 15 10 5 0 0 2000 2001 2002 2003 2004 2005 2006 2007 4.3% (4.26-4.38) 4.9% (4.16-4.63) 1.0% (1.01-1.03) 1.1% (0.76-1.49) 3.8% (3.77-3.89) 4.8% (4.60-4.98) 0.6% (0.58-0.62) 0.7% (0.60-0.75) 6.1% (5.99-6.13) 6.9% (6.79-6.94) 1.5% (1.43-1.50) 1.4% (1.33-1.39) 3.8% (3.74-3.85) 4.6% (4.58-4.70) 0.6% (0.57-0.62) 0.7% (0.64-0.71) 2008 2009 2000 2001 2002 2003 2004 2005 2006 2007 2008 2009 Table 3. Ethnicity comparisons of GDM and pregestational diabetes prevalence over time in Alberta, 2000-2009. Values are AAPC (95% CI) in age-adjusted rates. First Nations Non-First Nations 1.51 (-2.04-5.20) 1.55 (-4.68-8.19) GDM 4.48*† (2.88-6.11) 1.35 (-0.38-3.12) p < 0.05 for AAPC; † p < 0.05 for difference in AAPC between ethnicities In addition to previously identified risk factors (age ≥ 35, weight ≥ 91 kg, hypertension, First Nations ethnicity), history of stillbirth, history of cesarean section, history of abortion, history of LGA infant, and proteinuria are also independent novel predictors of diabetes in pregnancy (Table 4). Table 4. Multivariate predictors of GDM and pregestational diabetes among Albertan women by ethnicity. Values are ORs (95% CI). First Nations ethnicity Rural residence Age ≤ 17 Age ≥ 35 Weight ≥ 91 kg Pre-existing hypertension History of stillbirth History of abortion History of cesarean section History of SGA History of LGA Proteinuria Smoker Alcohol anytime‡ All women (n = 427,058) OR (95% CI) OR (95% CI) for pregestational for GDM diabetes 1.47 1.73 † (1.38-1.57) (1.52-1.96) 0.69 -(0.66-0.73)† 0.35 0.29 (0.28-0.45)† (0.16-0.52)† 2.34 1.57 † (2.26-2.42) (1.43-1.72)† 2.51 2.31 † (2.40-2.61) (2.10-2.54)† 1.63 4.45 † (1.45-1.84) (3.82-5.43)† 1.96 2.56 † (1.75-2.18) (2.07-3.18)† 1.42 -(1.23-1.64)† 1.37 1.76 † (1.32-1.43) (1.61-1.94)† 0.53 -(0.29-0.96)† 2.79 -(2.31-3.39)† 1.61 2.62 † (1.48-1.76) (2.23-3.08)† 0.90 -(0.86-0.94)† 0.51 -(0.41-0.63)† 0.68 -(0.50-0.93)† First Nations (n = 28,306) OR (95% CI) for GDM OR (95% CI) for pregestational diabetes -- -- -- -- 0.48 (0.34-0.67)† 2.81 (2.41-3.27)† 2.93 (2.56-3.33)† 1.40 (1.20-1.63)† 0.42 (0.18-0.94)† 2.23 (1.64-3.02)† 3.25 (2.52-4.18)† 5.09 (3.03-8.58)† 3.05 (1.93-4.81)† 1.58 (1.11-2.25)† 1.88 (1.41-2.47)† -- -- 2.58 (1.99-3.35)† 1.85 (1.40-2.44)† 3.23 (2.10-4.97)† 2.05 (1.26-3.32)† -- -- 0.54 (0.39-0.74)† -- -- -- -1.76 (1.30-2.38)† -- Compared to age 18-34; † p < 0.01 for OR; ‡ To reduce co-linearity, the variables alcohol ≥ 1 drink per day and alcohol ≥ 3 drinks ever were combined 1.1 < 0.001 1.0 0.861 1.7 < 0.001 1.6 < 0.001 1.6 < 0.001 Although First Nations women in Alberta suffer higher overall diabetes in pregnancy prevalence, the longitudinal stability of rates is encouraging. However, as high-risk pregnancies and poor outcomes are more common among First Nations women, particularly those with diabetes, efforts must be made to improve pregnancy care. 1.5 < 0.001 REFERENCES 2.5 < 0.001 1. Young TK et al. CMAJ. 2000;163(5):561-6. 2.0 < 0.001 Age-adjusted GDM (all years) GDM (2009) Pregestational diabetes (all years) Pregestational diabetes (2009) First Nations Non First Nations A 9 Drug dependant Crude Between 2000-2009 there were 433,445 pregnancies in Alberta. Diabetes category was missing for some records (n = 6,387), thus 427,058 pregnancy records were explored, of which 28,306 (6.6%) were First Nations women. 30 Variable Table 2 Crude and age-adjusted prevalence of GDM and pregestational diabetes for all years (n = 427,058) and most recent year of data (2009; n = 51,231) by ethnicity in Alberta. Values are prevalence per 100 (95% CI). GDM (all years) GDM (2009) Pregestational diabetes (all years) Pregestational diabetes (2009) 10 Pregestational diabetes Significant difference (p < 0.05) between First Nations without diabetes and First Nations with diabetes; † Significant difference (p < 0.05) between First Nations and non-First Nations without diabetes; ‡ Significant difference (p < 0.05) between First Nations and non-First Nations with diabetes RESULTS Figure 1. Age-adjusted prevalence of diabetes in pregnancy over time by ethnicity in Alberta, 2000-2009. A = GDM prevalence; B = Pregestational diabetes prevalence. 1 Current pregnancy Multiple pregnancy PIH Proteinuria Insufficient weight gain Anemia Pregnancy ≥ 41 weeks Smoker Alcohol ≥ 1 drink/day Alcohol ≥ 3 drinks ever Drug dependant Antepartum risk score Antepartum risk ≥ 7 Labour and newborn outcomes Induction of labour APGAR 1 min APGAR 5 min Birth weight (g) LBW HBW Gestational age (m) Breastfeeding Preterm Stillbirth NICU admission Congenital anomaly Cesarean section Vaginal breech Between 2000 and 2009, age-adjusted prevalence rates of GDM increased significantly only among non-First Nations women (Table 3, Figure 1). Prevalence of pregestational diabetes did not increase longitudinally among either First Nations or non-First Nations women, and no between group differences (parallelism) were noted. Rate per 1000 x It is believed that a complex combination of social, cultural, environmental and genetic factors have led to Canadian First Nations populations suffering type 2 diabetes rates that are reportedly 2-5 times higher than the non-First Nations population (1, 2), with First Nations women being excessively affected (3). In attempts to understand the causes of this epidemic, the possible contribution of diabetes in pregnancy, particularly gestational diabetes mellitus (GDM), has received recent attention. In First Nations populations, it is suggested that diabetes in pregnancy contributes to a vicious cycle by increasing the risk of type 2 diabetes in both offspring and mothers (4). Driving this cycle is increasing obesity prevalence in the younger age groups, coupled with a decrease in the average age of diabetes diagnosis among First Nations individuals (3, 5). Moreover, fertility/birth rates are 1.5-2 times that of the nonFirst Nations population (6). Hence, pregnancy may be a crucial point for interventions and appropriate healthcare aimed at ultimately reducing type 2 diabetes rates in First Nations peoples. Yet, the extent of the problem has not been well explored nor addressed. Table 1. Maternal characteristics, antenatal risk factors and pregnancy outcomes of pregnancies (n = 427,058) by ethnicity and diabetes in pregnancy status in Alberta, 2000-2009. Values are prevalence per 100 (95% CI) or mean (SD) as appropriate. x INTRODUCTION Department of Medicine, University of Alberta Rate, % Richard T. Oster and Ellen L. Toth IMPLICATIONS 3. Dyck R et al. CMAJ. 2010;182(3):249-56. 5. Shields M. Statistics Canada; 2006. 7. Creswell J, Plano Clark VL. SAGE Publications; 2011. 2. King M et al. Lancet. 2009;374(9683):76-85. 4. Osgood ND et al. Am J Public Health. 2011;101(1):173-9. 6. Statistics Canada; 2006.