
Recommended
More Related Content
What's hot
What's hot (20)
Viewers also liked
Viewers also liked (11)
Similar to Trends in diabetes-related health indicators in Aboriginal communities in Norhtern Alberta
Similar to Trends in diabetes-related health indicators in Aboriginal communities in Norhtern Alberta (20)
More from Kelli Buckreus
More from Kelli Buckreus (18)
Recently uploaded
Recently uploaded (20)
Trends in diabetes-related health indicators in Aboriginal communities in Norhtern Alberta
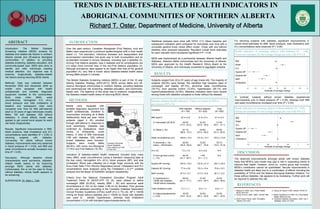
- 1. TRENDS IN DIABETES-RELATED HEALTH INDICATORS IN ABORIGINAL COMMUNITIES OF NORTHERN ALBERTA Richard T. Oster, Department of Medicine, University of Alberta -1.5 -1 -0.5 0 0.5 1 1.5 -2 -1.5 -1 -0.5 0 0.5 1 1.5 2 k ABSTRACT Introduction: The Mobile Diabetes Screening initiative (MDSi) screens for diabetes and related risk factors in northern Alberta remote and off-reserve Aboriginal communities. In addition to providing diabetes screening, diabetes education, and community-based care, MDSi also aims to identify and refer individuals needing medical attention. Our objective was to examine, longitudinally, diabetes-related risk factors among returning MDSi clients. Methods: Data was collected between November 2003 and December 2009 as mobile vans equipped with health professionals and portable diagnostic equipment traveled to the communities. Body mass index (BMI), waist circumference, hemoglobin A1c (A1c), blood pressure and total cholesterol at baseline and subsequent visits were compared over time for 809 self-referred adult (≥ 20 years of age) individuals (mostly Métis; 180 with diabetes; 629 without diabetes). A mixed effects model was applied to get overall trend slopes for each risk factor longitudinally. Results: Significant improvements in BMI, blood pressure, total cholesterol and A1c concentrations were identified (P < 0.05) in returning subjects with diabetes. Conversely, for clients without known diabetes, improvements were only observed in blood pressure (P < 0.05), and BMI and waist circumference actually increased over time (P < 0.05). Discussion: Although baseline clinical characteristics were worrisome, diabetes- related health seems to be improving amongst MDSi clients with diabetes. Unfortunately, this is not the case for those without diabetes, whose health appears to be worsening. SUPERVISOR: Dr. Ellen L. Toth KS INTRODUCTION Over the past century, Canadian Aboriginals (First Nations, Inuit and Métis) have experienced a profound epidemiological shift in their health status (1). The starvation, infectious diseases and depopulation that accompanied colonization has given way to both re-population and an accelerated increase in chronic diseases, including type 2 diabetes (2). Among First Nations peoples, type 2 diabetes and its complications are 2-5 times more common than in the non-First Nations population (3). Although prevalence rates appear to be higher than that of the general population (4), very little is known about diabetes-related health status among Métis people in Canada. The Mobile Diabetes Screening initiative (MDSi) is part of the 10 year Alberta Diabetes Strategy (2003-2013). MDSi serves Métis and off- reserve Aboriginal communities in northern Alberta, providing diabetes and cardiovascular risk screening, diabetes education, and community- based care. The objective of this study was to examine, longitudinally, the diabetes-related health status of returning MDSi clients. Statistical analyses were done with SPSS 17.0. Mean baseline and subsequent indicators were compared for individuals over time with a univariate general linear mixed effect model. Those with and without diabetes were analyzed separately. Resultant overall trend estimates for each indicator were considered significant if P < 0.05. MDSi was implemented as a partnership between Alberta Health and Wellness, Alberta’s Métis communities and the University of Alberta. MDSi was approved by the Health Research Ethics Board at the University of Alberta, and individuals consented to aggregate analysis. Mobile vans, equipped with portable diagnostic equipment and health professionals, travelled to communities (including all 8 Métis Settlements) twice per year. Adult subjects (aged ≥ 20) enrolled through self-referral in response to local advertising. Diabetes was confirmed by medications, chart review, or infrequently, nurse history. A total of 809 individuals (180 with diabetes, 629 without known diabetes) were included. Subjects were mostly Métis (65.8%), with some non-Aboriginal (17.9%) and First Nations (16.3%). Indicators of diabetes-related health measured included body mass index (BMI), waist circumference (using a standard measuring tape at the iliac crest), hemoglobin A1c (A1c), blood pressure (BP), and total cholesterol. Blood was collected via a single finger puncture with the Accu-Chek Safe-T-Pro (Roche Diagnostics) lancet. Cholesterol and A1c concentrations were analyzed using the Cholestech L.D.X™ portable analyzer and the Bayer DCA2000®+ analyzer respectively. Criteria from the National Cholesterol Education Program Adult Treatment Panel III (NCEP-ATP III) (5), were utilized to define overweight (BMI 25-29.9), obesity (BMI 30) and abnormal waist circumference (≥ 102 cm for males; ≥ 88 cm for females). Poor glucose control was assessed according to the Canadian Diabetes Association Clinical Practice Guidelines (CPGs) cutoff (A1c ≥ 7%) (6). BP ≥ 140/90 mmHg for those without diabetes and ≥ 130/80 for those with diabetes was used to identify hypertension, whereas total cholesterol concentration ≥ 5.24 mM indicated hypercholesterolemia (5). For returning subjects with diabetes, significant improvements in overall trend estimates for BMI, blood pressure, total cholesterol and A1c concentrations were observed (P < 0.05). DISCUSSION The observed improvements amongst adults with known diabetes imply that MDSi’s care model may play a role in supporting clients to improve their health. However, since no control group was included, MDSi’s contribution cannot be quantitated. Secular improvements in diabetes health are likely due to a combination of effects including the availability of CPGs and the federal Aboriginal Diabetes Initiative. For those without diabetes, risk appears to be increasing. Further work will be required to address this risk. REFERENCES 1. Adelson N. 2005. Can J Public Health. 2. Gracey M, King M. 2009. Lancet. 374:65-75. 96(S2):S45-S61. 3. Young TK et al. 2000. CMAJ. 163:561-566. 4. Ralph-Campbell et al. 2009. Int J Circumpolar Health. 68(5):433-442. 5. NCEP Expert Panel. 2002. Circulation . 6. Canadian Diabetes Association. 2008. Can J 106(25):3143-3421. Diabetes. 32(S1):S1-S201. In contrast, subjects without known diabetes experienced improvements only in blood pressure (P < 0.05), whereas both BMI and waist circumference increased over time (P < 0.05). BMI Waist A1c Systolic BP Diastolic BP MAP Cholesterol BMI Waist A1c Systolic BP Diastolic BP MAP Cholesterol Health indicators of returning subjects with diabetes (N = 180). Values are estimates for the average change per year with 95% CI. Baseline diabetes health indicators. Values are means (± SD) or prevalences (95% CI). Health indicators of returning subjects without diabetes (N = 629). Values are estimates for the average change per year with 95% CI. RESULTS Subjects ranged from 20 to 91 years of age (mean 49). The majority of subjects (69.0%) were female. We identified high baseline rates of overweight and obesity (87.3%), abnormal waist circumference (78.7%), poor glucose control (12.6%), hypertension (26.1%) and hypercholesterolemia (33.8%). Baseline indicators were more severe among those with diabetes compared to those without the disease. Estimate of average change Estimate of average change METHODS Canadian Aboriginal Issues Database, www.ualberta.ca/~wall d/map.html Variables With diabetes (N = 180) Without diabetes (N = 629) Total (N = 809) BMI (kg/m2) % Overweight (25-29.9) % Obese (≥ 30) 33.4 ± 6.2 29.5% (17.0 - 42.0) 67.1% (58.6 - 75.7) 31.0 ± 6.3 32.0% (25.6 - 38.4) 52.8% (47.4 - 58.2) 31.5 ± 6.3 31.4% (25.7 - 37.1) 55.9% (51.3 - 60.5) Waist circumference (cm) % Abnormal (≥ 102 males; ≥ 88 females) 108.6 ± 13.9 95.9% (92.9 - 98.9) 101.6 ± 14.7 72.8% (68.7 - 76.9) 103.2 ± 14.8 78.7% (75.5 - 81.9) A1c (%) % Poor glucose control ( ≥ 7%) 7.3 ± 1.6 50.0% (41.3 - 58.7) 5.5 ± 0.8 1.6% (0.1 - 3.1) N A N A Systolic BP (mmHg) Diastolic BP (mmHg) MAP (mmHg) % Hypertensive (≥ 130/80 with diabetes; 140/90 without diabetes) 136.9 ± 19.0 77.4 ± 9.8 97.3 ± 12.1 69.5% (61.3 - 77.7) 123.8 ± 21.4 75.3 ± 10.4 91.5 ± 12.6 21.8% (14.9 - 28.7) 126.7 ± 20.3 75.8 ± 10.3 92.7 ± 12.4 32.3% (26.6 - 38.0) Total cholesterol (mM) % Hypercholesterolemia (≥ 5.24) 4.7 ± 1.1 30.8% (18.4 - 43.2) 4.9 ± 1.1 34.6% (28.3 - 40.9) 4.8 ± 1.1 33.8% (28.1 - 39.5)