The document discusses trends in US debt levels from 1966-2012 under different presidential administrations. It notes that debt incurred per dollar of GDP grew substantially under Reagan, reaching 50 cents per dollar of GDP by the end of his term. Under George W. Bush, debt levels grew further to 66 cents per dollar of GDP. Under Obama, debt has grown the fastest of any president, reaching $1.02 per dollar of GDP currently and $2.84 total for his first term. However, economic indicators like jobs, incomes and stock prices have not improved commensurately with the increased borrowing.
1. $0.00
$0.10
$0.20
$0.40
$0.50
$0.60
$0.70
$0.90
$0.30
$0.80
1966-01-01
1967-02-01
1968-03-01
1969-04-01
1970-05-01
1971-06-01
1972-07-01
1973-08-01
1974-09-01
1975-10-01
1976-11-01
1977-12-01
1979-01-01
1980-02-01
1981-03-01
1982-04-01
1983-05-01
1984-06-01
1985-07-01
1986-08-01
1987-09-01
1988-10-01
1989-11-01
1990-12-01
1992-01-01
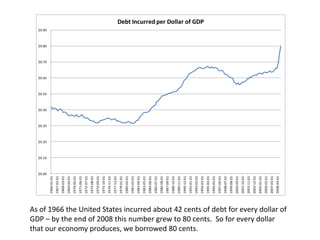
that our economy produces, we borrowed 80 cents.
1993-02-01
Debt Incurred per Dollar of GDP
1994-03-01
1995-04-01
1996-05-01
1997-06-01
1998-07-01
1999-08-01
2000-09-01
2001-10-01
2002-11-01
2003-12-01
2005-01-01
2006-02-01
2007-03-01
GDP – by the end of 2008 this number grew to 80 cents. So for every dollar
2008-04-01
As of 1966 the United States incurred about 42 cents of debt for every dollar of
2. $0.00
$0.10
$0.30
$0.40
$0.50
$0.60
$0.20
1980-04-01
1980-07-01
1980-10-01
1981-01-01
1981-04-01
1981-07-01
1981-10-01
1982-01-01
1982-04-01
1982-07-01
1982-10-01
1983-01-01
1983-04-01
1983-07-01
1983-10-01
1984-01-01
1984-04-01
1984-07-01
1984-10-01
1985-01-01
1985-04-01
1985-07-01
1985-10-01
cents for every dollar that the US economy generated.
1986-01-01
1986-04-01
1986-07-01
Dollar of Debt per Dollar of GDP Under Reagan
1986-10-01
1987-01-01
1987-04-01
1987-07-01
1987-10-01
1988-01-01
1988-04-01
1988-07-01
Under President Reagan, this number grew from about 32 cents per dollar of
GDP to just over 50 cents. During his presidency, Ronald Reagan borrowed 71
1988-10-01
1989-01-01
3. Dollar of Debt per Dollar of GDP Under Bush II
$0.68
$0.66
$0.64
$0.62
$0.60
$0.58
$0.56
$0.54
$0.52
$0.50
2001-04-01
2001-10-01
2002-01-01
2002-04-01
2002-10-01
2003-01-01
2003-04-01
2003-07-01
2003-10-01
2004-01-01
2004-04-01
2004-07-01
2005-01-01
2005-04-01
2005-07-01
2005-10-01
2006-01-01
2006-04-01
2006-07-01
2006-10-01
2007-04-01
2007-07-01
2007-10-01
2008-01-01
2008-04-01
2008-07-01
2008-10-01
2009-01-01
2001-07-01
2002-07-01
2004-10-01
2007-01-01
Under George W. Bush, this number continued to grow, as we borrowed 66
cents for every dollar of GDP by the end of his second term. In 8 years, George
W. Bush borrowed $1.42 for every dollar that our economy generated – this
means that we were growing our debt faster than our economy was growing
4. $0.00
$0.20
$0.40
$0.60
$0.80
$1.00
$1.20
2009-04-01
2009-05-01
2009-06-01
2009-07-01
2009-08-01
2009-09-01
2009-10-01
2009-11-01
2009-12-01
2010-01-01
2010-02-01
2010-03-01
2010-04-01
2010-05-01
2010-06-01
2010-07-01
2010-08-01
2010-09-01
2010-10-01
2010-11-01
2010-12-01
2011-01-01
2011-02-01
2011-03-01
2011-04-01
2011-05-01
2011-06-01
Dollar of Debt per Dollar of GDP Under Obama
2011-07-01
2011-08-01
2011-09-01
2011-10-01
2011-11-01
2011-12-01
2012-01-01
2012-02-01
2012-03-01
Obama has borrowed $2.84 for every dollar generated by our economy.
compounded annual growth rate of 6.4%. Since he took office, President
dollar that our economy generates. In 4 years, this number has grown at a
2012-04-01
The United States, under President Obama, is now borrowing $1.02 for every
5. Here is a Side-by-Side Comparison of
Each President’s First Term
5000.0 $2.84 $3.00
4500.0
$2.50
4000.0
3500.0
$2.00
3000.0
2500.0 $1.50
2000.0
$0.81 $1.00
1500.0 $0.72
$0.57
1000.0
$0.50
500.0
0.0 $0.00
Reagan Clinton GWB Obama
Incremental GDP Incremental Debt Debt per Dollar of GDP (Right Axis)
8. More Full-Time Jobs?
Non-Farm Payrolls: Full-Time Jobs
117,000
116,000
115,000
114,000
113,000
112,000
111,000
110,000
109,000
108,000
107,000
Oct-09
Oct-10
Oct-11
Apr-09
Apr-10
Apr-11
Apr-12
Jan-09
Jan-12
Jan-10
Jan-11
Jul-09
Jul-12
Jul-10
Jul-11
We in Fact have LESS Full-time Jobs – All
the Jobs Created Since 2009 Have Been
Part-Time Jobs
9. At Least Reagan Created Some Jobs
with The Debt he Incurred
Non-Farm Payrolls
108,000
106,000
104,000
102,000
100,000
98,000
96,000
94,000
Oct-81
Oct-82
Oct-83
Apr-81
Apr-82
Apr-83
Apr-84
Jan-81
Jan-84
Jan-82
Jan-83
Jul-81
Jul-84
Jul-82
Jul-83
An Increase of 5.5 Million Jobs at the
Same Point in His Presidency – 4.5
Million of Which Were Full-time Jobs
11. 0.00
0.20
0.40
0.60
0.80
1.00
1.20
2009-01-01
2009-04-01
2009-07-01
2009-10-01
2010-01-01
2010-04-01
2010-07-01
2010-10-01
2011-01-01
2011-04-01
2011-07-01
S&P 500 Priced in Gold
2011-10-01
Gold than in 2009! 2012-01-01
2012-04-01
2012-07-01
2012-10-01
One Share of the S&P 500 Buys LESS
Not When Priced in Ounces of Gold!
12. And Not When Priced in Barrels of Oil!
S&P 500 Priced in Oil
25.0
20.0
15.0
10.0
5.0
0.0
One Share of the S&P 500 Buys 25%
LESS Oil than in January of 2009!
13. But Personal Incomes are up, Right?
Real Disposable Personal Income
$10,400
$10,300
$10,200
$10,100
$10,000
$9,900
$9,800
$9,700
$9,600
$9,500
$9,400
$9,300
2009-01-01
2009-04-01
2009-07-01
2010-01-01
2010-07-01
2010-10-01
2011-01-01
2011-04-01
2011-10-01
2012-04-01
2012-07-01
2009-10-01
2010-04-01
2011-07-01
2012-01-01
By .72% Per Year – Less Than the Rate
of Inflation
14. Is This What a Recovery Looks Like?
Labor Force Participation Rate
66.0%
65.5%
65.0%
64.5%
64.0%
63.5%
63.0%
62.5%
62.0%
Oct-09
Oct-10
Oct-11
Apr-10
Apr-11
Apr-09
Apr-12
Jan-10
Jan-11
Jan-09
Jan-12
Jul-09
Jul-10
Jul-11
Jul-12
15. Perhaps a Longer View Might Help
Labor Force Participation Rate is the
Lowest it’s Been in 30 Years
16. Four Years of Hope and Reckless
Borrowing and Spending…
AND NO NEW JOBS
WE NEED MORE THAN HOPE
17. Sources
• Federal Reserve Economic Data
– http://research.stlouisfed.org/datatools.html
• Bureau of Labor and Statistics
– http://bls.gov/webapps/legacy/cpsatab9.htm