SlideShare une entreprise Scribd logo
1  sur  8
Télécharger pour lire hors ligne
Cedars Neighborhood 2011 Crime Survey


As part of the new crime / quality of life committee, we are exploring block captain scenarios. Please
review neighborhood regions map to selection your region.

                                                                    Region 1                       21%
                                                                    Region 2                       16%
                                                                    Region 3                       5%
                                                                    Region 4                       9%
                                                                    Region 5                       32%
                                                                    Region 6                       2%
                                                                    Region 7                       0%
                                                                    Region 8                       2%
                                                                    Region 9                       13%
Please check the space that best describes the type of crime(s) concerns occuring in your community.


                                                          Burglary (Residential/Business)     31    57%
                                                          Theft (BMV)                         36    67%
                                                          Auto Theft                          13    24%
                                                          Disturbance (Disorderly Conduct,
                                                           Loud Music)                        35    65%
                                                          Drugs/Drug Location                 39    72%
                                                          Loitering                           46    85%
                                                          Vacant houses (Code Violation/
                                                          Squatters)                          29    54%
                                                          Speeding                            15    28%
                                                          Gunfire (Shooting)                  8     15%
                                                          Gambling                            3     6%
                                                          Criminal Mischief                   19    35%
                                                          Motel (Criminal Activity)           9     17%
                                                          Prostitution (male)                 18    33%
                                                          Prostitution (female)               18    33%
                                                          None                                0     0%
                                                          Other                               8     15%
                                                          People may select more than one checkbox,
                                                          so percentages may add up to more than 100%.
Do you feel you have adequate
police patrol in your area?


Yes            18     32%
No             32     57%


 Is there a good relation be-
 tween your community and
 Police Department?


 Yes            48     86%
 No             7      13%


 Do you know the Neighbor-
 hood Police Office (NPO) for
 your area?


Yes            24      43%
No             31      55%


Do you belong to a Crime
Watch Group or Neighbor-
hood Association?


 Yes            40     71%
 No             16     29%
Do you have a contact person
        within the Dallas Police De-
        partment?


        Yes            32        57%
        No             24        43%


 When was the last time you spoke or
 met with an officer?


 None                  8         14%
 1-3 month             29        52%
 4-6 month             5         9%
 7-9 month             5         9%
 Over a year           2         4%
 Other                 7         13%


What type of contact did you have with
police if any? (Check as man as apply)


None                         8         15%
Reporting a neighborhood
disturbance                  24        45%
Victim of crime (example;
burglary, theft, assault)    8         15%
Witness a crime              10        19%
Trafic Violation             2         4%
Other                        22        42%
Please describe your contact with police in your neighbrohood if any?

                                                                        None                4     7%
                                                                        Courteous           47    84%
                                                                        Rude                1     2%
                                                                        Indifferent         4     7%


 Please rate the police response time in your communit


                                                                        None           3    5%
                                                                        Good           15   27%
                                                                        Satisfactory   27   48%
                                                                        Poor           8    14%


                                                                         Apartment     3    5%
                                                                         House         8    14%
                                                                         Business      4    7%
                                                                         Townhome      15   27%
                                                                         Condo         15   27%
                                                                         Other         11   20%
Age Group
            17-19       0     0%
            20-29       4     7%
            30-49       31    55%
            50-64       20    36%
            65+         1     2%
            Other       0     0%


            Male        35    63%
            Female      21    38%


             Single      23    41%
             Married     27    48%
             Children    0     0%
             Other       6     11%
Truancy                      5      11%
                                Gang Activity                9      19%
Juvenile Issues                 Curfew Violations            6      13%
                                Graffiti                     34     72%
                                None                         9      19%
                                Other                        6      13%
                                People may select more than one checkbox, so
                                percentages may add up to more than 100%.


Please rank additional neigh-    Litter                       45     92%
borhood concerns                 Code violations              34     69%
                                 Encampments                  37     76%
                                 18-wheeler / Truck traffic
                                 (i.e. parking on empty lots) 28     57%
                                 Other                        8      16%
                                 People may select more than one checkbox, so
                                 percentages may add up to more than 100%.
2011 Crime Survey

Contenu connexe

Similaire à 2011 Crime Survey

Corruption Trends in Serbia
Corruption Trends in SerbiaCorruption Trends in Serbia
Corruption Trends in SerbiaUNDP Eurasia
 
Univision Poll Results
Univision Poll Results Univision Poll Results
Univision Poll Results univisionnews
 
iPinion panel_statistics
iPinion panel_statisticsiPinion panel_statistics
iPinion panel_statisticsabirami4631
 
Access of Children with Disabilities to Education, Health and Social Protecti...
Access of Children with Disabilities to Education, Health and Social Protecti...Access of Children with Disabilities to Education, Health and Social Protecti...
Access of Children with Disabilities to Education, Health and Social Protecti...Meri Poghosyan
 
Questionnaire analysis
Questionnaire analysisQuestionnaire analysis
Questionnaire analysisJaspreetB
 
Questionnaire analysis
Questionnaire analysisQuestionnaire analysis
Questionnaire analysisJaspreetB
 
Questionnaire analysis
Questionnaire analysisQuestionnaire analysis
Questionnaire analysisJaspreetB
 
Civil Beat Poll August 2012 Primary Contest By Contest Crosstabs
Civil Beat Poll August 2012 Primary Contest By Contest CrosstabsCivil Beat Poll August 2012 Primary Contest By Contest Crosstabs
Civil Beat Poll August 2012 Primary Contest By Contest CrosstabsHonolulu Civil Beat
 
Green Hill Regional Planning Commission Broadband Study Findings
Green Hill Regional Planning Commission Broadband Study FindingsGreen Hill Regional Planning Commission Broadband Study Findings
Green Hill Regional Planning Commission Broadband Study Findingsmobroadbandnow
 
Pioneer Trails Regional Planning Commission Broadband Study Findings
Pioneer Trails Regional Planning Commission Broadband Study FindingsPioneer Trails Regional Planning Commission Broadband Study Findings
Pioneer Trails Regional Planning Commission Broadband Study Findingsmobroadbandnow
 

Similaire à 2011 Crime Survey (12)

Keypad results mtg 2
Keypad results mtg 2Keypad results mtg 2
Keypad results mtg 2
 
Corruption Trends in Serbia
Corruption Trends in SerbiaCorruption Trends in Serbia
Corruption Trends in Serbia
 
Univision Poll Results
Univision Poll Results Univision Poll Results
Univision Poll Results
 
Crime0607summ
Crime0607summCrime0607summ
Crime0607summ
 
iPinion panel_statistics
iPinion panel_statisticsiPinion panel_statistics
iPinion panel_statistics
 
Access of Children with Disabilities to Education, Health and Social Protecti...
Access of Children with Disabilities to Education, Health and Social Protecti...Access of Children with Disabilities to Education, Health and Social Protecti...
Access of Children with Disabilities to Education, Health and Social Protecti...
 
Questionnaire analysis
Questionnaire analysisQuestionnaire analysis
Questionnaire analysis
 
Questionnaire analysis
Questionnaire analysisQuestionnaire analysis
Questionnaire analysis
 
Questionnaire analysis
Questionnaire analysisQuestionnaire analysis
Questionnaire analysis
 
Civil Beat Poll August 2012 Primary Contest By Contest Crosstabs
Civil Beat Poll August 2012 Primary Contest By Contest CrosstabsCivil Beat Poll August 2012 Primary Contest By Contest Crosstabs
Civil Beat Poll August 2012 Primary Contest By Contest Crosstabs
 
Green Hill Regional Planning Commission Broadband Study Findings
Green Hill Regional Planning Commission Broadband Study FindingsGreen Hill Regional Planning Commission Broadband Study Findings
Green Hill Regional Planning Commission Broadband Study Findings
 
Pioneer Trails Regional Planning Commission Broadband Study Findings
Pioneer Trails Regional Planning Commission Broadband Study FindingsPioneer Trails Regional Planning Commission Broadband Study Findings
Pioneer Trails Regional Planning Commission Broadband Study Findings
 

2011 Crime Survey

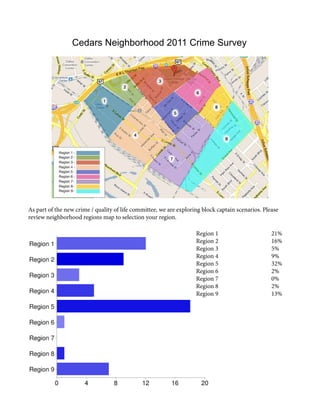
  • 1. Cedars Neighborhood 2011 Crime Survey As part of the new crime / quality of life committee, we are exploring block captain scenarios. Please review neighborhood regions map to selection your region. Region 1 21% Region 2 16% Region 3 5% Region 4 9% Region 5 32% Region 6 2% Region 7 0% Region 8 2% Region 9 13%
  • 2. Please check the space that best describes the type of crime(s) concerns occuring in your community. Burglary (Residential/Business) 31 57% Theft (BMV) 36 67% Auto Theft 13 24% Disturbance (Disorderly Conduct, Loud Music) 35 65% Drugs/Drug Location 39 72% Loitering 46 85% Vacant houses (Code Violation/ Squatters) 29 54% Speeding 15 28% Gunfire (Shooting) 8 15% Gambling 3 6% Criminal Mischief 19 35% Motel (Criminal Activity) 9 17% Prostitution (male) 18 33% Prostitution (female) 18 33% None 0 0% Other 8 15% People may select more than one checkbox, so percentages may add up to more than 100%.
  • 3. Do you feel you have adequate police patrol in your area? Yes 18 32% No 32 57% Is there a good relation be- tween your community and Police Department? Yes 48 86% No 7 13% Do you know the Neighbor- hood Police Office (NPO) for your area? Yes 24 43% No 31 55% Do you belong to a Crime Watch Group or Neighbor- hood Association? Yes 40 71% No 16 29%
  • 4. Do you have a contact person within the Dallas Police De- partment? Yes 32 57% No 24 43% When was the last time you spoke or met with an officer? None 8 14% 1-3 month 29 52% 4-6 month 5 9% 7-9 month 5 9% Over a year 2 4% Other 7 13% What type of contact did you have with police if any? (Check as man as apply) None 8 15% Reporting a neighborhood disturbance 24 45% Victim of crime (example; burglary, theft, assault) 8 15% Witness a crime 10 19% Trafic Violation 2 4% Other 22 42%
  • 5. Please describe your contact with police in your neighbrohood if any? None 4 7% Courteous 47 84% Rude 1 2% Indifferent 4 7% Please rate the police response time in your communit None 3 5% Good 15 27% Satisfactory 27 48% Poor 8 14% Apartment 3 5% House 8 14% Business 4 7% Townhome 15 27% Condo 15 27% Other 11 20%
  • 6. Age Group 17-19 0 0% 20-29 4 7% 30-49 31 55% 50-64 20 36% 65+ 1 2% Other 0 0% Male 35 63% Female 21 38% Single 23 41% Married 27 48% Children 0 0% Other 6 11%
  • 7. Truancy 5 11% Gang Activity 9 19% Juvenile Issues Curfew Violations 6 13% Graffiti 34 72% None 9 19% Other 6 13% People may select more than one checkbox, so percentages may add up to more than 100%. Please rank additional neigh- Litter 45 92% borhood concerns Code violations 34 69% Encampments 37 76% 18-wheeler / Truck traffic (i.e. parking on empty lots) 28 57% Other 8 16% People may select more than one checkbox, so percentages may add up to more than 100%.