SlideShare une entreprise Scribd logo
1  sur  4
Télécharger pour lire hors ligne
September 20, 2012
Analysis of regional data from the US Census Bureau 2011 
American Community Survey
For More Information Call (619) 584‐5744 or Visit OnlineCPI.org 1
Earnings for full‐time, year‐round work in San Diego County, in order of median earnings
Key findings:
• Full‐time, year‐round employees in most of the region's biggest industries were earning 
less or about the same as five years earlier, adjusting for inflation. 
• On average, all households lost $2,337 in purchasing power from 2010 to 2011, when the 
midpoint of household income throughout the County dropped to $59,477. 
• The poverty rate rose to 15.1% of San Diego County's population, from 14.8% in 2010. 
Of the 462,269 people living below the federal poverty level in 2011, 137,084 were 
children.
• Among adults living in outright poverty, 34% – 117,408 people – were employed. 
Poverty, Earnings and Income in San Diego County 2011
Earnings drop as wages lag behind costs in San Diego region
Working families in San Diego County lost ground in 2011, as the quality of jobs created 
by major industries in the region failed to keep pace with the cost of living. Middle‐
income earnings shrank and more people fell into poverty. Black and Latino families and 
women continued to bear the brunt of income inequality.
Earnings by Industry
The tourism industry had the lowest median earnings in 2011, $24,422 for a year of full‐
time work. Health care and social assistance grew to the largest local industry, with 
stagnant wages. Real earnings in 10 of the 15 largest industries were lower than in 2007.
Data includes all occupations within the industries.
15 Largest Industries in San Diego County
Median
Earnings
2011
Change in
earnings
2007-2011
2011
employees
Change in
employees
2007-2011
Accommodation & food services $24,422 1.3% 53,867 0.2%
Administrative, support & waste management services $31,414 -4.9% 38,560 -3.6%
Other services (except public administration) $32,136 -3.2% 40,736 6.2%
Retail Trade $34,470 -7.9% 88,789 2.0%
Real estate & rental and leasing $39,671 -24.8% 25,312 -0.8%
Health care & social assistance $45,607 0.5% 115,719 28.4%
Wholesale Trade $45,661 -11.1% 26,017 -18.0%
Transportation & warehousing $46,528 -3.3% 26,907 -5.3%
Construction $46,635 -4.7% 44,265 -39.1%
Finance & Insurance $52,068 -9.3% 44,618 3.7%
Educational Services $52,143 4.4% 68,830 40.3%
Manufacturing $57,119 3.4% 106,457 6.4%
Public administration $61,345 5.7% 79,022 20.5%
Information $64,957 -7.2% 22,393 -25.0%
Professional, scientific, and technical services $67,267 -9.4% 98,520 2.7%
Living in Poverty and Economic Hardship
For More Information Call (619) 584‐5744 or Visit OnlineCPI.org 2
The hard facts on poverty:
• The San Diego County population living below the federal poverty level has increased by 
nearly 142,000 people since 2007.  
• Nearly 1 in 5 children in the County lived in poverty in 2011. 
• In 2011, the federal poverty level (FPL) was $11,484 for a single person and $22,811 for a 
family of four with two children. The level differs for all family sizes.
A yearly income of $23,000 does not go far for a family of four. A more realistic measure of 
the income needed for basic sustenance is double that amount (200% of FPL). More than a 
third of San Diego County's population lived below that level of economic hardship in 2011.
Poverty and economic 
hardship in San Diego 
County have been 
increasing the last five 
years. 
Poverty and Economic Hardship in San Diego County
Key Indicators
Number % of total Number % of total Number % of total
County residents living below the 
federal poverty level (100% FPL)
462,269 15.1% 446,060 14.8% 320,378 11.1%
Children living below the federal 
poverty level (100% FPL)
137,084 19.1% 137,287 19.2% 110,124 15.1%
County residents in economic 
hardship  (200% FPL)
1,039,957 34.0% 1,006,047 34.0% 787,991 27.4%
2011 2010 2007
Income Inequality: The Middle Is Being Squeezed
For More Information Call (619) 584‐5744 or Visit OnlineCPI.org 3
The hard facts on income inequality:
• The middle class continues to shrink in San Diego County as median incomes decrease. 
• The top‐earning fifth of households received 49.2% of all income in the region, while the 
bottom fifth of households received only 3.1%. 
• Of individuals working full‐time year‐round, 20.4 % or 202,412 earned less than $25,000.
• The gender wage gap persisted in 2011. For full‐time, year‐round work, median earnings 
were $49,788 for men and $41,551 for women.  
In 2011, a fifth of 
households (224,108) 
earned less than $25,000.
Median household 
income – the combined 
earnings of all people in a 
household – fell to 
$59,477 in 2011 from 
$61,814 in 2010, adjusted 
for inflation.  
The Gini index* of income 
inequality in San Diego County 
increased to 46.1% from 45.8% 
last year. 
*The Gini index is an economic measure of 
income inequality. An index of 0 indicates 
perfect equality and 1 indicates perfect 
inequality (i.e. one person has all the 
income and the rest have none). The US  
Gini for 2011 was 47.5. 
Household income 
decreased for all races 
and ethnicities, when 
adjusted for inflation. 
Blacks and Latinos had 
the lowest median 
household incomes. 
2011
2010          
(Infl. Adjst.)
59,477$   61,814$         
45,489$   48,159$         
42,533$   46,207$         
72,387$   78,260$         
60,416$   62,347$         
31,547$   32,344$         Median Individual Earnings
Income & Earnings
Median Household Income
Median Household Income‐Black
Median Household Income‐Latino
Median Household Income‐Asian
Median Houshold Income‐White
Poverty and Health in San Diego County in 2011
For More Information Call (619) 584‐5744 or Visit OnlineCPI.org 4
Methodology: Each year the US Census Bureau releases data from the American
Community Survey (ACS). This data is available for geographic areas with populations of
65,000 or more and provides demographic, economic and social data for individuals and
households. This report analyzes the 2011 data, released on September 20, 2012.
Total Poverty and Child Poverty by City
19.6%
of children are
in poverty
16%
of women are
in poverty
14.2%
of men are
in poverty
9%
of seniors (65+)
are in poverty
11%
of families
are in poverty
22.6%
of single parent 
families are in 
poverty
The hard facts on poverty and health:
• Blacks and Latinos are more likely to live in poverty than Whites or Asians. 
• Children continue to be disproportionately impoverished, and over 77,000 families were 
living below the federal poverty line in 2011.  
Health Insurance Breakdown
• 528,808 people (17.4% of the population) lived without health insurance.
• 463,626 working‐age adults lived without health insurance.
• 136,249 people who worked full‐time, year round did not have health insurance in 2011
*This data does not reflect the diversity of Asian populations surveyed.
Printed in‐house

Contenu connexe

Plus de Center On Policy Initiatives

Support for the Barrio Logan Community Update Alternative 1 proposal
Support for the Barrio Logan Community Update Alternative 1 proposalSupport for the Barrio Logan Community Update Alternative 1 proposal
Support for the Barrio Logan Community Update Alternative 1 proposalCenter On Policy Initiatives
 
Community Budget Alliance Presentation to Council at the Evening Budget Hearing
Community Budget Alliance Presentation to Council at the Evening Budget HearingCommunity Budget Alliance Presentation to Council at the Evening Budget Hearing
Community Budget Alliance Presentation to Council at the Evening Budget HearingCenter On Policy Initiatives
 
Budget 102: A Guide to San Diego's Capital Improvement Program
Budget 102: A Guide to San Diego's Capital Improvement ProgramBudget 102: A Guide to San Diego's Capital Improvement Program
Budget 102: A Guide to San Diego's Capital Improvement ProgramCenter On Policy Initiatives
 
Budget 101: General Overview of San Diego City Budget
Budget 101: General Overview of San Diego City BudgetBudget 101: General Overview of San Diego City Budget
Budget 101: General Overview of San Diego City BudgetCenter On Policy Initiatives
 
The impact of foreclosures on our community normitas d1 updated
The impact of foreclosures on our community normitas d1 updatedThe impact of foreclosures on our community normitas d1 updated
The impact of foreclosures on our community normitas d1 updatedCenter On Policy Initiatives
 

Plus de Center On Policy Initiatives (15)

CPI 2013 Impact Report
CPI 2013 Impact ReportCPI 2013 Impact Report
CPI 2013 Impact Report
 
Support for the Barrio Logan Community Update Alternative 1 proposal
Support for the Barrio Logan Community Update Alternative 1 proposalSupport for the Barrio Logan Community Update Alternative 1 proposal
Support for the Barrio Logan Community Update Alternative 1 proposal
 
Community planning group training
Community planning group training Community planning group training
Community planning group training
 
Community Budget Alliance Presentation to Council at the Evening Budget Hearing
Community Budget Alliance Presentation to Council at the Evening Budget HearingCommunity Budget Alliance Presentation to Council at the Evening Budget Hearing
Community Budget Alliance Presentation to Council at the Evening Budget Hearing
 
City budget advocacy training 5 4-13
City budget advocacy training 5 4-13City budget advocacy training 5 4-13
City budget advocacy training 5 4-13
 
Fy 2014 proposed budget highlights
Fy 2014 proposed budget highlightsFy 2014 proposed budget highlights
Fy 2014 proposed budget highlights
 
City Budget Advocacy Training 5 4-13
City Budget Advocacy Training 5 4-13City Budget Advocacy Training 5 4-13
City Budget Advocacy Training 5 4-13
 
Presupuesto 102
Presupuesto 102Presupuesto 102
Presupuesto 102
 
Presupuesto 101
Presupuesto 101�Presupuesto 101�
Presupuesto 101
 
How to Read a City Budget (4 - 4 -13)
How to Read a City Budget (4 - 4 -13)How to Read a City Budget (4 - 4 -13)
How to Read a City Budget (4 - 4 -13)
 
Budget 102: A Guide to San Diego's Capital Improvement Program
Budget 102: A Guide to San Diego's Capital Improvement ProgramBudget 102: A Guide to San Diego's Capital Improvement Program
Budget 102: A Guide to San Diego's Capital Improvement Program
 
Budget 101: General Overview of San Diego City Budget
Budget 101: General Overview of San Diego City BudgetBudget 101: General Overview of San Diego City Budget
Budget 101: General Overview of San Diego City Budget
 
Al Acta de Exenciones Especiales - No a la Prop 32
Al Acta de Exenciones Especiales - No a la Prop 32Al Acta de Exenciones Especiales - No a la Prop 32
Al Acta de Exenciones Especiales - No a la Prop 32
 
Revised prop 32 presentation 09 10-2012
Revised prop 32 presentation 09 10-2012Revised prop 32 presentation 09 10-2012
Revised prop 32 presentation 09 10-2012
 
The impact of foreclosures on our community normitas d1 updated
The impact of foreclosures on our community normitas d1 updatedThe impact of foreclosures on our community normitas d1 updated
The impact of foreclosures on our community normitas d1 updated
 

Dernier

How to Fix XML SyntaxError in Odoo the 17
How to Fix XML SyntaxError in Odoo the 17How to Fix XML SyntaxError in Odoo the 17
How to Fix XML SyntaxError in Odoo the 17Celine George
 
Oppenheimer Film Discussion for Philosophy and Film
Oppenheimer Film Discussion for Philosophy and FilmOppenheimer Film Discussion for Philosophy and Film
Oppenheimer Film Discussion for Philosophy and FilmStan Meyer
 
Narcotic and Non Narcotic Analgesic..pdf
Narcotic and Non Narcotic Analgesic..pdfNarcotic and Non Narcotic Analgesic..pdf
Narcotic and Non Narcotic Analgesic..pdfPrerana Jadhav
 
Beauty Amidst the Bytes_ Unearthing Unexpected Advantages of the Digital Wast...
Beauty Amidst the Bytes_ Unearthing Unexpected Advantages of the Digital Wast...Beauty Amidst the Bytes_ Unearthing Unexpected Advantages of the Digital Wast...
Beauty Amidst the Bytes_ Unearthing Unexpected Advantages of the Digital Wast...DhatriParmar
 
4.11.24 Mass Incarceration and the New Jim Crow.pptx
4.11.24 Mass Incarceration and the New Jim Crow.pptx4.11.24 Mass Incarceration and the New Jim Crow.pptx
4.11.24 Mass Incarceration and the New Jim Crow.pptxmary850239
 
Congestive Cardiac Failure..presentation
Congestive Cardiac Failure..presentationCongestive Cardiac Failure..presentation
Congestive Cardiac Failure..presentationdeepaannamalai16
 
Textual Evidence in Reading and Writing of SHS
Textual Evidence in Reading and Writing of SHSTextual Evidence in Reading and Writing of SHS
Textual Evidence in Reading and Writing of SHSMae Pangan
 
Visit to a blind student's school🧑‍🦯🧑‍🦯(community medicine)
Visit to a blind student's school🧑‍🦯🧑‍🦯(community medicine)Visit to a blind student's school🧑‍🦯🧑‍🦯(community medicine)
Visit to a blind student's school🧑‍🦯🧑‍🦯(community medicine)lakshayb543
 
DIFFERENT BASKETRY IN THE PHILIPPINES PPT.pptx
DIFFERENT BASKETRY IN THE PHILIPPINES PPT.pptxDIFFERENT BASKETRY IN THE PHILIPPINES PPT.pptx
DIFFERENT BASKETRY IN THE PHILIPPINES PPT.pptxMichelleTuguinay1
 
ROLES IN A STAGE PRODUCTION in arts.pptx
ROLES IN A STAGE PRODUCTION in arts.pptxROLES IN A STAGE PRODUCTION in arts.pptx
ROLES IN A STAGE PRODUCTION in arts.pptxVanesaIglesias10
 
Team Lead Succeed – Helping you and your team achieve high-performance teamwo...
Team Lead Succeed – Helping you and your team achieve high-performance teamwo...Team Lead Succeed – Helping you and your team achieve high-performance teamwo...
Team Lead Succeed – Helping you and your team achieve high-performance teamwo...Association for Project Management
 
Unraveling Hypertext_ Analyzing Postmodern Elements in Literature.pptx
Unraveling Hypertext_ Analyzing  Postmodern Elements in  Literature.pptxUnraveling Hypertext_ Analyzing  Postmodern Elements in  Literature.pptx
Unraveling Hypertext_ Analyzing Postmodern Elements in Literature.pptxDhatriParmar
 
ESP 4-EDITED.pdfmmcncncncmcmmnmnmncnmncmnnjvnnv
ESP 4-EDITED.pdfmmcncncncmcmmnmnmncnmncmnnjvnnvESP 4-EDITED.pdfmmcncncncmcmmnmnmncnmncmnnjvnnv
ESP 4-EDITED.pdfmmcncncncmcmmnmnmncnmncmnnjvnnvRicaMaeCastro1
 
Q-Factor HISPOL Quiz-6th April 2024, Quiz Club NITW
Q-Factor HISPOL Quiz-6th April 2024, Quiz Club NITWQ-Factor HISPOL Quiz-6th April 2024, Quiz Club NITW
Q-Factor HISPOL Quiz-6th April 2024, Quiz Club NITWQuiz Club NITW
 
Decoding the Tweet _ Practical Criticism in the Age of Hashtag.pptx
Decoding the Tweet _ Practical Criticism in the Age of Hashtag.pptxDecoding the Tweet _ Practical Criticism in the Age of Hashtag.pptx
Decoding the Tweet _ Practical Criticism in the Age of Hashtag.pptxDhatriParmar
 
Grade 9 Quarter 4 Dll Grade 9 Quarter 4 DLL.pdf
Grade 9 Quarter 4 Dll Grade 9 Quarter 4 DLL.pdfGrade 9 Quarter 4 Dll Grade 9 Quarter 4 DLL.pdf
Grade 9 Quarter 4 Dll Grade 9 Quarter 4 DLL.pdfJemuel Francisco
 
Student Profile Sample - We help schools to connect the data they have, with ...
Student Profile Sample - We help schools to connect the data they have, with ...Student Profile Sample - We help schools to connect the data they have, with ...
Student Profile Sample - We help schools to connect the data they have, with ...Seán Kennedy
 
Measures of Position DECILES for ungrouped data
Measures of Position DECILES for ungrouped dataMeasures of Position DECILES for ungrouped data
Measures of Position DECILES for ungrouped dataBabyAnnMotar
 
Q4-PPT-Music9_Lesson-1-Romantic-Opera.pptx
Q4-PPT-Music9_Lesson-1-Romantic-Opera.pptxQ4-PPT-Music9_Lesson-1-Romantic-Opera.pptx
Q4-PPT-Music9_Lesson-1-Romantic-Opera.pptxlancelewisportillo
 

Dernier (20)

How to Fix XML SyntaxError in Odoo the 17
How to Fix XML SyntaxError in Odoo the 17How to Fix XML SyntaxError in Odoo the 17
How to Fix XML SyntaxError in Odoo the 17
 
Oppenheimer Film Discussion for Philosophy and Film
Oppenheimer Film Discussion for Philosophy and FilmOppenheimer Film Discussion for Philosophy and Film
Oppenheimer Film Discussion for Philosophy and Film
 
Narcotic and Non Narcotic Analgesic..pdf
Narcotic and Non Narcotic Analgesic..pdfNarcotic and Non Narcotic Analgesic..pdf
Narcotic and Non Narcotic Analgesic..pdf
 
Beauty Amidst the Bytes_ Unearthing Unexpected Advantages of the Digital Wast...
Beauty Amidst the Bytes_ Unearthing Unexpected Advantages of the Digital Wast...Beauty Amidst the Bytes_ Unearthing Unexpected Advantages of the Digital Wast...
Beauty Amidst the Bytes_ Unearthing Unexpected Advantages of the Digital Wast...
 
4.11.24 Mass Incarceration and the New Jim Crow.pptx
4.11.24 Mass Incarceration and the New Jim Crow.pptx4.11.24 Mass Incarceration and the New Jim Crow.pptx
4.11.24 Mass Incarceration and the New Jim Crow.pptx
 
Congestive Cardiac Failure..presentation
Congestive Cardiac Failure..presentationCongestive Cardiac Failure..presentation
Congestive Cardiac Failure..presentation
 
INCLUSIVE EDUCATION PRACTICES FOR TEACHERS AND TRAINERS.pptx
INCLUSIVE EDUCATION PRACTICES FOR TEACHERS AND TRAINERS.pptxINCLUSIVE EDUCATION PRACTICES FOR TEACHERS AND TRAINERS.pptx
INCLUSIVE EDUCATION PRACTICES FOR TEACHERS AND TRAINERS.pptx
 
Textual Evidence in Reading and Writing of SHS
Textual Evidence in Reading and Writing of SHSTextual Evidence in Reading and Writing of SHS
Textual Evidence in Reading and Writing of SHS
 
Visit to a blind student's school🧑‍🦯🧑‍🦯(community medicine)
Visit to a blind student's school🧑‍🦯🧑‍🦯(community medicine)Visit to a blind student's school🧑‍🦯🧑‍🦯(community medicine)
Visit to a blind student's school🧑‍🦯🧑‍🦯(community medicine)
 
DIFFERENT BASKETRY IN THE PHILIPPINES PPT.pptx
DIFFERENT BASKETRY IN THE PHILIPPINES PPT.pptxDIFFERENT BASKETRY IN THE PHILIPPINES PPT.pptx
DIFFERENT BASKETRY IN THE PHILIPPINES PPT.pptx
 
ROLES IN A STAGE PRODUCTION in arts.pptx
ROLES IN A STAGE PRODUCTION in arts.pptxROLES IN A STAGE PRODUCTION in arts.pptx
ROLES IN A STAGE PRODUCTION in arts.pptx
 
Team Lead Succeed – Helping you and your team achieve high-performance teamwo...
Team Lead Succeed – Helping you and your team achieve high-performance teamwo...Team Lead Succeed – Helping you and your team achieve high-performance teamwo...
Team Lead Succeed – Helping you and your team achieve high-performance teamwo...
 
Unraveling Hypertext_ Analyzing Postmodern Elements in Literature.pptx
Unraveling Hypertext_ Analyzing  Postmodern Elements in  Literature.pptxUnraveling Hypertext_ Analyzing  Postmodern Elements in  Literature.pptx
Unraveling Hypertext_ Analyzing Postmodern Elements in Literature.pptx
 
ESP 4-EDITED.pdfmmcncncncmcmmnmnmncnmncmnnjvnnv
ESP 4-EDITED.pdfmmcncncncmcmmnmnmncnmncmnnjvnnvESP 4-EDITED.pdfmmcncncncmcmmnmnmncnmncmnnjvnnv
ESP 4-EDITED.pdfmmcncncncmcmmnmnmncnmncmnnjvnnv
 
Q-Factor HISPOL Quiz-6th April 2024, Quiz Club NITW
Q-Factor HISPOL Quiz-6th April 2024, Quiz Club NITWQ-Factor HISPOL Quiz-6th April 2024, Quiz Club NITW
Q-Factor HISPOL Quiz-6th April 2024, Quiz Club NITW
 
Decoding the Tweet _ Practical Criticism in the Age of Hashtag.pptx
Decoding the Tweet _ Practical Criticism in the Age of Hashtag.pptxDecoding the Tweet _ Practical Criticism in the Age of Hashtag.pptx
Decoding the Tweet _ Practical Criticism in the Age of Hashtag.pptx
 
Grade 9 Quarter 4 Dll Grade 9 Quarter 4 DLL.pdf
Grade 9 Quarter 4 Dll Grade 9 Quarter 4 DLL.pdfGrade 9 Quarter 4 Dll Grade 9 Quarter 4 DLL.pdf
Grade 9 Quarter 4 Dll Grade 9 Quarter 4 DLL.pdf
 
Student Profile Sample - We help schools to connect the data they have, with ...
Student Profile Sample - We help schools to connect the data they have, with ...Student Profile Sample - We help schools to connect the data they have, with ...
Student Profile Sample - We help schools to connect the data they have, with ...
 
Measures of Position DECILES for ungrouped data
Measures of Position DECILES for ungrouped dataMeasures of Position DECILES for ungrouped data
Measures of Position DECILES for ungrouped data
 
Q4-PPT-Music9_Lesson-1-Romantic-Opera.pptx
Q4-PPT-Music9_Lesson-1-Romantic-Opera.pptxQ4-PPT-Music9_Lesson-1-Romantic-Opera.pptx
Q4-PPT-Music9_Lesson-1-Romantic-Opera.pptx
 

Poverty, Earnings and Income, San Diego County in 2011

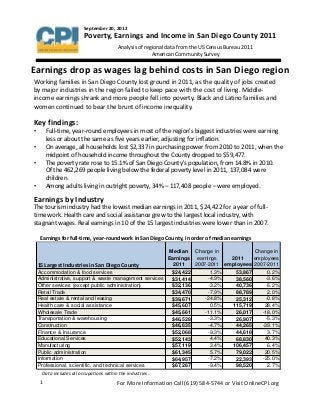
  • 1. September 20, 2012 Analysis of regional data from the US Census Bureau 2011  American Community Survey For More Information Call (619) 584‐5744 or Visit OnlineCPI.org 1 Earnings for full‐time, year‐round work in San Diego County, in order of median earnings Key findings: • Full‐time, year‐round employees in most of the region's biggest industries were earning  less or about the same as five years earlier, adjusting for inflation.  • On average, all households lost $2,337 in purchasing power from 2010 to 2011, when the  midpoint of household income throughout the County dropped to $59,477.  • The poverty rate rose to 15.1% of San Diego County's population, from 14.8% in 2010.  Of the 462,269 people living below the federal poverty level in 2011, 137,084 were  children. • Among adults living in outright poverty, 34% – 117,408 people – were employed.  Poverty, Earnings and Income in San Diego County 2011 Earnings drop as wages lag behind costs in San Diego region Working families in San Diego County lost ground in 2011, as the quality of jobs created  by major industries in the region failed to keep pace with the cost of living. Middle‐ income earnings shrank and more people fell into poverty. Black and Latino families and  women continued to bear the brunt of income inequality. Earnings by Industry The tourism industry had the lowest median earnings in 2011, $24,422 for a year of full‐ time work. Health care and social assistance grew to the largest local industry, with  stagnant wages. Real earnings in 10 of the 15 largest industries were lower than in 2007. Data includes all occupations within the industries. 15 Largest Industries in San Diego County Median Earnings 2011 Change in earnings 2007-2011 2011 employees Change in employees 2007-2011 Accommodation & food services $24,422 1.3% 53,867 0.2% Administrative, support & waste management services $31,414 -4.9% 38,560 -3.6% Other services (except public administration) $32,136 -3.2% 40,736 6.2% Retail Trade $34,470 -7.9% 88,789 2.0% Real estate & rental and leasing $39,671 -24.8% 25,312 -0.8% Health care & social assistance $45,607 0.5% 115,719 28.4% Wholesale Trade $45,661 -11.1% 26,017 -18.0% Transportation & warehousing $46,528 -3.3% 26,907 -5.3% Construction $46,635 -4.7% 44,265 -39.1% Finance & Insurance $52,068 -9.3% 44,618 3.7% Educational Services $52,143 4.4% 68,830 40.3% Manufacturing $57,119 3.4% 106,457 6.4% Public administration $61,345 5.7% 79,022 20.5% Information $64,957 -7.2% 22,393 -25.0% Professional, scientific, and technical services $67,267 -9.4% 98,520 2.7%
  • 2. Living in Poverty and Economic Hardship For More Information Call (619) 584‐5744 or Visit OnlineCPI.org 2 The hard facts on poverty: • The San Diego County population living below the federal poverty level has increased by  nearly 142,000 people since 2007.   • Nearly 1 in 5 children in the County lived in poverty in 2011.  • In 2011, the federal poverty level (FPL) was $11,484 for a single person and $22,811 for a  family of four with two children. The level differs for all family sizes. A yearly income of $23,000 does not go far for a family of four. A more realistic measure of  the income needed for basic sustenance is double that amount (200% of FPL). More than a  third of San Diego County's population lived below that level of economic hardship in 2011. Poverty and economic  hardship in San Diego  County have been  increasing the last five  years.  Poverty and Economic Hardship in San Diego County Key Indicators Number % of total Number % of total Number % of total County residents living below the  federal poverty level (100% FPL) 462,269 15.1% 446,060 14.8% 320,378 11.1% Children living below the federal  poverty level (100% FPL) 137,084 19.1% 137,287 19.2% 110,124 15.1% County residents in economic  hardship  (200% FPL) 1,039,957 34.0% 1,006,047 34.0% 787,991 27.4% 2011 2010 2007
  • 3. Income Inequality: The Middle Is Being Squeezed For More Information Call (619) 584‐5744 or Visit OnlineCPI.org 3 The hard facts on income inequality: • The middle class continues to shrink in San Diego County as median incomes decrease.  • The top‐earning fifth of households received 49.2% of all income in the region, while the  bottom fifth of households received only 3.1%.  • Of individuals working full‐time year‐round, 20.4 % or 202,412 earned less than $25,000. • The gender wage gap persisted in 2011. For full‐time, year‐round work, median earnings  were $49,788 for men and $41,551 for women.   In 2011, a fifth of  households (224,108)  earned less than $25,000. Median household  income – the combined  earnings of all people in a  household – fell to  $59,477 in 2011 from  $61,814 in 2010, adjusted  for inflation.   The Gini index* of income  inequality in San Diego County  increased to 46.1% from 45.8%  last year.  *The Gini index is an economic measure of  income inequality. An index of 0 indicates  perfect equality and 1 indicates perfect  inequality (i.e. one person has all the  income and the rest have none). The US   Gini for 2011 was 47.5.  Household income  decreased for all races  and ethnicities, when  adjusted for inflation.  Blacks and Latinos had  the lowest median  household incomes.  2011 2010           (Infl. Adjst.) 59,477$   61,814$          45,489$   48,159$          42,533$   46,207$          72,387$   78,260$          60,416$   62,347$          31,547$   32,344$         Median Individual Earnings Income & Earnings Median Household Income Median Household Income‐Black Median Household Income‐Latino Median Household Income‐Asian Median Houshold Income‐White
  • 4. Poverty and Health in San Diego County in 2011 For More Information Call (619) 584‐5744 or Visit OnlineCPI.org 4 Methodology: Each year the US Census Bureau releases data from the American Community Survey (ACS). This data is available for geographic areas with populations of 65,000 or more and provides demographic, economic and social data for individuals and households. This report analyzes the 2011 data, released on September 20, 2012. Total Poverty and Child Poverty by City 19.6% of children are in poverty 16% of women are in poverty 14.2% of men are in poverty 9% of seniors (65+) are in poverty 11% of families are in poverty 22.6% of single parent  families are in  poverty The hard facts on poverty and health: • Blacks and Latinos are more likely to live in poverty than Whites or Asians.  • Children continue to be disproportionately impoverished, and over 77,000 families were  living below the federal poverty line in 2011.   Health Insurance Breakdown • 528,808 people (17.4% of the population) lived without health insurance. • 463,626 working‐age adults lived without health insurance. • 136,249 people who worked full‐time, year round did not have health insurance in 2011 *This data does not reflect the diversity of Asian populations surveyed. Printed in‐house