SlideShare une entreprise Scribd logo
1  sur  8
Télécharger pour lire hors ligne
Dr. Camille Mora Ed.D. – Parent Perceptions of Trauma-informed Assessment – Excerpt MWERA
Conference Handout 1
The Five Scales Handout
School Use, Neuropsychological Assessment, Confidence in Trauma-informed Assessment,
Appropriate Intervention, and School Confidence.
I used 27 survey items to create five scales. Descriptive statistics were calculated
in order to examine items related to the five scales (school use scale,
neuropsychological assessment use scale, confidence in trauma-informed assessment
scale, appropriate intervention scale, and school confidence scale). Note, all mean
ratings are calculated on the following Likert scale: 1 = Strongly agree, 2 = Agree, 3 =
Neither agree nor disagree, 4 = Disagree, 5 = Strongly disagree.
School use scale. I calculated reliability statistics in order to test the normal
distribution of the school use variables. For the 5-item scale, the Cronbach’s alpha was
.85 (N = 119). It was positive and greater than .70, meaning it provided good support for
internal consistency reliability (Leech et al., 2015). I combined these five items to create
a school use scale for further analysis (Table 4).
Table 4
Reliability Statistics for the School Use Scale (N = 119)
School use scale items M SD Skew
The school district provided an accurate assessment 3.00 1.24 0.34
Assessment was trauma informed 4.09 1.11 -0.89
Recommendations matched what I felt my child needs 3.23 1.32 0.08
Assessment informed my child’s IEP 2.68 1.33 0.56
I would recommend this assessment to other IA parents 2.80 1.37 0.31
Note. Ratings based on a Likert scale: 1 = Strongly agree, 2 = Agree, 3 = Neither agree nor
disagree, 4 = Disagree, 5 = Strongly disagree.
Dr. Camille Mora Ed.D. – Parent Perceptions of Trauma-informed Assessment – Excerpt MWERA
Conference Handout 2
Neuropsychological assessment use scale. I calculated reliability statistics in
order to test the normal distribution of the school use variables. Two statements were
considered with respect to whether neuropsychological assessments were more
accurate and offered better outcomes for IA students. For the 2-item scale, the
Cronbach’s alpha was .78 (n = 44). It was positive and greater than .70; therefore, it
provided good support for internal consistency reliability (Leech et al., 2015). The two
items were combined to create a neuropsychological assessment use scale for further
analysis (Table 3). Originally this scale was meant to have the same five items as the
school use scale, but for neuropsychological assessments. However, Cronbach’s alpha
was low on the neuropsychological assessment use scale. This could have been due to
the relatively small n value of 44. Table 5 displays more information about the other
items related to this scale.
Table 5
Reliability Statistics for Neuropsychological Assessment Use Scale Items
Neuropsychological assessment use scale items N M SD Skew
Provided an accurate assessment. 73 2.34 0.620 1.61
Recommendations matched what I felt my child needed.
73 2.52 0.877 1.57
Note. Ratings based on a Likert scale: 1 = Strongly agree, 2 = Agree, 3 = Neither agree nor
disagree, 4 = Disagree, 5 = Strongly disagree.
Table 6 displays the agreement level respondents had to selected statement
variables related to the accuracy of assessments. In the section for neuropsychological
assessment, the highest agreement was for “The neuropsychologist provided an
accurate assessment” (M = 2.45). The lowest amount of agreement was for “My child
Dr. Camille Mora Ed.D. – Parent Perceptions of Trauma-informed Assessment – Excerpt MWERA
Conference Handout 3
received a trauma-informed assessment” (M = 3.09). In this table, the n values are low.
The low n in relation to the neuropsychological assessment data could have to do with
the practical fact that such an assessment costs around $5,000, compared to the
school/district assessment, which is free to families, and many families choose not to
have their child assessed that way. This could be because only a total of 70 families
(53%) reported that their children received neuropsychological assessments, and as in
the rest of the survey, many families did not answer all the question.
The second half of Table 6 displays the ratings of accuracy of school/district
assessments. In this table, the n values are higher than in the previous table, and the
standard deviations are higher as well. Highest agreement was for “This assessment
informed my child’s IEP” (M = 2.67). The lowest degree of agreement was for “My child
received a trauma-informed assessment” (M = 4.02).
Table 6
Accuracy of Assessment Based on Type
Item n M SD
Neuropsychological assessment
The neuropsychologist provided an accurate assessment. 56 2.45 0.711
I would recommend this type of assessment to other parents of
internationally adopted children.
41 2.51 0.746
Recommendations from the neuropsychologist matched what I
felt/feel my child needs.
70 2.56 0.862
This assessment informed my child’s IEP 73 2.97 1.030
My child received a trauma-informed assessment 82 3.09 1.090
School/district assessment
The school/district provided an accurate assessment. 134 2.96 1.200
I would recommend this type of assessment to other parents of
internationally adopted kids.
129 2.78 1.330
Recommendations from the school matched what I felt/feel my
child needs.
129 3.21 1.300
This assessment informed my child’s IEP. 126 2.67 1.300
Dr. Camille Mora Ed.D. – Parent Perceptions of Trauma-informed Assessment – Excerpt MWERA
Conference Handout 4
My child received a trauma-informed assessment. 129 4.02 1.130
Note. Ratings based on a Likert scale: 1 = Strongly agree, 2 = Agree, 3 = Neither agree nor
disagree, 4 = Disagree, 5 = Strongly disagree.
Confidence in trauma-informed assessments scale. Data in confidence in
trauma-informed assessments variables included five items. For this 5-item scale, the
Cronbach’s alpha was .75 (N = 137). It was positive and greater than .70, thus it
provided adequate support for internal consistency reliability (Leech et al., 2015). The
alpha for this confidence in trauma-informed scale indicated good internal consistancy.
These five items were then combined to create the confidence in trauma-informed
assessments scale that was used for further analysis (Table 7).
Table 7
Descriptive Statistics for Confidence in Trauma-Informed (TI) Assessment Scale
Confidence in TI scale items N M SD Skew
Child’s school uses TI instructional practices 137 3.73 1.20 -0.40
TI instructional practices would help my child
succeed
137 1.70 0.91 1.19
Child’s teacher uses TI practices in the classroom 137 3.67 1.22 -0.48
Child is more secure in a TI environment 137 1.96 0.94 0.58
Child does better in a TI school 137 2.21 0.94 0.29
Note. Ratings based on a Likert scale: 1 = Strongly agree, 2 = Agree, 3 = Neither agree or
disagree, 4 = Disagree to 5 = Strongly disagree.
Appropriate intervention and opportunities scale. I calculated reliability
statistics in order to test the normal distribution of the school use variables. Three
statements were considered with respect to whether trauma-informed assessments
enabled students to receive more appropriate interventions and opportunities. For the 3-
Dr. Camille Mora Ed.D. – Parent Perceptions of Trauma-informed Assessment – Excerpt MWERA
Conference Handout 5
item scale, the Cronbach’s alpha was .81 (n = 92). It was positive and greater than .70;
therefore, it provided good support for internal consistency reliability (Leech et al.,
2015). The three items were combined to create an appropriate intervention and
opportunities scale for further analysis (Table 8).
Table 8
Descriptive Statistics for Appropriate Interventions and Opportunities Scale Items
Appropriate interventions and
opportunities scale items N M SD Skew
TI assessments allowed your child to receive
more appropriate interventions. 92 1.89 1.07 0.24
TI assessments increased educational
opportunities for your child.
92 2.30 1.23 0.53
TI assessments resulted in more appropriate
classroom interventions.
92 2.59 1.36 0.25
Note. Ratings based on a Likert scale: 1 = Strongly agree, 2 = Agree, 3 = Neither agree
nor disagree, 4 = Disagree, 5 = Strongly disagree.
School confidence scale. I calculated reliability statistics in order to test the
normal distribution of the school use variables. Twelve statements were considered with
respect to parents’ confidence in the school’s ability to meet the needs of their IA
student. For the 12-item scale, the Cronbach’s alpha was .95 (n = 86). It was positive
and greater than .70; therefore, it provided good support for internal consistency
reliability (Leech et al., 2015). The 12 items were combined to create a school
confidence scale for further analysis (Table 9).
Dr. Camille Mora Ed.D. – Parent Perceptions of Trauma-informed Assessment – Excerpt MWERA
Conference Handout 6
Table 9
Descriptive Statistics for School Confidence Scale Items (N = 86)
School confidence scale items M SD Skew
My child is included in school activities. 2.20 1.24 1.20
School provided my student with an appropriate IEP. 2.29 0.91 0.38
My child’s teacher provides support in the classroom for my
child. 2.30 0.99 0.52
Interventions align with my child’s IEP. 2.34 0.94 0.68
My child feels safe at school. 2.35 1.38 0.71
School provides appropriate assessments. 2.50 0.97 0.13
School honors and fulfills my child’s IEP or 504. 2.52 1.34 0.51
I am pleased with the services my child receives. 2.55 0.97 0.28
I am happy with how the school meets my child’s needs.
2.60 0.99 0.23
The school supports my child’s needs. 2.67 1.38 0.56
The school follows through on what they say. 2.77 1.30 0.49
My child is important to their school. 2.80 1.44 0.45
Note. Ratings based on a Likert scale: 1 = Strongly agree, 2 = Agree, 3 = Neither agree
nor disagree, 4 = Disagree, 5 = Strongly disagree.
Association Between the Scales
Descriptive statistics were run in order to test the normal distribution of the five
scales. The skewness of the scales is reported in Table 10. From the descriptive
statistics, skew can be examined. “If the skewness is more than +1.0 or less than -1.0
the distribution is markedly skewed” (Leech et al., 2015, p. 22). If this is the case, it
would mean that “one tail of the frequency distribution is longer than the other and if the
mean and median are different, the curve is skewed” (Leech et al., 2015, p. 22). From
the data I can see that most of the variable scales have a skewness between -1.0 and
Dr. Camille Mora Ed.D. – Parent Perceptions of Trauma-informed Assessment – Excerpt MWERA
Conference Handout 7
1.0, but the neuropsychological assessment use scale (see Table 4), shows skewness
for the items “Provided an accurate assessment” to be 1.61 and “Recommendations
matched what I felt my child needed” to be 1.57. These two items are considered
nonnormal distributions. However, Leech et al (2015) state, “there are several ways to
check this assumption in addition to checking the skewness value. If the mean, median
and mode, are approximately equal, then you can assume that the distribution is
approximately normally distributed” (p. 34). In the case of these two items, the means
are 2.45 and 2.56, respectively; the medians are 2.0 for each item and the mode is 2 for
each item. This would meet the criteria laid out by Leech et al. Although these items are
skewed, the t tests and ANOVAs were sufficiently robust so that I was able to proced
with the analysis. That said, it is important to note that there should be some caution
with the interpretations as one of the items was moderately skewed.
Table 10
Descriptive Statistics for Five Scales
Scale n M SD Skew
School use scale 134 3.12 0.98 0.26
Neuro. assessment use scale 76 2.48 0.76 0.28
Conf. in T-I assessment scale 196 2.79 0.79 0.17
Appropriate interv. and oppr. scale 170 3.58 1.93 0.19
School confidence scale 162 2.41 0.91 0.19
Note. Ratings based on a Likert scale: 1 = Strongly agree, 2 = Agree, 3 = Neither agree
nor disagree, 4 = Disagree, 5 = Strongly disagree.
Correlations were run for the five scales. Two relationships were statistically
significant. One was the association between the confidence in trauma-informed
assessment scale and the school use scale. The direction of the correlation was
positive. This means school/district assessments were correlated to confidence in
Dr. Camille Mora Ed.D. – Parent Perceptions of Trauma-informed Assessment – Excerpt MWERA
Conference Handout 8
trauma-informed practices. The second was confidence in TI scale versus appropriate
intervention scale. The direction was positive, which means confidence in TI was
correlated to appropriate interventions. These intercorrelations were significant at the p
=.01 level, where N = 81 (school use scale = 0.72, confidence in TI scale = 0.39). (See
Table 11.)
Table 11
Intercorrelations for the Five Scales (N = 81)
Variable 1 2 3 4 5
School use scale -- 0.13 0.13 0.07 0.72**
Neuro. assessment scale -- 0.04 0.12 -0.06
Confidence in TI scale -- 0.39** 0.16
Appropriate intervention scale -- 0.11
School confidence scale --
* p < .05; ** p < .01

Contenu connexe

Tendances

1 Reliability and Validity in Physical Therapy Tests
1  Reliability and Validity in Physical Therapy Tests1  Reliability and Validity in Physical Therapy Tests
1 Reliability and Validity in Physical Therapy Testsaebrahim123
 
Qualitative and quantitative research
Qualitative and quantitative researchQualitative and quantitative research
Qualitative and quantitative researchelianamlc
 
Essential Skills: Critical Thinking For College Students
Essential Skills: Critical Thinking For College StudentsEssential Skills: Critical Thinking For College Students
Essential Skills: Critical Thinking For College Studentsnoblex1
 
Louzel Report - Reliability & validity
Louzel Report - Reliability & validity Louzel Report - Reliability & validity
Louzel Report - Reliability & validity Louzel Linejan
 
Root Cause Analysis
Root Cause AnalysisRoot Cause Analysis
Root Cause AnalysisCarlo Magno
 
Reliability (assessment of student learning I)
Reliability (assessment of student learning I)Reliability (assessment of student learning I)
Reliability (assessment of student learning I)Rey-ra Mora
 
Snow College GPA Study
Snow College GPA StudySnow College GPA Study
Snow College GPA StudyJoshua Woods
 
Reliability and validity ppt
Reliability and validity pptReliability and validity ppt
Reliability and validity pptsurendra poudel
 
Is ignorance bliss
Is ignorance blissIs ignorance bliss
Is ignorance blissStephen Senn
 
validity its types and importance
validity its types and importancevalidity its types and importance
validity its types and importanceIerine Joy Caserial
 
Webers Law Lab Report William Teng
Webers Law Lab Report William TengWebers Law Lab Report William Teng
Webers Law Lab Report William TengWilliam Teng
 
Detection of and Response to Online Users' Emotion
Detection of and Response to Online Users' EmotionDetection of and Response to Online Users' Emotion
Detection of and Response to Online Users' EmotionBeverly Park Woolf
 
Zac Peterson Poster
Zac Peterson PosterZac Peterson Poster
Zac Peterson PosterZac Peterson
 

Tendances (17)

1 Reliability and Validity in Physical Therapy Tests
1  Reliability and Validity in Physical Therapy Tests1  Reliability and Validity in Physical Therapy Tests
1 Reliability and Validity in Physical Therapy Tests
 
201
201201
201
 
Qualitative and quantitative research
Qualitative and quantitative researchQualitative and quantitative research
Qualitative and quantitative research
 
Essential Skills: Critical Thinking For College Students
Essential Skills: Critical Thinking For College StudentsEssential Skills: Critical Thinking For College Students
Essential Skills: Critical Thinking For College Students
 
Louzel Report - Reliability & validity
Louzel Report - Reliability & validity Louzel Report - Reliability & validity
Louzel Report - Reliability & validity
 
Root Cause Analysis
Root Cause AnalysisRoot Cause Analysis
Root Cause Analysis
 
Reliability
ReliabilityReliability
Reliability
 
Reliability (assessment of student learning I)
Reliability (assessment of student learning I)Reliability (assessment of student learning I)
Reliability (assessment of student learning I)
 
Snow College GPA Study
Snow College GPA StudySnow College GPA Study
Snow College GPA Study
 
Reliability and validity ppt
Reliability and validity pptReliability and validity ppt
Reliability and validity ppt
 
Is ignorance bliss
Is ignorance blissIs ignorance bliss
Is ignorance bliss
 
validity its types and importance
validity its types and importancevalidity its types and importance
validity its types and importance
 
Validity andreliability
Validity andreliabilityValidity andreliability
Validity andreliability
 
Webers Law Lab Report William Teng
Webers Law Lab Report William TengWebers Law Lab Report William Teng
Webers Law Lab Report William Teng
 
Detection of and Response to Online Users' Emotion
Detection of and Response to Online Users' EmotionDetection of and Response to Online Users' Emotion
Detection of and Response to Online Users' Emotion
 
Fem
FemFem
Fem
 
Zac Peterson Poster
Zac Peterson PosterZac Peterson Poster
Zac Peterson Poster
 

Similaire à Dr. Mora's Parent Perceptions of Trauma-informed Assessments

Faith & ReasonFaith is not opposed to reason, but is sometime.docx
Faith & ReasonFaith is not opposed to reason, but is sometime.docxFaith & ReasonFaith is not opposed to reason, but is sometime.docx
Faith & ReasonFaith is not opposed to reason, but is sometime.docxmecklenburgstrelitzh
 
CEFS 521 Quiz -3, Liberty University_3 Version answer, secure HIGHSCORE
CEFS 521 Quiz -3, Liberty University_3 Version answer, secure HIGHSCORECEFS 521 Quiz -3, Liberty University_3 Version answer, secure HIGHSCORE
CEFS 521 Quiz -3, Liberty University_3 Version answer, secure HIGHSCORENiniProton
 
MWERA PPTIA Power Point Presentation
MWERA PPTIA Power Point PresentationMWERA PPTIA Power Point Presentation
MWERA PPTIA Power Point PresentationCamilleMora
 
The Importance Of A Family Intervention For Heart Failure...
The Importance Of A Family Intervention For Heart Failure...The Importance Of A Family Intervention For Heart Failure...
The Importance Of A Family Intervention For Heart Failure...Paula Smith
 
A Test Review: Children’s Depression Rating Scale, Revised (CDRS-R)
A Test Review: Children’s Depression Rating Scale, Revised (CDRS-R) A Test Review: Children’s Depression Rating Scale, Revised (CDRS-R)
A Test Review: Children’s Depression Rating Scale, Revised (CDRS-R) Sidney Gaskins
 
Assessment of Self Concept among Intermediate Students of A. P. Model Schools
Assessment of Self Concept among Intermediate Students of A. P. Model SchoolsAssessment of Self Concept among Intermediate Students of A. P. Model Schools
Assessment of Self Concept among Intermediate Students of A. P. Model Schoolsiosrjce
 
Week 6 DQ1. What is your research questionIs there a differen.docx
Week 6 DQ1. What is your research questionIs there a differen.docxWeek 6 DQ1. What is your research questionIs there a differen.docx
Week 6 DQ1. What is your research questionIs there a differen.docxcockekeshia
 
Behavioral Assessment Scale For Children Second Edition (...
Behavioral Assessment Scale For Children Second Edition (...Behavioral Assessment Scale For Children Second Edition (...
Behavioral Assessment Scale For Children Second Edition (...Rachel Davis
 
Final Project ScenarioA researcher has administered an anxiety.docx
Final Project ScenarioA researcher has administered an anxiety.docxFinal Project ScenarioA researcher has administered an anxiety.docx
Final Project ScenarioA researcher has administered an anxiety.docxAKHIL969626
 
MedicalMismanagement&Restructing_DePauw
MedicalMismanagement&Restructing_DePauwMedicalMismanagement&Restructing_DePauw
MedicalMismanagement&Restructing_DePauwPeter Gorman
 
Validity in Psychological Testing
Validity in Psychological TestingValidity in Psychological Testing
Validity in Psychological TestingSandra Arenillo
 
A comparison study on academic performance between ryerson (1)
A comparison study on academic performance between ryerson (1)A comparison study on academic performance between ryerson (1)
A comparison study on academic performance between ryerson (1)amo0oniee
 
Running head ASSESSING A CLIENT .docx
Running head ASSESSING A CLIENT                                  .docxRunning head ASSESSING A CLIENT                                  .docx
Running head ASSESSING A CLIENT .docxhealdkathaleen
 
Analyzing Assessment.docx
Analyzing Assessment.docxAnalyzing Assessment.docx
Analyzing Assessment.docx4934bk
 
Problem Based Learning In Comparison To Traditional Teaching As Perceived By ...
Problem Based Learning In Comparison To Traditional Teaching As Perceived By ...Problem Based Learning In Comparison To Traditional Teaching As Perceived By ...
Problem Based Learning In Comparison To Traditional Teaching As Perceived By ...iosrjce
 
‘What I wish I had known’: Reducing exam-related anxiety through a peer-deliv...
‘What I wish I had known’: Reducing exam-related anxiety through a peer-deliv...‘What I wish I had known’: Reducing exam-related anxiety through a peer-deliv...
‘What I wish I had known’: Reducing exam-related anxiety through a peer-deliv...UCL Medical Society (Education) 2012-2013
 

Similaire à Dr. Mora's Parent Perceptions of Trauma-informed Assessments (20)

Faith & ReasonFaith is not opposed to reason, but is sometime.docx
Faith & ReasonFaith is not opposed to reason, but is sometime.docxFaith & ReasonFaith is not opposed to reason, but is sometime.docx
Faith & ReasonFaith is not opposed to reason, but is sometime.docx
 
CEFS 521 Quiz -3, Liberty University_3 Version answer, secure HIGHSCORE
CEFS 521 Quiz -3, Liberty University_3 Version answer, secure HIGHSCORECEFS 521 Quiz -3, Liberty University_3 Version answer, secure HIGHSCORE
CEFS 521 Quiz -3, Liberty University_3 Version answer, secure HIGHSCORE
 
MWERA PPTIA Power Point Presentation
MWERA PPTIA Power Point PresentationMWERA PPTIA Power Point Presentation
MWERA PPTIA Power Point Presentation
 
Seawell_Exam
Seawell_ExamSeawell_Exam
Seawell_Exam
 
The Importance Of A Family Intervention For Heart Failure...
The Importance Of A Family Intervention For Heart Failure...The Importance Of A Family Intervention For Heart Failure...
The Importance Of A Family Intervention For Heart Failure...
 
Reliability and validity
Reliability and validityReliability and validity
Reliability and validity
 
A Test Review: Children’s Depression Rating Scale, Revised (CDRS-R)
A Test Review: Children’s Depression Rating Scale, Revised (CDRS-R) A Test Review: Children’s Depression Rating Scale, Revised (CDRS-R)
A Test Review: Children’s Depression Rating Scale, Revised (CDRS-R)
 
Assessment of Self Concept among Intermediate Students of A. P. Model Schools
Assessment of Self Concept among Intermediate Students of A. P. Model SchoolsAssessment of Self Concept among Intermediate Students of A. P. Model Schools
Assessment of Self Concept among Intermediate Students of A. P. Model Schools
 
Week 6 DQ1. What is your research questionIs there a differen.docx
Week 6 DQ1. What is your research questionIs there a differen.docxWeek 6 DQ1. What is your research questionIs there a differen.docx
Week 6 DQ1. What is your research questionIs there a differen.docx
 
Behavioral Assessment Scale For Children Second Edition (...
Behavioral Assessment Scale For Children Second Edition (...Behavioral Assessment Scale For Children Second Edition (...
Behavioral Assessment Scale For Children Second Edition (...
 
Final Project ScenarioA researcher has administered an anxiety.docx
Final Project ScenarioA researcher has administered an anxiety.docxFinal Project ScenarioA researcher has administered an anxiety.docx
Final Project ScenarioA researcher has administered an anxiety.docx
 
MedicalMismanagement&Restructing_DePauw
MedicalMismanagement&Restructing_DePauwMedicalMismanagement&Restructing_DePauw
MedicalMismanagement&Restructing_DePauw
 
Validity in Psychological Testing
Validity in Psychological TestingValidity in Psychological Testing
Validity in Psychological Testing
 
A comparison study on academic performance between ryerson (1)
A comparison study on academic performance between ryerson (1)A comparison study on academic performance between ryerson (1)
A comparison study on academic performance between ryerson (1)
 
Unit. 6.doc
Unit. 6.docUnit. 6.doc
Unit. 6.doc
 
Running head ASSESSING A CLIENT .docx
Running head ASSESSING A CLIENT                                  .docxRunning head ASSESSING A CLIENT                                  .docx
Running head ASSESSING A CLIENT .docx
 
Analyzing Assessment.docx
Analyzing Assessment.docxAnalyzing Assessment.docx
Analyzing Assessment.docx
 
Rep
RepRep
Rep
 
Problem Based Learning In Comparison To Traditional Teaching As Perceived By ...
Problem Based Learning In Comparison To Traditional Teaching As Perceived By ...Problem Based Learning In Comparison To Traditional Teaching As Perceived By ...
Problem Based Learning In Comparison To Traditional Teaching As Perceived By ...
 
‘What I wish I had known’: Reducing exam-related anxiety through a peer-deliv...
‘What I wish I had known’: Reducing exam-related anxiety through a peer-deliv...‘What I wish I had known’: Reducing exam-related anxiety through a peer-deliv...
‘What I wish I had known’: Reducing exam-related anxiety through a peer-deliv...
 

Dernier

Organic Name Reactions for the students and aspirants of Chemistry12th.pptx
Organic Name Reactions  for the students and aspirants of Chemistry12th.pptxOrganic Name Reactions  for the students and aspirants of Chemistry12th.pptx
Organic Name Reactions for the students and aspirants of Chemistry12th.pptxVS Mahajan Coaching Centre
 
SOCIAL AND HISTORICAL CONTEXT - LFTVD.pptx
SOCIAL AND HISTORICAL CONTEXT - LFTVD.pptxSOCIAL AND HISTORICAL CONTEXT - LFTVD.pptx
SOCIAL AND HISTORICAL CONTEXT - LFTVD.pptxiammrhaywood
 
“Oh GOSH! Reflecting on Hackteria's Collaborative Practices in a Global Do-It...
“Oh GOSH! Reflecting on Hackteria's Collaborative Practices in a Global Do-It...“Oh GOSH! Reflecting on Hackteria's Collaborative Practices in a Global Do-It...
“Oh GOSH! Reflecting on Hackteria's Collaborative Practices in a Global Do-It...Marc Dusseiller Dusjagr
 
A Critique of the Proposed National Education Policy Reform
A Critique of the Proposed National Education Policy ReformA Critique of the Proposed National Education Policy Reform
A Critique of the Proposed National Education Policy ReformChameera Dedduwage
 
call girls in Kamla Market (DELHI) 🔝 >༒9953330565🔝 genuine Escort Service 🔝✔️✔️
call girls in Kamla Market (DELHI) 🔝 >༒9953330565🔝 genuine Escort Service 🔝✔️✔️call girls in Kamla Market (DELHI) 🔝 >༒9953330565🔝 genuine Escort Service 🔝✔️✔️
call girls in Kamla Market (DELHI) 🔝 >༒9953330565🔝 genuine Escort Service 🔝✔️✔️9953056974 Low Rate Call Girls In Saket, Delhi NCR
 
Introduction to AI in Higher Education_draft.pptx
Introduction to AI in Higher Education_draft.pptxIntroduction to AI in Higher Education_draft.pptx
Introduction to AI in Higher Education_draft.pptxpboyjonauth
 
POINT- BIOCHEMISTRY SEM 2 ENZYMES UNIT 5.pptx
POINT- BIOCHEMISTRY SEM 2 ENZYMES UNIT 5.pptxPOINT- BIOCHEMISTRY SEM 2 ENZYMES UNIT 5.pptx
POINT- BIOCHEMISTRY SEM 2 ENZYMES UNIT 5.pptxSayali Powar
 
Introduction to ArtificiaI Intelligence in Higher Education
Introduction to ArtificiaI Intelligence in Higher EducationIntroduction to ArtificiaI Intelligence in Higher Education
Introduction to ArtificiaI Intelligence in Higher Educationpboyjonauth
 
Painted Grey Ware.pptx, PGW Culture of India
Painted Grey Ware.pptx, PGW Culture of IndiaPainted Grey Ware.pptx, PGW Culture of India
Painted Grey Ware.pptx, PGW Culture of IndiaVirag Sontakke
 
Employee wellbeing at the workplace.pptx
Employee wellbeing at the workplace.pptxEmployee wellbeing at the workplace.pptx
Employee wellbeing at the workplace.pptxNirmalaLoungPoorunde1
 
How to Make a Pirate ship Primary Education.pptx
How to Make a Pirate ship Primary Education.pptxHow to Make a Pirate ship Primary Education.pptx
How to Make a Pirate ship Primary Education.pptxmanuelaromero2013
 
Kisan Call Centre - To harness potential of ICT in Agriculture by answer farm...
Kisan Call Centre - To harness potential of ICT in Agriculture by answer farm...Kisan Call Centre - To harness potential of ICT in Agriculture by answer farm...
Kisan Call Centre - To harness potential of ICT in Agriculture by answer farm...Krashi Coaching
 
Enzyme, Pharmaceutical Aids, Miscellaneous Last Part of Chapter no 5th.pdf
Enzyme, Pharmaceutical Aids, Miscellaneous Last Part of Chapter no 5th.pdfEnzyme, Pharmaceutical Aids, Miscellaneous Last Part of Chapter no 5th.pdf
Enzyme, Pharmaceutical Aids, Miscellaneous Last Part of Chapter no 5th.pdfSumit Tiwari
 
internship ppt on smartinternz platform as salesforce developer
internship ppt on smartinternz platform as salesforce developerinternship ppt on smartinternz platform as salesforce developer
internship ppt on smartinternz platform as salesforce developerunnathinaik
 
भारत-रोम व्यापार.pptx, Indo-Roman Trade,
भारत-रोम व्यापार.pptx, Indo-Roman Trade,भारत-रोम व्यापार.pptx, Indo-Roman Trade,
भारत-रोम व्यापार.pptx, Indo-Roman Trade,Virag Sontakke
 
Class 11 Legal Studies Ch-1 Concept of State .pdf
Class 11 Legal Studies Ch-1 Concept of State .pdfClass 11 Legal Studies Ch-1 Concept of State .pdf
Class 11 Legal Studies Ch-1 Concept of State .pdfakmcokerachita
 
BASLIQ CURRENT LOOKBOOK LOOKBOOK(1) (1).pdf
BASLIQ CURRENT LOOKBOOK  LOOKBOOK(1) (1).pdfBASLIQ CURRENT LOOKBOOK  LOOKBOOK(1) (1).pdf
BASLIQ CURRENT LOOKBOOK LOOKBOOK(1) (1).pdfSoniaTolstoy
 
Blooming Together_ Growing a Community Garden Worksheet.docx
Blooming Together_ Growing a Community Garden Worksheet.docxBlooming Together_ Growing a Community Garden Worksheet.docx
Blooming Together_ Growing a Community Garden Worksheet.docxUnboundStockton
 

Dernier (20)

TataKelola dan KamSiber Kecerdasan Buatan v022.pdf
TataKelola dan KamSiber Kecerdasan Buatan v022.pdfTataKelola dan KamSiber Kecerdasan Buatan v022.pdf
TataKelola dan KamSiber Kecerdasan Buatan v022.pdf
 
Organic Name Reactions for the students and aspirants of Chemistry12th.pptx
Organic Name Reactions  for the students and aspirants of Chemistry12th.pptxOrganic Name Reactions  for the students and aspirants of Chemistry12th.pptx
Organic Name Reactions for the students and aspirants of Chemistry12th.pptx
 
SOCIAL AND HISTORICAL CONTEXT - LFTVD.pptx
SOCIAL AND HISTORICAL CONTEXT - LFTVD.pptxSOCIAL AND HISTORICAL CONTEXT - LFTVD.pptx
SOCIAL AND HISTORICAL CONTEXT - LFTVD.pptx
 
“Oh GOSH! Reflecting on Hackteria's Collaborative Practices in a Global Do-It...
“Oh GOSH! Reflecting on Hackteria's Collaborative Practices in a Global Do-It...“Oh GOSH! Reflecting on Hackteria's Collaborative Practices in a Global Do-It...
“Oh GOSH! Reflecting on Hackteria's Collaborative Practices in a Global Do-It...
 
A Critique of the Proposed National Education Policy Reform
A Critique of the Proposed National Education Policy ReformA Critique of the Proposed National Education Policy Reform
A Critique of the Proposed National Education Policy Reform
 
call girls in Kamla Market (DELHI) 🔝 >༒9953330565🔝 genuine Escort Service 🔝✔️✔️
call girls in Kamla Market (DELHI) 🔝 >༒9953330565🔝 genuine Escort Service 🔝✔️✔️call girls in Kamla Market (DELHI) 🔝 >༒9953330565🔝 genuine Escort Service 🔝✔️✔️
call girls in Kamla Market (DELHI) 🔝 >༒9953330565🔝 genuine Escort Service 🔝✔️✔️
 
Introduction to AI in Higher Education_draft.pptx
Introduction to AI in Higher Education_draft.pptxIntroduction to AI in Higher Education_draft.pptx
Introduction to AI in Higher Education_draft.pptx
 
POINT- BIOCHEMISTRY SEM 2 ENZYMES UNIT 5.pptx
POINT- BIOCHEMISTRY SEM 2 ENZYMES UNIT 5.pptxPOINT- BIOCHEMISTRY SEM 2 ENZYMES UNIT 5.pptx
POINT- BIOCHEMISTRY SEM 2 ENZYMES UNIT 5.pptx
 
Introduction to ArtificiaI Intelligence in Higher Education
Introduction to ArtificiaI Intelligence in Higher EducationIntroduction to ArtificiaI Intelligence in Higher Education
Introduction to ArtificiaI Intelligence in Higher Education
 
Painted Grey Ware.pptx, PGW Culture of India
Painted Grey Ware.pptx, PGW Culture of IndiaPainted Grey Ware.pptx, PGW Culture of India
Painted Grey Ware.pptx, PGW Culture of India
 
Employee wellbeing at the workplace.pptx
Employee wellbeing at the workplace.pptxEmployee wellbeing at the workplace.pptx
Employee wellbeing at the workplace.pptx
 
How to Make a Pirate ship Primary Education.pptx
How to Make a Pirate ship Primary Education.pptxHow to Make a Pirate ship Primary Education.pptx
How to Make a Pirate ship Primary Education.pptx
 
Kisan Call Centre - To harness potential of ICT in Agriculture by answer farm...
Kisan Call Centre - To harness potential of ICT in Agriculture by answer farm...Kisan Call Centre - To harness potential of ICT in Agriculture by answer farm...
Kisan Call Centre - To harness potential of ICT in Agriculture by answer farm...
 
Enzyme, Pharmaceutical Aids, Miscellaneous Last Part of Chapter no 5th.pdf
Enzyme, Pharmaceutical Aids, Miscellaneous Last Part of Chapter no 5th.pdfEnzyme, Pharmaceutical Aids, Miscellaneous Last Part of Chapter no 5th.pdf
Enzyme, Pharmaceutical Aids, Miscellaneous Last Part of Chapter no 5th.pdf
 
internship ppt on smartinternz platform as salesforce developer
internship ppt on smartinternz platform as salesforce developerinternship ppt on smartinternz platform as salesforce developer
internship ppt on smartinternz platform as salesforce developer
 
भारत-रोम व्यापार.pptx, Indo-Roman Trade,
भारत-रोम व्यापार.pptx, Indo-Roman Trade,भारत-रोम व्यापार.pptx, Indo-Roman Trade,
भारत-रोम व्यापार.pptx, Indo-Roman Trade,
 
9953330565 Low Rate Call Girls In Rohini Delhi NCR
9953330565 Low Rate Call Girls In Rohini  Delhi NCR9953330565 Low Rate Call Girls In Rohini  Delhi NCR
9953330565 Low Rate Call Girls In Rohini Delhi NCR
 
Class 11 Legal Studies Ch-1 Concept of State .pdf
Class 11 Legal Studies Ch-1 Concept of State .pdfClass 11 Legal Studies Ch-1 Concept of State .pdf
Class 11 Legal Studies Ch-1 Concept of State .pdf
 
BASLIQ CURRENT LOOKBOOK LOOKBOOK(1) (1).pdf
BASLIQ CURRENT LOOKBOOK  LOOKBOOK(1) (1).pdfBASLIQ CURRENT LOOKBOOK  LOOKBOOK(1) (1).pdf
BASLIQ CURRENT LOOKBOOK LOOKBOOK(1) (1).pdf
 
Blooming Together_ Growing a Community Garden Worksheet.docx
Blooming Together_ Growing a Community Garden Worksheet.docxBlooming Together_ Growing a Community Garden Worksheet.docx
Blooming Together_ Growing a Community Garden Worksheet.docx
 

Dr. Mora's Parent Perceptions of Trauma-informed Assessments

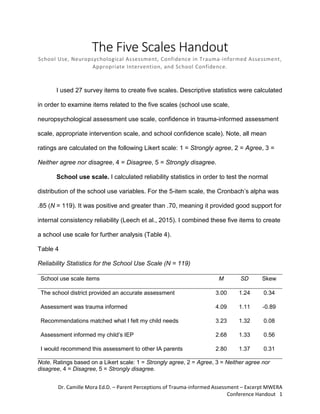
  • 1. Dr. Camille Mora Ed.D. – Parent Perceptions of Trauma-informed Assessment – Excerpt MWERA Conference Handout 1 The Five Scales Handout School Use, Neuropsychological Assessment, Confidence in Trauma-informed Assessment, Appropriate Intervention, and School Confidence. I used 27 survey items to create five scales. Descriptive statistics were calculated in order to examine items related to the five scales (school use scale, neuropsychological assessment use scale, confidence in trauma-informed assessment scale, appropriate intervention scale, and school confidence scale). Note, all mean ratings are calculated on the following Likert scale: 1 = Strongly agree, 2 = Agree, 3 = Neither agree nor disagree, 4 = Disagree, 5 = Strongly disagree. School use scale. I calculated reliability statistics in order to test the normal distribution of the school use variables. For the 5-item scale, the Cronbach’s alpha was .85 (N = 119). It was positive and greater than .70, meaning it provided good support for internal consistency reliability (Leech et al., 2015). I combined these five items to create a school use scale for further analysis (Table 4). Table 4 Reliability Statistics for the School Use Scale (N = 119) School use scale items M SD Skew The school district provided an accurate assessment 3.00 1.24 0.34 Assessment was trauma informed 4.09 1.11 -0.89 Recommendations matched what I felt my child needs 3.23 1.32 0.08 Assessment informed my child’s IEP 2.68 1.33 0.56 I would recommend this assessment to other IA parents 2.80 1.37 0.31 Note. Ratings based on a Likert scale: 1 = Strongly agree, 2 = Agree, 3 = Neither agree nor disagree, 4 = Disagree, 5 = Strongly disagree.
  • 2. Dr. Camille Mora Ed.D. – Parent Perceptions of Trauma-informed Assessment – Excerpt MWERA Conference Handout 2 Neuropsychological assessment use scale. I calculated reliability statistics in order to test the normal distribution of the school use variables. Two statements were considered with respect to whether neuropsychological assessments were more accurate and offered better outcomes for IA students. For the 2-item scale, the Cronbach’s alpha was .78 (n = 44). It was positive and greater than .70; therefore, it provided good support for internal consistency reliability (Leech et al., 2015). The two items were combined to create a neuropsychological assessment use scale for further analysis (Table 3). Originally this scale was meant to have the same five items as the school use scale, but for neuropsychological assessments. However, Cronbach’s alpha was low on the neuropsychological assessment use scale. This could have been due to the relatively small n value of 44. Table 5 displays more information about the other items related to this scale. Table 5 Reliability Statistics for Neuropsychological Assessment Use Scale Items Neuropsychological assessment use scale items N M SD Skew Provided an accurate assessment. 73 2.34 0.620 1.61 Recommendations matched what I felt my child needed. 73 2.52 0.877 1.57 Note. Ratings based on a Likert scale: 1 = Strongly agree, 2 = Agree, 3 = Neither agree nor disagree, 4 = Disagree, 5 = Strongly disagree. Table 6 displays the agreement level respondents had to selected statement variables related to the accuracy of assessments. In the section for neuropsychological assessment, the highest agreement was for “The neuropsychologist provided an accurate assessment” (M = 2.45). The lowest amount of agreement was for “My child
  • 3. Dr. Camille Mora Ed.D. – Parent Perceptions of Trauma-informed Assessment – Excerpt MWERA Conference Handout 3 received a trauma-informed assessment” (M = 3.09). In this table, the n values are low. The low n in relation to the neuropsychological assessment data could have to do with the practical fact that such an assessment costs around $5,000, compared to the school/district assessment, which is free to families, and many families choose not to have their child assessed that way. This could be because only a total of 70 families (53%) reported that their children received neuropsychological assessments, and as in the rest of the survey, many families did not answer all the question. The second half of Table 6 displays the ratings of accuracy of school/district assessments. In this table, the n values are higher than in the previous table, and the standard deviations are higher as well. Highest agreement was for “This assessment informed my child’s IEP” (M = 2.67). The lowest degree of agreement was for “My child received a trauma-informed assessment” (M = 4.02). Table 6 Accuracy of Assessment Based on Type Item n M SD Neuropsychological assessment The neuropsychologist provided an accurate assessment. 56 2.45 0.711 I would recommend this type of assessment to other parents of internationally adopted children. 41 2.51 0.746 Recommendations from the neuropsychologist matched what I felt/feel my child needs. 70 2.56 0.862 This assessment informed my child’s IEP 73 2.97 1.030 My child received a trauma-informed assessment 82 3.09 1.090 School/district assessment The school/district provided an accurate assessment. 134 2.96 1.200 I would recommend this type of assessment to other parents of internationally adopted kids. 129 2.78 1.330 Recommendations from the school matched what I felt/feel my child needs. 129 3.21 1.300 This assessment informed my child’s IEP. 126 2.67 1.300
  • 4. Dr. Camille Mora Ed.D. – Parent Perceptions of Trauma-informed Assessment – Excerpt MWERA Conference Handout 4 My child received a trauma-informed assessment. 129 4.02 1.130 Note. Ratings based on a Likert scale: 1 = Strongly agree, 2 = Agree, 3 = Neither agree nor disagree, 4 = Disagree, 5 = Strongly disagree. Confidence in trauma-informed assessments scale. Data in confidence in trauma-informed assessments variables included five items. For this 5-item scale, the Cronbach’s alpha was .75 (N = 137). It was positive and greater than .70, thus it provided adequate support for internal consistency reliability (Leech et al., 2015). The alpha for this confidence in trauma-informed scale indicated good internal consistancy. These five items were then combined to create the confidence in trauma-informed assessments scale that was used for further analysis (Table 7). Table 7 Descriptive Statistics for Confidence in Trauma-Informed (TI) Assessment Scale Confidence in TI scale items N M SD Skew Child’s school uses TI instructional practices 137 3.73 1.20 -0.40 TI instructional practices would help my child succeed 137 1.70 0.91 1.19 Child’s teacher uses TI practices in the classroom 137 3.67 1.22 -0.48 Child is more secure in a TI environment 137 1.96 0.94 0.58 Child does better in a TI school 137 2.21 0.94 0.29 Note. Ratings based on a Likert scale: 1 = Strongly agree, 2 = Agree, 3 = Neither agree or disagree, 4 = Disagree to 5 = Strongly disagree. Appropriate intervention and opportunities scale. I calculated reliability statistics in order to test the normal distribution of the school use variables. Three statements were considered with respect to whether trauma-informed assessments enabled students to receive more appropriate interventions and opportunities. For the 3-
  • 5. Dr. Camille Mora Ed.D. – Parent Perceptions of Trauma-informed Assessment – Excerpt MWERA Conference Handout 5 item scale, the Cronbach’s alpha was .81 (n = 92). It was positive and greater than .70; therefore, it provided good support for internal consistency reliability (Leech et al., 2015). The three items were combined to create an appropriate intervention and opportunities scale for further analysis (Table 8). Table 8 Descriptive Statistics for Appropriate Interventions and Opportunities Scale Items Appropriate interventions and opportunities scale items N M SD Skew TI assessments allowed your child to receive more appropriate interventions. 92 1.89 1.07 0.24 TI assessments increased educational opportunities for your child. 92 2.30 1.23 0.53 TI assessments resulted in more appropriate classroom interventions. 92 2.59 1.36 0.25 Note. Ratings based on a Likert scale: 1 = Strongly agree, 2 = Agree, 3 = Neither agree nor disagree, 4 = Disagree, 5 = Strongly disagree. School confidence scale. I calculated reliability statistics in order to test the normal distribution of the school use variables. Twelve statements were considered with respect to parents’ confidence in the school’s ability to meet the needs of their IA student. For the 12-item scale, the Cronbach’s alpha was .95 (n = 86). It was positive and greater than .70; therefore, it provided good support for internal consistency reliability (Leech et al., 2015). The 12 items were combined to create a school confidence scale for further analysis (Table 9).
  • 6. Dr. Camille Mora Ed.D. – Parent Perceptions of Trauma-informed Assessment – Excerpt MWERA Conference Handout 6 Table 9 Descriptive Statistics for School Confidence Scale Items (N = 86) School confidence scale items M SD Skew My child is included in school activities. 2.20 1.24 1.20 School provided my student with an appropriate IEP. 2.29 0.91 0.38 My child’s teacher provides support in the classroom for my child. 2.30 0.99 0.52 Interventions align with my child’s IEP. 2.34 0.94 0.68 My child feels safe at school. 2.35 1.38 0.71 School provides appropriate assessments. 2.50 0.97 0.13 School honors and fulfills my child’s IEP or 504. 2.52 1.34 0.51 I am pleased with the services my child receives. 2.55 0.97 0.28 I am happy with how the school meets my child’s needs. 2.60 0.99 0.23 The school supports my child’s needs. 2.67 1.38 0.56 The school follows through on what they say. 2.77 1.30 0.49 My child is important to their school. 2.80 1.44 0.45 Note. Ratings based on a Likert scale: 1 = Strongly agree, 2 = Agree, 3 = Neither agree nor disagree, 4 = Disagree, 5 = Strongly disagree. Association Between the Scales Descriptive statistics were run in order to test the normal distribution of the five scales. The skewness of the scales is reported in Table 10. From the descriptive statistics, skew can be examined. “If the skewness is more than +1.0 or less than -1.0 the distribution is markedly skewed” (Leech et al., 2015, p. 22). If this is the case, it would mean that “one tail of the frequency distribution is longer than the other and if the mean and median are different, the curve is skewed” (Leech et al., 2015, p. 22). From the data I can see that most of the variable scales have a skewness between -1.0 and
  • 7. Dr. Camille Mora Ed.D. – Parent Perceptions of Trauma-informed Assessment – Excerpt MWERA Conference Handout 7 1.0, but the neuropsychological assessment use scale (see Table 4), shows skewness for the items “Provided an accurate assessment” to be 1.61 and “Recommendations matched what I felt my child needed” to be 1.57. These two items are considered nonnormal distributions. However, Leech et al (2015) state, “there are several ways to check this assumption in addition to checking the skewness value. If the mean, median and mode, are approximately equal, then you can assume that the distribution is approximately normally distributed” (p. 34). In the case of these two items, the means are 2.45 and 2.56, respectively; the medians are 2.0 for each item and the mode is 2 for each item. This would meet the criteria laid out by Leech et al. Although these items are skewed, the t tests and ANOVAs were sufficiently robust so that I was able to proced with the analysis. That said, it is important to note that there should be some caution with the interpretations as one of the items was moderately skewed. Table 10 Descriptive Statistics for Five Scales Scale n M SD Skew School use scale 134 3.12 0.98 0.26 Neuro. assessment use scale 76 2.48 0.76 0.28 Conf. in T-I assessment scale 196 2.79 0.79 0.17 Appropriate interv. and oppr. scale 170 3.58 1.93 0.19 School confidence scale 162 2.41 0.91 0.19 Note. Ratings based on a Likert scale: 1 = Strongly agree, 2 = Agree, 3 = Neither agree nor disagree, 4 = Disagree, 5 = Strongly disagree. Correlations were run for the five scales. Two relationships were statistically significant. One was the association between the confidence in trauma-informed assessment scale and the school use scale. The direction of the correlation was positive. This means school/district assessments were correlated to confidence in
  • 8. Dr. Camille Mora Ed.D. – Parent Perceptions of Trauma-informed Assessment – Excerpt MWERA Conference Handout 8 trauma-informed practices. The second was confidence in TI scale versus appropriate intervention scale. The direction was positive, which means confidence in TI was correlated to appropriate interventions. These intercorrelations were significant at the p =.01 level, where N = 81 (school use scale = 0.72, confidence in TI scale = 0.39). (See Table 11.) Table 11 Intercorrelations for the Five Scales (N = 81) Variable 1 2 3 4 5 School use scale -- 0.13 0.13 0.07 0.72** Neuro. assessment scale -- 0.04 0.12 -0.06 Confidence in TI scale -- 0.39** 0.16 Appropriate intervention scale -- 0.11 School confidence scale -- * p < .05; ** p < .01