2. 2
force, therefore the lower wishbones spherical bearing
was orientated vertically. The largest forces seen by the
upper wishbones spherical bearing come from braking,
therefore it was orientated tangent to the rotation about
the spindle. Fox coil-over 2.00” shocks were selected due
to their long travel and the adjustable dual-spring setup
that controls roll and bottom out parameters. These long
travel shocks improve articulation and wheel travel, which
helps the tires maintain contact with the ground on
uneven terrain. Custom uprights were designed of water
jet steel plate welded together in a structurally rigid box.
These uprights were engineered with a king pin inclination
of 13.50°, and a scrub radius of 1.50” that promotes
tension in the steering components. Front hubs from a
Yamaha Raptor were repurposed due to cost savings and
manufacturing limitations. Ride height was set at approx.
13.25” with 13.80” of total wheel travel; 6.55” of bump
travel and 7.25” of rebound travel. The front roll center lies
7.00” above the ground, which is slightly lower than the
rear roll center of 9.10”. This down sloping roll axis, from
rear to front, will act as a mechanical advantage for the
center of gravity to load the front tires in a turn. Static toe-
out of -0.30° was chosen to keep the suspension
components in their strongest modes, and static camber
of -1.50° to counteract tire compliance in turning, i.e.
keeping the tires normal to the ground. Finally, 10.00° of
caster and zero caster-change were chosen to assist the
transmission of forces when impacting obstacles and
preventing false driver feedback.
ANALYSIS – Lotus Suspension Analysis Software,
SHARK®, was used to analyze the front suspension in
bump, roll, and steering applications. Data for toe change
was exported to Excel, Figure 3, and shows the front tires
toe-in when rebounding. This was designed to keep the
tie rods in compression in the case of a front nose dive
landing off a jump.
Figure 3: Toe Change Graph
Figure 4 shows the vehicle with the maximum amount of
roll before the tires lift off the ground in a turn. Roll steer
was engineered such that the inner tire toes-out more
than the outer tire in a turn. This allows the vehicle to turn
about a single point, improving handling at higher speeds.
Figure 4: SHARK Model Roll Analysis
Finite Element Analysis (FEA) was completed on the front
suspension, Figure 5, and showed high stress
concentrations in the upright around the spindle carrier.
This analysis was calculated at an 8’ drop onto the fully
extended front suspension. To neutralize these stresses,
the spindle carrier was fully boxed-in with water jet steel.
Figure 5: Front Suspension Drop Analysis
REAR SUSPENSION
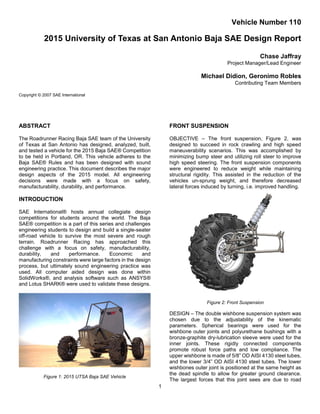
OBJECTIVE – The rear suspension, Figure 6, was
designed to limit toe change, with respect to wheel travel,
to ± 0.05°, and to function best on uneven terrain.
Figure 6: Rear Suspension
3. 3
DESIGN – A five-link independent suspension system
was the best solution for this year’s vehicle. This was
chosen over a trailing-arm system because the two
trailing links in a five-link system could be altered to
change the anti-squat characteristics of the vehicle. The
links are made of AISI 4130 steel tube with opposite
threaded rod ends at either end of the tube. The two
trailing links and the toe link are 5/8” OD tubing, and the
two lateral links are 3/4” OD tubing. The links were
attached to the bearing carrier by water jet steel tabs, thus
avoiding expensive machining services. The tabs holding
the links to the frame were designed to hold two links per
tab, maintaining the proper distance between the
mounting positions. This removes one degree of freedom
when manufacturing, improving quality control of the
vehicle. The same Fox coil-over 2.00” shocks were used
as the front, but wheel travel is limited to 11.20” due to the
CV drive shaft joints operating angle. The rear suspension
has 6.25” of bump travel, and 4.95” of rebound. Static toe
was set to 0.0° with limited toe change, Figure 3. This will
keep the vehicle from behaving unpredictably when the
driver accelerates after a large bump or jump. Static
camber was set to -1.50° to work in conjunction with the
front suspension kinematics. Polaris RZR hubs were
repurposed due to the matching spline pattern of the CV
drive shafts and the high cost of machining female
splines. These hubs were post machined to decrease
weight and maintain a factor of safety of 1.2 in severe drop
conditions.
ANALYSIS – The rear suspension was also analyzed in
SHARK to determine the toe link placement, Figure 7.
This figure shows the roll axis and theoretical center of
gravity location. The camber change was designed to
mimic the front suspensions kinematic trail.
Figure 7: SHARK Model
Spring rates were calculated to critically damp the
vehicle hitting a bump at 20 mph with a weight bias of
45/55 (front/rear) and the weight of a 95th percentile
male driver. A static structural analysis was completed
on the rear components, Figure 8. This FEA was similar
to the one completed on the front suspension. Results
showed the weakest point in the rear suspension system
was the lateral link outer rod ends. To counter this,
larger rod ends were implemented.
Figure 8: Rear Suspension Drop Analysis
DRIVETRAIN
OBJECTIVE – The overall goal for the drivetrain was to
design a light weight and durable system in an
economically friendly manner. This was accomplished by
avoiding advance manufacturing processes and
purchasing commercial products to complement the
provided Briggs and Stratton engine such as Continuous
Variable Transmission (CVT), gear reduction/differential
unit, and CV drive shafts (Figure 9).
Figure 9: Drivetrain
DESIGN – The drivetrain system was designed around
the provided Briggs and Stratton 10hp engine. A CV-Tech
CVT belt driven transmission was purchased because it
complemented the engine and required less post-
processing than its competitors. This unit outputs a
maximum ratio of 3.00:1 and a minimum ratio of 0.43:1,
which was tuned for the engines operating range. A CVT
is also a safer choice. In the case of a locked up
powertrain, the belt will slip and prevent excess damage
to the engine or gearbox. The CVT is then connected to a
Dana Spicer H-12 FNR gearbox. This unit provides a gear
reduction of 12.58:1, a limited-slip differential, and
Forward-Neutral-Reverse helical gearing for greater
maneuverability. While this is a heavier alternative, the
gearing and differential components provide more benefit
to the overall vehicle. A coupler was then designed to
attach the internally splined output shafts of the H-12
4. 4
gearbox to the CV drive shafts. This coupler, Figure 10,
consists of a splined shaft attached to the CV drive shaft
via a rubber giubo, or flex disc. The giubo is bolted on
either side using alternative hole positions, so the splined
output shaft and the CV drive shaft are not directly
connected. With this design, the giubo acts as a torsional
damper to absorb impulses from situations like landing
the vehicle from a jump while the accelerator is engaged.
The giubo also provides ~3° of angular deflection to the
CV drive shafts 32° maximum operating angle, allowing
more travel of the rear suspension.
Figure 10: Drivetrain Coupler
The CV joints from a Polaris RZR, inboard and outboard,
were repurposed and attached to gun-bored and
balanced shafts. These CV joints were chosen due to the
mating of the outboard splines to the rear hubs, and the
large amount of plunge the inboard CV joint provides.
ANALYSIS – Drivetrain calculations, Figure 11, are based
on data from an engine dynamometer graph and factory
specifications of the other drivetrain components.
Figure 11: Drivetrain Calculations
These calculation show the expected dynamic output of
the vehicle. The largest variable in these calculations is
the coefficient of friction of the tires and the ground, and
the efficiency of the CVT and gearbox unit. Figure 12
shows the static analysis of the subframe with impulse
forces from the engine, gearbox, and braking components
in a situation where the vehicle is dropped from 8 ft and
the wheels are suddenly stopped from max RPM. This
component purposely has a higher factor of safety relative
to other components on the vehicle. This is to ensure a
rigid connection between the drivetrain components for a
higher efficiency of torque transmission.
Figure 12: Subframe Impulse Analysis
CONTROLS
OBJECTIVE – The objective of the controls system was
to provide a durable and responsive vehicle that was
capable of being driven by a 95th percentile male for 4+
hours consecutively. This system includes both steering
and braking subsystems.
DESIGN
Steering – The steering system was designed around a
10” OD steering wheel located ~18” from the drivers
chest. At this location, an average driver was found to
output 48 ft*lbs [4], and still have room to egress the
vehicle in 5 sec in case of an emergency. The steering
wheel was rigidly connected to a dual-link column with a
single sealed u-joint in the center. A steering rack with a
ratio of 12:1 was used to generate full steering motion with
0.75 turns of the steering wheel. This will prevent the need
for hand-over-hand driving, giving the driver more control
of the vehicle. Lastly, custom steering rack spacers were
designed to locate the inner tie rods accurately for the
proper roll steer characteristics.
Braking – The braking system was designed to lock up all
four tires at our theoretical top speed. Wilwood PS1 1.12”
bore calipers were used outboard on the front wheels and
inboard in the rear. This was done to help reduce the un-
sprung weight of the vehicle. Two 5/8” Wilwood brake
masters were used to keep the front and rear brake
Max Torque 19.90 ft*lb 2340 RPM
Max Power 10.60 hp 3740 RPM
RatioMIN 3.00 1 1100 RPM
RatioMAX TORQUE 1.82 1 2340 RPM
RatioMAX POWER 0.49 1 3740 RPM
RatioMAX 0.43 1 3800 RPM
Ratio
Efficiency
WeightVEHICLE
DiameterWHEEL
μRUBBER-DIRT
TorqueWHEEL @ MAX TORQUE
ωWHEEL @ MAX TORQUE
Velocity@MAX TORQUE
ωWHEEL @ MAX Power
Velocity@MAX POWER
Engine Output
CVT Transmission
Gearbox
Calculations
0.95
112.58
mph
RPM
mph
550.00
23.00
0.70
432.77
107.60
5.15
642.45
30.77
lb
in
-
ft*lb
RPM
5. 5
systems independent. Hard brake line connects the
masters and calipers to reduce the pressure loss due to
expansion. A cutting brake was implemented between the
rear brake master and the calipers. This will work in
conjunction with the gearbox differential and allow the
driver to lock one rear wheel independent of the other in
the case of high centering or taking a smaller radius turn.
The brake rotors are made of stainless steel due to its
high coefficient of friction and corrosive resistance
properties. The brake pedal provides a pedal ratio of 8:1
and can be repositioned 1” forward or back to
accommodate drivers of varying leg lengths.
ANALYSIS
Steering – The tie rods were constructed of 3/4" OD 4130
steel tube to be sacrificial parts. Analysis was done to
ensure that this tube would buckle before the upright or
the steering rack yield, as this is the quickest and most
inexpensive part to replace in the steering system.
Braking – Thermal analysis was conducted on the brake
rotors to compare geometry and the effects on cooling
rate. This analysis concluded that by increasing the
surface area of the rotors outer ring, the time to cool would
decrease, thus reducing the risk of brake fade. The brake
pedal was designed to endure 330 lbf for a minimum of
100,000 cycles. This is the 95th percentile male peak foot
output force with respect to the angle of thigh and calf in
a seated position [5].
FRAME
OBJECTIVE – The objective of the frame was to maintain
the minimum amount of space around a 95th percentile
male driver while still providing safety. The frame was also
designed to be within a torsional rigidity range of 800-
1200 lb/deg. to allow the frame to flex with the
suspension, Figure 13.
Figure 13: Frame
DESIGN – The suspension points and the drivetrain were
the driving factors for the basic frame design. AISI 4130
steel tubing was chosen due to its superior strength
properties. Tube sizing and node locations were based on
iterative analysis.
ANALYSIS – The frame was analyzed for several cases,
Figure 14. These cases were determined to simulate
loads developed in off-road driving conditions. The forces
were calculated using a composite spring rate to
compensate for the front/rear springs, tires, and
suspension compliance. A damping rate of 1.0 and an
impulse time of 0.8-1.2 seconds were used. These
assumptions led to force magnitudes of approximately
1800 lbf per tire in Case 1. Transfer functions were then
used to transmit the tire loads to the various suspension
nodes.
Figure 14: Frame Analysis Loading Cases
ANSYS® was used to complete static linear FEA of the
resulting nodal forces. Figure 15 shows the results of
Case 1, scaled to yield. As indicated, the frame does not
yield in this case. Cases 2-3 showed some yielding, but it
was determined that suspension components would yield
before the frame in these cases. Later analysis revealed
the vehicle would survive a 4ft drop at 35 mph landing on
one tire. And to validate driver safety, Cases 4-6 showed
no signs of yielding.
Figure 15: Frame Analysis Results, Case 1
CONCLUSION
Roadrunner Racing has designed and analyzed a vehicle
for the 2015 Baja SAE Competition. With a focus on
safety, manufacturability, durability, and performance,
this vehicle has been engineered and validated to
overcome the harshest of terrains.
6. 6
ACKNOWLEDGMENTS
Roadrunner Racing would like to acknowledge the
support from our sponsors: Weebz Welding and Water
Jetting, Woods Cycle Country, Colbath Transmissions,
Rae Acuna, UTSA College of Engineering, Zachry
Holdings, Boeing, Intertek, and O’Rielly Auto Parts.
Roadrunner Racing would also like to acknowledge our
professional mentors: Prof. Jim Johnson, Dr. John
Simonis, Allen Weible, Paul Krueger, and David
Kuenstler.
REFERENCES
1. SAE International®, “Baja SAE® Rules”. 2015. Web.
http://www.sae.org/students/mbrules.pdf
2. Gillespie, Thomas D. “Fundamentals of Vehicle
Dynamics”. Print.
3. W.F. Milliken and D.L. Milliken, “Race Car Vehicle
Dynamics”. 1995. Print.
4. Steven Fox. “Cockpit Control Forces”. 2010. Web.
5. National Aeronautics and Space Administration. Man-
Systems Integration Standards. Volume I, Section 4.
“Human Performance Capabilities”. Web.
APPENDIX
See attached.