1. (200)
0
200
400
600
800
1,000
1,200
1,400
2009 2010 2011 2012 2013 2014
Total Revenue Gross Profit Operating Income
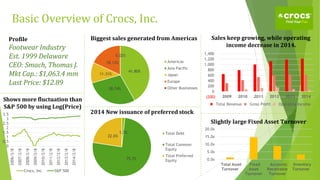
Basic Overview of Crocs, Inc.
41.80%
28.74%
11.31%
18.13%
0.02%
Americas
Asia Pacific
Japan
Europe
Other Businesses
Biggest sales generated from Americas Sales keep growing, while operating
income decrease in 2014.
1.7%
75.7%
22.6%
Total Debt
Total Common
Equity
Total Preferred
Equity
2014 New issuance of preferred stock
0.0x
5.0x
10.0x
15.0x
20.0x
Total Asset
Turnover
Fixed
Asset
Turnover
Accounts
Receivable
Turnover
Inventory
Turnover
Slightly large Fixed Asset Turnover
0
0.5
1
1.5
2
2.5
3
3.5
2006/2/8
2007/2/8
2008/2/8
2009/2/8
2010/2/8
2011/2/8
2012/2/8
2013/2/8
2014/2/8
Crocs, Inc. S&P 500
Shows more fluctuation than
S&P 500 by using Log(Price)
Profile
Footwear Industry
Est. 1999 Delaware
CEO: Smach, Thomas J.
Mkt Cap.: $1,063.4 mm
Last Price: $12.89
2. Potential Synergies
Revenue Perspective:
• Since two company focus a little
differently on casual shoes for Crocs
and sporty shoes for Under Armour,
the customer base does not overlap
too much and therefore the total base
could increase.
• Under Armour does not have much
sales portion in foreign countries.
Hence, through the distributors of
Crocs, Under Armour could have
bigger sales; on the other hand, Under
Armour could provide competitive
brand name for Crocs.
Cost Pespective:
• Crocs has big amount of sales in
United States and thus Under Armour
could integrate some operation.
• In Asia Pacific region, since Crocs
already has some distribution and
retailers, Under Armour could use
little capital to invest in Asia market.
• Since Crocs already has some patents
such as rubber materials, which may
provide Under Armour some base in
R&D and thus saves R&D costs.
• Remove inefficient departments or
products.
RevenueIncrease
CostReduction
3. Valuation of Crocs, Inc. and Recommendation
$0 $5 $10 $15 $20 $25 $30 $35
Precedent Transaction
Public Traded Comparable
Discounted Cash Flow
Valuation
• DCF: $20.19-$29.39
• Public Traded Comparable
companies: $10.56-$26.67
• Precedent Transaction:
$8.61-$20.19
Suggest Price and Accretion
• Price: $17.74-$23.97
• Accretion/Dilution: will
generate dilution for first
year, but accretion in
following year and grow fast
Reason
• Synergies after merger
could drive up buying price
even more
• Advantages of strong brand
name and American market