Collective Mining | Corporate Presentation - April 2024
Claude Resources Inc. Q1 2012 MD&A and Financials
1. MANAGEMENT’S DISCUSSION AND ANALYSIS
&
CONSOLIDATED FINANCIAL STATEMENTS
MARCH 31, 2012
FOR FURTHER INFORMATION PLEASE CONTACT:
Marc Lepage, Manager, Investor Relations
Claude Resources Inc.
200, 224 – 4th Avenue South
Saskatoon, Saskatchewan Phone: (306) 668-7505
Canada S7K 5M5 Fax: (306) 668-7500
ir@clauderesources.com www.clauderesources.com
TRADING SYMBOLS:
TSX – CRJ
NYSE Amex - CGR
2. MANAGEMENT’S DISCUSSION AND ANALYSIS
The following Management’s Discussion and Analysis (“MD&A”) of the consolidated operating and
financial performance of Claude Resources Inc. (“Claude” or the “Company”) for the three months
ended March 31, 2012 with the corresponding period of 2011 is prepared as of May 10, 2012. This
discussion is the responsibility of Management and has been prepared using International Financial
Reporting Standards (“IFRS”), as issued by the International Accounting Standards Board. This
discussion should be read in conjunction with the Company’s March 31, 2012 condensed
consolidated financial statements and notes thereto and the Company’s 2011 annual MD&A and
2011 audited consolidated financial statements and notes thereto. The Board of Directors has
approved the disclosure presented herein. All amounts referred to in this discussion are expressed in
Canadian dollars, except where otherwise indicated.
OVERVIEW
Claude Resources Inc., incorporated pursuant to the Canada Business Corporations Act, is a gold producer
with shares listed on both the Toronto Stock Exchange (TSX-CRJ) and the NYSE Amex (NYSE Amex-
CGR). The Company is also engaged in the exploration and development of gold mineral reserves and
mineral resources. The Company’s entire asset base is located in Canada. Its main revenue generating asset
is the 100 percent owned Seabee Gold Operation, located in northern Saskatchewan. Claude also owns 100
percent of the Amisk Gold Project in northeastern Saskatchewan and 100 percent of the 10,000 acre
Madsen Property located in the Red Lake gold camp of northwestern Ontario.
PRODUCTION, EXPLORATION, FINANCIAL AND CORPORATE DEVELOPMENT
HIGHLIGHTS
Production
• Q1 2012 production of 9,574 ounces of gold (Q1 2011: 9,539 ounces of gold).
• Seabee Central Milling Facility expanded to a peak capacity of 1,050 tonnes. Further expansion is
underway to enable a sustained capacity of over 1,000 tonnes.
• Seabee Mine Shaft Extension Project to be completed in second half of 2012.
• Expansion to Seabee Camp Facilities ongoing.
Exploration
• Positive Metallurgical results at the Amisk Gold Project. Initial metallurgical testing indicates that
gold and silver mineralization is amenable to conventional cyanide leaching. Results from testing
on three composite samples from the Amisk Gold Deposit have returned an average of 89.4
percent recovery for gold, ranging from 85.2 percent to 91.7 percent and an average of 80.8
percent recovery for silver, ranging from 66.4 percent to 92.8 percent.
• Inferred resource base at Seabee Gold Operation increased 236 percent. The inclusion of the L62
Zone and Santoy Gap deposits into Mineral Reserves and Mineral Resources came only six and
nine months after their respective discoveries. More importantly, these discoveries are in close
proximity to current mining infrastructure and will be integrated into an updated life of mine plan
anticipated during the third quarter. The increase in resource ounces in 2011 demonstrates the
potential that exists at the Seabee Gold Operation.
• As a follow-up to the Company’s 2011 exploration programs, Claude has budgeted approximately
$15.5 million to support the continuation of its extensive exploration programs at the Seabee,
Amisk and Madsen Properties during 2012. At the Seabee Gold Operation, the Company plans to
drill 130,000 metres (70,000 metres regionally and 60,000 metres underground) during 2012. At
Madsen, Claude has approved a 29,000 metre underground and surface exploration program. The
program will include two underground rigs and one surface rig, targeting to complete 40 to 50
holes. Exploration will focus on continued testing of the 8 Zone Trend as well as the McVeigh
and Austin Tuff depth continuity. Finally, at the 24,350 hectare Amisk Gold Project, Claude will
3. Q1 2012 Management’s Discussion and Analysis
(in thousands of CDN dollars, except as otherwise noted) Page 2
update its National Instrument 43-101 resource calculation, conduct an external Preliminary
Economic Assessment and an evaluation of the underground potential.
Financial
• Net loss of $0.5 million, or $0.00 per share, for the three months ended March 31, 2012 (March
31, 2011 – net profit of $1.8 million, or $0.01 per share).
• Cash flow from operations(1) before net changes in non-cash operating working capital of $2.6
million, or $0.02 per share, for the three months ended March 31, 2012, down 28 percent from
$3.6 million, or $0.03 per share, for the three months ended March 31, 2011.
• Gold sales during the first quarter of 2012 of 9,547 ounces at an average price of $1,681 (U.S.
$1,679) for revenue of $16.1 million, up 21 percent from first quarter 2011 revenue of $13.3
million. This was in line with Management’s forecast for the first quarter.
• $16.4 million of cash, cash equivalents and short term investments and working capital of $16.2
million as at March 31, 2012.
Corporate Development
• During the first quarter of 2012, the Company announced the closing of its acquisition of all of the
outstanding shares of St. Eugene Mining Corporation Limited (“St. Eugene”; TSXV: SEM) that it
did not already own. The transaction was accomplished pursuant to the terms of a court approved
plan of arrangement completed under the Business Corporations Act (British Columbia) (the
“Arrangement”). Under the Arrangement, Claude acquired all of the outstanding common shares
of St. Eugene in exchange for the issuance of approximately 8.7 million common shares of
Claude. In addition to Claude shares, former shareholders of St. Eugene also received 0.25 of a
common share of Satori Resources Inc. (“Satori”). As part of the Arrangement, Claude also
exchanged all outstanding warrants of St. Eugene for warrants of Claude and reduced its existing
net smelter return royalty on the Tartan Lake Mine Project from a sliding scale to 2 percent. Upon
closing of the transaction, Claude received the same pro-rata stake in Satori that it had in St.
Eugene.
MISSION AND VISION
The Company’s mission is to create and deliver significant stakeholder value through the exploration,
development and mining of gold and other precious metals. Its vision is to be valued by all stakeholders
for its ability to discover, develop and produce gold and other precious metals in a disciplined, safe,
environmentally responsible and profitable manner.
GOALS AND KEY PERFORMANCE DRIVERS – MEASURING THE COMPANY’S RESULTS
The Company’s goals and key performance drivers include:
• Pursuing best practices in the areas of safety, health and the environment;
• Increasing its resource base through aggressive exploration programs;
• Improving operating margins at the Seabee Gold Operation;
• Strengthening the Balance Sheet and maintaining liquidity in order to reduce financial risk;
• Consider strategically attractive opportunities and accretive transactions; and
• Ensuring that the Company’s share price reflects underlying value.
Safety, Health and the Environment
The Company strives to protect the safety and health of its employees and the environment it operates in.
Claude is continuing to look for ways to improve processes to increase safety, health and environmental
performance.
Claude Resources Inc.
4. Q1 2012 Management’s Discussion and Analysis
(in thousands of CDN dollars, except as otherwise noted) Page 3
During the first quarter of 2012, the Company continued with pursuing best practices in the areas of safety
health and the environment and its stated goal of “Mission Zero” in matters related to Safety, Health and
the Environment. Claude has expanded its Safety, Training and Environmental Departments as well as
retained external professionals to conduct periodic reviews of its work practices, workplaces and
Management Systems. As part of Claude’s commitment towards “Zero Injury” and “Zero Environmental
Exceedence”, the Company established operational objectives of reducing these incidents year over year.
To measure its objectives relating to safety, health and the environment, the Company utilizes a Safety,
Health and Environment Managements System (“SHEMS”). For Health and Safety, the Company also
utilizes the Total Recordable Incident Rate (“TRIR”) metric, a common industry rating that is used to
determine the number of serious injuries (medical incidents and higher) that a company has for every
200,000 hours worked. Management utilizes the TRIR metric because it considers all incidents that have
caused serious harm to the Company’s workforce, thereby enabling the Company to be more proactive with
its policies and procedures designed to improve and maintain safety.
By the end of 2011, the Company’s TRIR was 6.7 per 200,000 hours, an improvement of 40 percent since
2008. Despite this improvement, at March 31, 2012, the Company’s TRIR increased to 8.2 per 200,000
hours, slightly above the Company’s target of 7.0. Systems and processes are being monitored with the
intention of improving this statistic.
Management believes having success in these critical areas will place Claude in a position to be recognized
as a leader in matters related to Safety, Health and the Environment.
Increasing Claude’s Resource Base Through Aggressive Exploration Programs
During the first quarter of 2012, the Company continued with its objective of increasing its resource base
through aggressive exploration programs at its Seabee Gold Operation, Amisk Gold Project and Madsen
Property.
Since 2008, the Company’s NI 43-101 Resource Base has increased over 400 percent. This increase is
attributable to the discovery and delineation of the L62 and Santoy Gap deposits, which increased Mineral
Reserves and Mineral Resources at the Seabee Gold Operation from 662,000 ounces to 1,300,000 ounces.
Results from exploration at the Company’s Amisk (1,566,000 gold equivalent ounces) and Madsen
(1,255,000 ounces) projects have also contributed to this increase.
As a follow-up to the Company’s 2011 exploration programs, Claude has budgeted approximately $15.5
million to support the continuation of its extensive exploration programs at the Seabee, Amisk and Madsen
Properties during 2012. At the Seabee Gold Operation, the Company plans to drill 130,000 metres (70,000
metres regionally and 60,000 metres underground) during 2012. At Madsen, Claude has approved a 29,000
metre underground and surface exploration program. The program will include two underground rigs and
one surface rig, targeting to complete 40 to 50 holes. Exploration will focus on continued testing of the 8
Zone Trend as well as the McVeigh and Austin Tuff depth continuity. Finally, at the 24,350 hectare Amisk
Gold Project, Claude will update its National Instrument 43-101 resource calculation, conduct an external
Preliminary Economic Assessment and an evaluation of the underground potential.
Looking forward, the Company is focused on expanding its exploration program to continue to add to its
ounces in inventory in politically safe Canada.
Seabee Gold Operation
At the Seabee Gold Operation, exploration targets include the Seabee Gold Mine, Santoy 8 Gold Mine,
Santoy Gap, L62 Zone and Neptune. During 2011, the Company focused its gold exploration efforts on
drilling at Seabee Deep, at L62, at the Santoy Gap and on continued development of satellite ore bodies.
The newly discovered L62 Zone is located approximately 200 metres from existing development and
operations on multiple levels in the hanging wall of the Seabee Mine. High grade results from the L62
Zone will have a positive impact on the Seabee Mine’s production profile during 2012.
Claude Resources Inc.
5. Q1 2012 Management’s Discussion and Analysis
(in thousands of CDN dollars, except as otherwise noted) Page 4
The Santoy Gap drill program has intercepted multiple high-grade intervals, significantly expanding the
strike length and width of the mineralized system. Drilling has intercepted multiple high-grade intervals,
significantly expanding the strike length and width of the mineralized system and has expanded the Santoy
Gap and Santoy 8 system to in excess of 1.8 kilometres long.
As a follow-up to the successful 2011 drill program at the Seabee Gold Operation, the Company has
planned a 130,000 metre program for 2012.
Amisk Gold Project
The Amisk Gold Property is located 20 kilometres southwest of Flin Flon, Manitoba and hosts the Amisk
Gold Deposit, the past-producing Monarch Mine, as well as a large number of gold occurrences and
prospects. At 24,350 hectares, this gold and silver exploration property is one of the largest land positions
in the Flin Flon mineral district.
In 2010, SRK Consulting (Canada) Inc. (“SRK”) was engaged to prepare an independent mineral resource
evaluation and Technical Report for the Amisk Gold Project. The independent mineral resource statement
was released in the first quarter of 2011 and outlined an Indicated Resource of 921,000 ounces of 0.95
grams of gold equivalent (“Au Eq”) per tonne and an Inferred Resource of 645,000 ounces at 0.70 grams of
Au Eq per tonne. This geological model and open pit resource estimate was generated through the
successful integration of the Company’s 2010 exploration program with historic drilling and was the
culmination of an aggressive 12 month exploration program and is a major milestone for the Amisk Gold
Project and Claude.
During the second half of 2011, positive metallurgical and engineering results were reported from the
Amisk Gold Project. Initial metallurgical testing indicates that gold and silver mineralization is amenable
to conventional cyanide leaching. Results from testing on three composite samples from the Amisk Gold
Deposit have returned an average of 89.4 percent recovery for gold, ranging from 85.2 percent to 91.7
percent and an average of 80.8 percent recovery for silver, ranging from 66.4 percent to 92.8 percent. In
addition to positive metallurgical testing, a total of 20 holes and 6,480 metres were drilled during 2011. The
program tested from surface to in excess of 700 metres depth and was designed to expand the limits of the
Amisk Gold Deposit as well as infill within the northern and eastern portion of the deposit. The 20 drill
holes successfully confirmed continuity of gold mineralization within the northern and eastern portion of
the deposit as well as demonstrated the potential for expansion to the east and southeast.
During 2012, the Company will update Amisk’s National Instrument 43-101 resource calculation, conduct
an external Preliminary Economic Assessment and will plan further exploration programs on the property,
including further evaluation of the underground potential.
Madsen Property
During 2012, the Company has budgeted a 29,000 metre, underground and surface-based drill program.
The program will include two underground rigs and one surface rig, targeting to complete 40 to 50 holes.
At the Madsen Property, the system remains open in all directions and shows strong similarities to high
grade mineralization characteristic of the Red Lake Belt. Claude’s objective is to fully assess the potential
for high grade gold mineralization while continuing to de-water the Madsen shaft to provide additional
underground exploration access. Phase I underground drilling of the 8 Zone program, from the 10th level,
confirmed high grade mineralization 450 feet(2) down plunge of the historic stopes within the 8 Zone as
well as confirming the existence of a sub-parallel footwall target. Phase I underground drilling
demonstrated that the 8 Zone is a series of high-grade, quartz-vein systems and silicification associated
with a complexly-folded package of mafic and ultramafic lithologies.
At Madsen, the Company believes that success from the Phase II drill program has the potential to
significantly grow the Company’s existing resource base at the fully-permitted and infrastructure-rich
Claude Resources Inc.
6. Q1 2012 Management’s Discussion and Analysis
(in thousands of CDN dollars, except as otherwise noted) Page 5
Madsen property. Phase II of the underground 8 Zone drill program continued to be a top priority for
Management. Underground 8 Zone drilling from the 16th level commenced early in the second quarter of
2011 and was ongoing throughout the first quarter of 2012 with two rigs active underground exploring the
8 Zone Trend. An additional surface rig at surface was exploring the Austin Deep target.
De-watering was ongoing throughout the first quarter of 2012 with water levels below the 17th level (there
are a total of 24 levels in the Madsen Shaft).
2012 Exploration Program
Continued success from the Company’s exploration programs should serve to:
• further extend the mine life at Seabee;
• potentially improve the project economics at the Company’s Amisk and Madsen Projects; and
• further increase the Company’s total resource base.
As a follow-up to the Company’s 2011 exploration programs, Claude has budgeted approximately $15.5
million to support the continuation of its extensive exploration programs at the Seabee, Amisk and Madsen
Properties during 2012. At the Seabee Gold Operation, the Company plans to drill 130,000 metres (70,000
metres regionally and 60,000 metres underground) during 2012. At Madsen, Claude has approved a 29,000
metre underground and surface exploration program. The program will include two underground rigs and
one surface rig, targeting to complete 40 to 50 holes. Exploration will focus on continued testing of the 8
Zone Trend as well as the McVeigh and Austin Tuff depth continuity. Finally, at the 24,350 hectare Amisk
Gold Project, Claude will update its National Instrument 43-101 resource calculation, conduct an external
Preliminary Economic Assessment and an evaluation of the underground potential.
Improving Operating Margins at the Seabee Gold Operation
The combination of strong average realized gold prices per ounce during the first quarter of 2012 offset by
increased mine operating costs, period over period, has contributed to a decrease in operating margins for
the Company. During the first quarter of 2012, net cash margin(3) decreased to $445 per ounce from $484
per ounce in the first quarter of 2011.
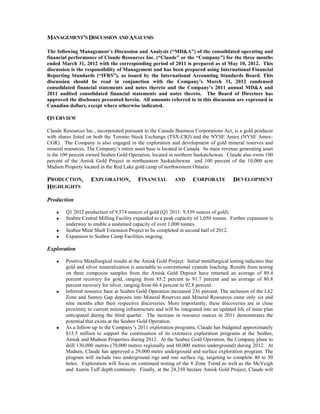
For the three months ended March 31, 2012, Claude realized a gold price of $1,681 (U.S. $1,679); March
31, 2011 - $1,408 (U.S. $1,428). For the quarter ended March 31, 2012, total cash cost per ounce(4) was
CDN $1,236 (U.S. $1,234), up 34 percent from the cash cost per ounce of CDN $924 (U.S. $937).
Figure 1: Average Gold Price Realized (CDN$) Figure 2: Cash Cost and Margin Realized (CDN$)
Per Ounce Sold Per Ounce Sold
Claude Resources Inc.
7. Q1 2012 Management’s Discussion and Analysis
(in thousands of CDN dollars, except as otherwise noted) Page 6
Table 1: Calculation of Net Cash Margin per Ounce
March 31 March 31
2012 2011
Revenue (thousands) $ 16,052 $ 13,322
Divided by ounces sold 9,547 9,461
Average Realized Price per Ounce $ 1,681 $ 1,408
Production costs (thousands) $ 11,796 $ 8,746
Divided by ounces sold 9,547 9,461
Total cash costs per ounce $ 1,236 $ 924
Net Cash Margin per Ounce Sold $ 445 $ 484
During 2012, the Company will focus on improving profitability of the Seabee Gold Operation through a
combination of improved grade control, cost controls and developing the production profile at lower cost
satellite ore bodies, including Santoy 8.
The Santoy Region is located approximately 14 kilometres east of the Seabee Gold Operation’s central
Milling Facility and is accessed via an all-weather road. The Company anticipates the Santoy 8 Project to
provide up to 50 percent of the overall feedstock to the Seabee Gold Operation’s central Milling Facility
and anticipates this contribution to be a positive catalyst in improving production and lowering overall unit
operating costs at the Seabee Gold Operation. The Santoy 8 Gold Project achieved commercial production
during the first quarter of 2011. This accomplishment is a major milestone for the Company and represents
a real opportunity for the Seabee Gold Operation to grow its production profile.
Financial Capacity and Highlights
At March 31, 2012, the Company had total Cash and cash equivalents of $8.4 million and short-term
investments of $8.0 million. Working capital at March 31, 2012 was $16.2 million (December 31, 2011 -
$42.4 million). Working capital decreased from December 31, 2011 due to the successful completion of
the Company’s annual winter resupply at the Seabee Gold Operation, where mobile production equipment
and consumable inventory required for the upcoming production year are trucked in to site via a winter ice
road.
For the three months ended March 31, 2012, net cash provided by operating activities was $3.3 million
(March 31, 2012 - $3.8 million). For the quarter ended March 31, 2012, cash flow from operations(1)
before net changes in non-cash operating working capital decreased 28 percent to $2.6 million, or $0.02 per
common share, from $3.6 million, or $0.03 per common share, for the quarter ended March 31, 2011.
Strategically Attractive and Accretive Transactions
Early in the third quarter of 2011, the Company announced that it had approached the Board of Directors of
St. Eugene with a proposal to enter into a letter of intent for a share exchange transaction for 100 percent of
St. Eugene at a significant premium to its trading price. On October 25, 2011, Claude and St. Eugene
jointly announced that they had entered into a definitive agreement pursuant to which Claude would
acquire, by way of a court-approved plan of arrangement, all of the shares of St. Eugene that it did not
already own. The acquisition closed on February 1, 2012 and is the logical consolidation of the Amisk
Gold Project. Claude issued 8.7 million shares as consideration for the purchase of 100 percent of the
shares.
Looking forward, Management remains focused on executing strategically attractive and accretive
transactions that are consistent with the strategic plan and focus of the Company.
Claude Resources Inc.
8. Q1 2012 Management’s Discussion and Analysis
(in thousands of CDN dollars, except as otherwise noted) Page 7
Shareholder Value
Notwithstanding Claude’s share price performance in recent months, Management believes that
shareholder value has been created by: (1) significantly increasing the Company’s resource base; and (2)
taking steps to complete accretive and strategically attractive transactions. Management is confident that
the combination of the Company’s Seabee, Amisk and Madsen properties are a strong production and asset
base in the politically safe jurisdiction of Canada. During 2012 and beyond, the Company will continue to
advance these projects in order to further develop shareholder value.
The Company intends to further build shareholder value by:
• advancing the Company's exploration programs at its Seabee (L62, Santoy Gap, Neptune), Amisk
and Madsen properties;
• investing in capital infrastructure development programs at the Seabee Gold Operation including
an extension of the Seabee Mine shaft, an expansion to the Seabee Central Milling Facility, an
expansion to Camp Facilities and additional production equipment; and
• continuing dewatering and rehabilitation programs at the Company's Madsen Project.
MINING OPERATIONS RESULTS
Seabee Gold Operation
For 2012, forecast gold production at the Seabee Operation is estimated to range between 50,000 and
52,000 ounces of gold. When taking into consideration the Company’s Mill Expansion Project, Shaft
Extension Project and contribution of higher grade ore from the L62 Zone, Management forecasts that
production will be highest in the second and fourth quarters. Unit costs for 2012 are estimated to be similar
to 2011.
Figure 3: Seabee Gold Operation Annual Production and 2012 Forecast Production
Notes:
•
2009 production includes ounces produced and tonnes milled from the Porky Lake bulk sample; and
•
2010 production includes ounces produced and tonnes milled from the Santoy 8 Project prior to it achieving commercial
production.
During the three months ended March 31, 2012, throughput originated from the Seabee Mine and the
Santoy 8 Mine.
Claude Resources Inc.
9. Q1 2012 Management’s Discussion and Analysis
(in thousands of CDN dollars, except as otherwise noted) Page 8
For the three months ended March 31, 2012, Claude milled 66,556 tonnes at a grade of 4.74 grams of gold
per tonne (three months ended March 31, 2011 – 50,501 tonnes at 6.20 grams of gold per tonne).
During the first quarter of 2012, produced ounces were relatively unchanged period over period (March 31,
2012 - 9,574; March 31, 2011 – 9,539 ounces); these results were consistent with Management’s guidance
for the quarter. Mill recoveries were relatively unchanged period over period.
Table 2: Seabee Gold Operation Quarterly Production and Cost Statistics
March 31 March 31
2012 2011
Tonnes Milled 66,556 50,501
Head Grade (grams per tonne) 4.74 6.20
Recovery (%) 94.4% 94.8%
Gold Produced (ounces) 9,574 9,539
Gold Sold (ounces) 9,547 9,461
Production Costs (CDN$ million) $11.8 $8.7
Cash Cost per Ounce (CDN$/oz)(4) $1,236 $924
Cash Cost per Ounce (US$/oz)(4) $1,234 $937
Seabee Mine
During the first quarter of 2012, 7,106 ounces were produced from ore extracted from the Seabee Mine
(March 31, 2011 – 7,448 ounces). This decrease was attributable to a 17 percent decrease in grade partially
offset by increased throughput period over period to the Seabee Gold Operation’s Central Milling Facility.
Table 3: Seabee Mine Production Statistics
March 31 March 31
2012 2011
Tonnes Milled 40,143 35,765
Tonnes per Day 441 397
Head Grade (grams per tonne) 5.81 6.83
Gold Produced (ounces) 7,106 7,448
At the L62 Zone, the series of intercepts with above average true widths and economic gold grades
represent a near term opportunity to improve operating margins at the Seabee Operation. These intercepts
are near existing underground infrastructure and underground development towards the L62 Zone
commenced in October 2011. The Company anticipates incorporating the L62 Zone into Seabee’s
production profile in the second half of 2012.
Santoy 8 Mine
Claude views the Santoy 8 Mine, which achieved commercial production during the first quarter of 2011,
as a key driver in the expansion of the Seabee Gold Operation and in lowering unit operating costs and
increasing production over the life of mine plan.
Feedstock from the Santoy 8 Mine produced 2,468 ounces of gold (March 31, 2011 – 2,091 ounces). This
result was attributable to increased tonnes per day from Santoy 8 partially offset by a decrease in grade
period over period. Santoy 8 tonnes per day were in line with Management’s expectation for the first
quarter.
Claude Resources Inc.
10. Q1 2012 Management’s Discussion and Analysis
(in thousands of CDN dollars, except as otherwise noted) Page 9
Table 4: Santoy 8 Mine Production Statistics
March 31 March 31
2012 2011
Tonnes Milled 26,413 14,736
Tonnes per Day 290 164
Head Grade (grams per tonne) 3.12 4.67
Gold Produced (ounces) 2,468 2,091
During 2012 and beyond, Claude is well positioned to execute on the expansion of its production profile
and lowering unit costs over the next several years by maximizing gold output from the near surface Santoy
8 and Santoy Gap deposits as well as increasing margins at the Seabee Mine via a shaft extension project.
Forecast production from the Santoy 8 Mine is expected to gradually increase to 500 tonnes per day by
2013.
Annual Winter Road
Access to the Seabee Gold Operation is by fixed wing aircraft to an airstrip located on the property.
Equipment and bulky or heavier supplies are trucked to the site via a 60 kilometre annual winter road from
Brabant Lake on Highway 102. The winter road is typically in use from January through March.
Beginning early in the first quarter, preparation of the winter road was completed and over 500 semi-trailer
loads of equipment and supplies were transported to the Seabee Gold Operation over the remainder of the
quarter (2011 winter road – over 400 semi-trailer loads).
Mill Expansion
The Seabee Gold Operation’s Central Milling Facility consists of a three stage crushing circuit, a three
stage grinding circuit, followed by leaching. The Central Milling Facility was recently expanded to a peak
capacity of 1,050 tonnes, with the operation budgeted to sustain approximately 800 tonnes per day on
average under the Seabee Gold Operation’s current Life of Mine Plan. During the first quarter, major
upgrade work on the #1 regrind ball mill was completed and an upgrade to the CIP tanks is targeted for
completion in mid to late second quarter.
Further expansions to the Central Milling Facility are being evaluated to accommodate future sustained
capacity and production increases.
Shaft Extension
During 2011, the Company commenced a shaft extension at the Seabee Mine which will see the shaft
deepened from 600 metres to 980 metres. The shaft extension project was undertaken to provide more
efficient transportation of ore and waste from underground to surface. With higher grade ore at Seabee
Deep and the L62 Zone, it is anticipated that the shaft extension will provide a reduction in unit cash costs.
All of the capital acquisitions relating to the shaft extension (including a new rock breaker, loading pocket,
electrical drive with hoist controls and control centre) have been brought to the Seabee Gold Operation on
the annual winter road for installation after the shaft has been completed.
On the vertical development portion of the extension, the Company has completed mining and timbering
two out of three legs. Approximately 75 percent of the final leg has been completed. Vertical development
is running on schedule and anticipated to be completed during the third quarter.
On the horizontal development, the Company has completed 620L, 720L, 860L 1000L shaft bottom, the
loading pocket access and 50 percent of the rock breaker infrastructure. It is planned that in the next two
months infrastructure for the rock breaker will be complete for third quarter commissioning.
Claude Resources Inc.
11. Q1 2012 Management’s Discussion and Analysis
(in thousands of CDN dollars, except as otherwise noted) Page 10
The next phase of the shaft extension project will be the construction phase which is going to involve the
rock breaker set up, the loading pocket set up, the electrical drives installation, the rope change, the
electrical cable installations and the plug removal.
In order to mitigate against reduced tonnage throughput as a result of the shaft tie-in, the Company is
investigating the possibility of developing remnant stopes within the Seabee Mine at higher levels so that
ore can be trucked to the surface. Also during this time, additional ore will be trucked from the Company’s
Santoy 8 Mine.
Camp Expansion
In order to accommodate the increased workforce at the Seabee Gold Operation, the Company’s Board of
Directors approved an expansion to Seabee’s camp facilities. On site construction of new accommodations
began during the first quarter. Also, additional modular facilities were purchased and transported to the
Seabee Gold Operation over the annual winter road. The installation of the modular facilities was
completed early in the second quarter.
EXPLORATION RESULTS
Claude continued to advance its exploration and development strategy during the first quarter of 2012.
Exploration at the Seabee Gold Operation focused on expanding and delineating the newly discovered L62
and Santoy Gap deposits and drill testing the Neptune target. At the Amisk Gold Project, exploration
drilling continued to expand and confirm the National Instrument 43-101 open-pit resource estimate. At
Madsen, the Company initiated a three-rig, 29,000 metre, surface and underground drill program. The
program is focused on evaluating the 8 Zone Trend, the Austin and McVeigh Tuff and the Main Madsen
Trend below the 4,000 foot level.
All exploration activities were carried out under the direction of Qualified Person, Brian Skanderbeg, P.
Geo., Vice President Exploration.
Seabee Gold Operation
The Seabee Gold Operation includes 14,400 hectares and is comprised of five mineral leases and extensive
surface infrastructure.
Figure 4: Seabee Property regional map showing significant gold deposits and occurrences.
Claude Resources Inc.
12. Q1 2012 Management’s Discussion and Analysis
(in thousands of CDN dollars, except as otherwise noted) Page 11
L62 Zone
The L62 Zone is located approximately 200 metres from existing Seabee Underground infrastructure on
multiple levels. Highlights of recent drilling of the L62 results include:
• 27.06 grams of gold per tonne over 4.83 metres true width (U11-382);
• 12.81 grams of gold per tonne over 6.70 metres true width (U11-649);
• 14.83 grams of gold per tonne over 5.19 metres true width (U11-650);
• 195.06 grams of gold per tonne over 2.29 metres true width (U11-651);
• 22.03 grams of gold per tonne over 4.41 metres true width (U11-661); and
• 24.16 grams of gold per tonne over 5.71 metres true width (U11-663).
Drilling intercepted economic grades and widths approximately 25 metres along strike and 125 metres up-
dip from previous high grade intercepts. The L62 Zone is now interpreted to have an estimated strike length
of up to 85 metres and a dip length of 400 metres. Drilling immediately down plunge encountered sporadic
economic grades, with the geological structure considered open in all directions.
Table 5: Highlights of L62 Discovery
MIDPOINT Au TRUE
HOLE # COORDINATES GRADE g/T WIDTH
NORTH EAST ELEV (uncut) (m)
U11-345 937 1086 -555 6.13 4.8
U11-347 935 1080 -538 4.11 3.3
U11-348 936 1083 -493 4.31 2.5
U11-349 951 1055 -513 8.81 4.9
U11-350 949 1057 -559 5.33 4.8
U11-351 913 1111 -514 0.09 4.6
U11-352 918 1118 -549 0.14 4.8
U11-629 942 1057 -399 39.75 10.0
including 528.10 0.7
U11-630 929 1080 -403 0.34 3.9
U11-631 928 1082 -423 0.46 4.2
U11-632 932 1091 -476 1.78 5.3
U11-642 973.7 1020.2 -326.1 5.59 4.0
U11-649 955.0 1032.2 -356.4 12.81 6.7
U11-650 954.6 1030.8 -330.2 14.83 5.2
U11-651 953.0 1025.7 -306.1 195.06 2.3
including 567.34 0.8
U11-652 940.2 1051.5 -350.6 18.52 3.7
U11-654 939.3 1055.3 -373.1 30.35 2.4
U11-655 947.1 1066.6 -437.2 15.39 2.7
U11-657 946.5 1065.6 -528.9 10.49 5.5
including 108.13 0.5
U11-660 919.7 1109.9 -415.1 4.66 4.5
U11-661 923.3 1109.6 -446.0 22.03 4.4
including 100.40 0.9
U11-663 964.1 1044.1 -446.2 24.16 5.7
including 96.13 0.9
U11-665 959.9 1041.4 -509.1 5.60 1.8
U11-666 972.0 1028.8 -428.3 5.88 4.7
U11-364 941.5 1064.8 -667.2 10.96 1.9
U11-380 953.8 1041.8 -230.0 7.47 1.6
U11-382 938.8 1060.6 -360.3 27.06 4.8
Note: Intervals noted are true width, have been composited across the entire structure
and are uncut. Composites presented herein meet a minimum 10 gram-metre product
Claude Resources Inc.
13. Q1 2012 Management’s Discussion and Analysis
(in thousands of CDN dollars, except as otherwise noted) Page 12
Table 5: Highlights of L62 Discovery
MIDPOINT Au TRUE
HOLE # COORDINATES GRADE g/T WIDTH
NORTH EAST ELEV (uncut) (m)
and 3 g/T gold. Locations referenced are midpoint of the composite.
Since discovery during the second quarter of 2011, the L62 Zone has been the focus of an aggressive
exploration program and has grown rapidly.
Figure 5: Seabee Mine Composite Longitudinal Section (L62 Zone Discovery)
Santoy Region
Gold mineralization at the Santoy Region is hosted in siliceous, shear structures with sulfide-chlorite-quartz
veins and in silicified granitoid sills. The mineralized lenses dip moderately to steeply eastward and are
interpreted to be amenable to bulk mining techniques. Gold mineralization of the Santoy 8 ore lens occurs
over a strike length of 600 metres, a depth of 600 metres and remains open along strike and down plunge to
the north. The Santoy 8E ore lens has been intercepted over a strike length of 200 metres, depth of 250
metres and remains open along strike and down plunge to the north. The true thickness of the Santoy 8
deposits varies from 1.5 metres to 15 metres. Underground infill and exploration drilling continues to
confirm and expand the Santoy 8 system.
The Santoy Gap target is located 300 to 900 metres north of underground infrastructure, immediately on
strike and adjacent to the Santoy 8 Mine. During 2011, 33,000 metres of drilling was completed in 82
holes. Drilling intercepted multiple high-grade intervals, significantly expanding the strike length and width
of the mineralized system and has expanded the Santoy Gap and Santoy 8 system to in excess of 1.8
kilometres long. Significant assays from the 2011 program are highlighted below in Table 6.
Claude Resources Inc.
14. Q1 2012 Management’s Discussion and Analysis
(in thousands of CDN dollars, except as otherwise noted) Page 13
Table 6: Highlights from 2011 Santoy Gap Drilling
Au Grade Width
Hole ID Easting Northing From (m) To (m)
(g/t) (m)
JOY-11-565* 599043 6170888 396.22 397.68 27.65 1.46
JOY-11-588 599021 6170706 222.16 231.94 35.00 9.78
Incl 231.44 231.94 533.00 0.50
JOY-11-589 599237 6170826 468.66 470.63 46.44 1.97
JOY-11-594 598995 6170771 289.42 291.70 14.75 2.28
And 301.17 305.21 16.14 4.04
JOY-11-600 598968 6170808 290.36 291.77 56.23 1.41
JOY-11-606 599247 6170665 395.33 403.13 12.95 7.80
Incl 397.08 400.14 23.44 3.06
JOY-11-611 599292 6170777 455.13 458.95 9.74 3.82
Incl 456.67 457.81 23.24 1.14
JOY-11-535 599349 6170487 310.57 316.00 10.30 5.43
JOY-11-549 599178 6170745 330.38 336.62 6.73 6.24
JOY-11-551 599205 6170769 405.77 408.59 22.06 2.82
JOY-11-554 599146 6170803 413.20 415.44 41.94 2.24
JOY-11-555 599146 6170803 377.40 397.65 12.79 20.25
Incl 377.40 378.40 144.00 1.00
JOY-11-556 599146 6170803 323.00 343.48 19.10 20.48
Incl 331.00 331.59 524.00 0.59
JOY-11-580 599097 6170891 364.06 365.78 36.51 1.72
Note: * Partial result, certain assays within zone are pending. Composites calculated at 3.0 g/t cut-off and may include internal
dilution. True width is interpreted to range from 70 to 95 percent drilled width..
The Santoy Gap drill program has expanded the gold-bearing structure to a strike length of over 600
metres, to depths in excess of 600 metres and has expanded the Company's National Instrument 43-101
resource base at the Seabee Project.
Based on the encouraging results from Santoy Gap, the Company has approved the 2012 Seabee
exploration program to include 70,000 metres from surface, focusing largely on the Santoy Gap. The three
to four rig program will focus on aggressively exploring the Santoy Gap target and its relationship to the
Santoy 8 ore body to depths in excess of 750 metres.
Figure 6: Santoy Region Composite Longitudinal Section.
Claude Resources Inc.
15. Q1 2012 Management’s Discussion and Analysis
(in thousands of CDN dollars, except as otherwise noted) Page 14
Neptune
The Neptune target is approximately six kilometres north of the Seabee Minesite. Exploration in this area
is focused on the Pigeon Lake region utilizing geological, geochemical and geophysical surveys and
historical drill data. The gold-in-soil anomaly exists along three sub-parallel trends spanning a width of at
least 200 metres. Peak soil values of 111 parts per billion were obtained from minus 80 mesh soil samples
obtained over and adjacent to outcropping mineralization. Prospector channel and grab samples from
outcropping quartz vein-hosted mineralization returned values of up to 18.23 grams per tonne (please see
Claude news release “Claude Resources Inc. Drills 13.6 Grams of Gold per Tonne Over 3.0 Metres at
Neptune Target” dated March 23, 2011).
Figure 7: Neptune target showing significant gold intercepts and soil anomaly.
Initial drilling revealed high gold grades associated with sheeted quartz veins within several prospective
zones of alteration and veining hosted within both arenite and basalt-derived, biotite-chlorite schist. The
2011 drill program confirmed the gold-bearing structure over a strike length of 1,200 metres to depths in
excess of 250 metres and intersected high-grade gold within multiple structures with assay results of up to
84.66 grams of gold per tonne across 3.20 metres. Results from the 2011 winter drill program are presented
in Table 7 below.
Table 7: Neptune Target Drill Results from 2011 Winter Drill Program
From Grade Width Visible
Hole ID Easting Northing Az/dip
(m) (g/t) (m) Gold
NEP-11-003 587984 6177748 130/-45 60.00 3.78 1.00 YES
And 112.00 Anomalous 2.90 YES
And 124.00 Anomalous 1.00 YES
NEP-11-004 587950 6177671 130/-45 108.81 4.37 0.81
Claude Resources Inc.
16. Q1 2012 Management’s Discussion and Analysis
(in thousands of CDN dollars, except as otherwise noted) Page 15
Table 7: Neptune Target Drill Results from 2011 Winter Drill Program
From Grade Width Visible
Hole ID Easting Northing Az/dip
(m) (g/t) (m) Gold
NEP-11-005 587938 6177652 130/-45 114.00 Anomalous 4.00
NEP-11-006 587865 6177584 130/-45 90.39 Anomalous 0.61 YES
NEP-11-007 587963 6177692 130/-45 4.05 Anomalous 2.95 YES
And 48.30 10.65 0.50 YES
And 84.80 84.66 3.20 YES
Incl. 84.80 218.00 1.20 YES
And 111.11 24.70 0.82 YES
NEP-11-008 588016 6177912 130/-45 159.00 8.38 1.00 YES
NEP-11-009 588113 6178080 130/-45 290.65 Anomalous 2.35
NEP-11-010 587933 6177839 130/-45 181.00 3.01 0.89 YES
NEP-11-011 587812 6177841 130/-58 308.82 Anomalous 2.00 YES
NEP-11-012 588067 6177801 130/-45 39.94 5.82 3.06 YES
NEP-11-013 588131 6177878 130/-45 NSI
NEP-11-014 587374 6177159 130/-45 419.91 Anomalous 1.00 YES
NEP-11-015 587722 6177373 130/-45 NSI
Note: Intercepts calculated using a 3 g/t Au cut-off, Anomalous (0.1-3 g/t Au), No Significant Intercepts
(“NSI”)
To date, the Neptune target has only been tested on widely spaced centres, the limits of which are yet to be
determined. These results demonstrate the potential for significant new discoveries and resource definition
at the Seabee Operation. At Neptune, exploration efforts in 2011 included the completion of a 28 hole,
9,550 metre drill program designed to test the 1.8 kilometre strike length of the soil anomaly to vertical
depths of up to 250 metres. Based on these encouraging results from Neptune, Claude completed further
drilling in the first quarter of 2012.
Amisk Gold Project
The 24,350 hectare Amisk Gold Project (Figure 8) is located in the Flin Flon-Snow Lake Greenstone Belt.
The project is host to the Amisk Gold Deposit, the past-producing Monarch Mine as well as a large number
of gold occurrences and prospects. Extensive historic exploration from 1983 through 1998, including
significant surface and underground drilling and bulk sampling, was completed by Saskatchewan Mining
Development Corporation, Hudson Bay Mining and Smelting, Husky Oil and Claude. The property
remained largely dormant from 1998 through 2009.
Claude Resources Inc.
17. Q1 2012 Management’s Discussion and Analysis
(in thousands of CDN dollars, except as otherwise noted) Page 16
Figure 8: Amisk Gold Project
Results from a summer historic core sampling program and 2011 drilling expanded the mineralized system
and confirmed grade continuity of the resource model. Gold and silver mineralization is associated with a
sequence of quartz porphyritic, rhyolitic lapilli tuffs and flows hosting disseminations and stringers of
pyrite, sphalerite, galena, tetrahedrite and chalcopyrite. Drilling has intercepted the mineralized system
over a strike length of 1,200 metres, width of 400 metres and depths of in excess of 600 metres. The
system remains open to the southwest, southeast, northwest and at depth.
Figure 9: Cross Section A-A’ of the Amisk Gold Property
Claude Resources Inc.
18. Q1 2012 Management’s Discussion and Analysis
(in thousands of CDN dollars, except as otherwise noted) Page 17
During the third quarter of 2011, the Company reported positive metallurgical testwork results at the Amisk
Gold Project. Initial metallurgical testing indicates that gold and silver mineralization is amenable to
conventional cyanide leaching. Results from testing on three composite samples from the Amisk Gold
Deposit have returned an average of 89.4 percent recovery for gold, ranging from 85.2 percent to 91.7
percent and an average of 80.8 percent recovery for silver, ranging from 66.4 percent to 92.8 percent.
Detailed results are presented in the table below.
Table 8: Metallurgical Testwork Results, Amisk Gold Project
Recovery Size
Grade
(Cyanidation) Fraction
Au Ag
Au (%) Ag (%) P 80 (um)*
Composite ID (g/T) (g/T)
Low Grade 0.50 7.4 89.8 70.9 72
Medium Grade 0.85 9.2 85.2 88.9 146
Medium Grade 0.85 9.2 89.1 84.8 117
Medium Grade 0.85 9.2 91.0 92.8 72
High Grade 1.68 8.4 91.7 66.4 92
* Denotes size fraction of grind that 80 percent of material passed.
Based on the Metallurgical testwork work completed thus far, it is recommended that Amisk ore should be
treated by conventional SAG and ball mill grinding to achieve a final grind not finer than 80 percent
passing 75 microns. Further economic studies and tests need to be done to optimize the grind required. It is
suggested that this optimized grind will lie between 72 and 117 microns. The correct process to recover
gold and silver is direct whole ore cyanidation with carbon-in-pulp technology used to recover the leached
gold and silver values. Reagent consumption in cyanidation was reasonable. Approximately 1 kilogram per
tonne of NaCN (sodium cyanide) and 0.5 kilogram per tonne of lime will be required. Further cyanidation
test work was recommended to identify optimum operating conditions.
The initial metallurgical and grinding mill engineering tests were conducted on 215 kg collected from half
split core. Representative core intervals from eight drill holes were combined to create low, medium and
high grade composites that assayed 0.50, 0.85 and 1.68 grams of gold per tonne and 7.4, 9.2 and 8.4 grams
of silver per tonne. This mineralization is representative of the Amisk Gold Deposit and consists of trace to
10 percent disseminated pyrite and stringers with minor sphalerite, chalcopyrite, galena and tetrahedrite
hosted in a sericitized quartz porphyry.
During 2011, a 20 hole, 6,480 metre drill program was completed on the Amisk Gold Project. This program
focused specifically on testing the limits of the mineralized footprint north of the current pit outline,
targeting depth extension below the pit bottom and infill drilling to evaluate potential upgrade of categories
in the resource estimate completed by SRK. Twenty drill holes successfully confirmed continuity of gold
mineralization within the northern and eastern portion of the deposit as well as demonstrated the potential
for expansion to the east and southeast.
Table 9: 2011 summer and fall drill results from the Amisk Gold Project.
From Length Au Ag
Hole Easting Northing Az/Dip To (m)
(m) (m) (g/t) (g/t)
AL-11-300 676827 6066224 80/-45 50.00 59.00 9.00 1.50 9.2
and 188.00 244.50 56.50 0.58 3.5
AL-11-301 676875 6066233 80/-45 150.00 171.00 21.00 1.15 6.7
and 205.00 229.61 24.61 1.88 12.4
AL-11-302 676910 6066380 80/-45 96.00 104.51 8.51 1.14 4.5
AL-11-303 676910 6066380 283/-45 18.00 44.00 26.00 1.02 4.3
AL-11-304 676910 6066380 0/-90 93.41 131.00 37.59 0.55 2.8
AL-11-305 676900 6066330 80/-45 175.47 183.50 8.03 1.16 6.2
AL-11-306 676885 6066283 80/-45 40.25 130.00 89.75 0.51 2.5
Claude Resources Inc.
19. Q1 2012 Management’s Discussion and Analysis
(in thousands of CDN dollars, except as otherwise noted) Page 18
Table 9: 2011 summer and fall drill results from the Amisk Gold Project.
From Length Au Ag
Hole Easting Northing Az/Dip To (m)
(m) (m) (g/t) (g/t)
AL-11-307 676921 6066430 80/-45 NSI
AL-11-308 676921 6066430 285/-45 NSI
AL-11-309 676900 6066480 283/-45 18.92 19.92 1.00 5.31 13.1
AL-11-310 676900 6066480 0/-90 NSI
AL-11-311 676900 6066480 283/-60 NSI
AL-11-312 676877 6066141 70/-45 69.50 96.00 26.50 0.44 1.5
and 108.00 132.00 24.00 0.51 0.9
and 191.15 220.00 28.85 0.67 2.8
AL-11-313 676838 6066035 105/-45 37.85 54.00 16.15 1.02 7.4
and 125.00 147.00 22.00 0.54 7.6
and 185.00 204.50 19.50 0.65 2.3
and 239.47 276.00 36.53 0.61 2.9
AL-11-314 676835 6066052 90/-45 141.00 164.00 23.00 0.76 2.8
Note: Intervals noted are intercepted width not true width, have been calculated using a 0.3 g/tonne cut-off and are uncut. True
width is variable between 80 and 100 percent of drilled width. They may include internal dilution intervals of up to 6 metres. No
significant Intercepts (“NSI”).
Mineralization intercepted in the drilling is consistent with the current resource model and is associated
with a sequence of quartz porphyritic, rhyolitic lapilli tuffs and basaltic tuffs hosting disseminations and
stringers of pyrite, sphalerite, galena, tetrahedrite and chalcopyrite. The remaining holes are presented in
Table 10 below. The program tested from surface to in excess of 700 metres depth and was designed to
expand the limits of the Amisk Gold deposit as well as infill within the northern and eastern portion of the
deposit.
Highlights of the drilling include: 6.24 grams of gold per tonne and 23.5 grams of silver per tonne over
12.00 metres and 3.39 percent zinc and 0.91 percent lead over 1.81 metres in hole AL-11-318, and 1.95
grams of gold per tonne and 14.9 grams of silver per tonne over 18.95 metres in AL-11-319. Mineralization
intercepted in the drilling is consistent with the current resource model and is associated with a sequence of
quartz porphyritic, rhyolitic lapilli tuffs and basaltic tuffs and argillite hosting disseminations, stringers and
semi-massive intervals of pyrite, sphalerite, galena, tetrahedrite, pyrrhotite and chalcopyrite.
Drill hole AL-11-319 confirmed continuity of gold mineralization within the southeastern portion of the
deposit as well as demonstrated the potential for expansion to the east and southeast. Four holes were
completed evaluating the continuity of the system to depths in excess of 700 metres.
Table 10: 2011 Amisk Gold Project Fall Drill Results
From Length
Hole Easting Northing Az/Dip Au (g/t) Ag (g/t) Zn (%) Pb (%)
(m) (m)
AL-11-315 676999 6066416 184/-62 87.94 12.22 1.32 6.7 - -
Incl 95.08 1.92 5.42 30.8 - -
AL-11-316 676868 6066443 177/-58 92.00 37.00 0.49 2.2 - -
AL-11-317 676769 6066515 178/-58 256.00 16.50 1.37 5.7 - -
Incl 257.00 3.00 5.28 22.4 - -
AL-11-318 676444 6066436 166/-66 69.00 1.81 0.17 11.5 3.39 0.91
And 311.00 12.00 6.24 23.5 - -
Incl 313.85 1.15 62.00 224 - -
And 643.5 71.74 0.6 4.0 - -
Incl 699.5 14.00 1.64 11.8 - -
And 728.00 37.00 0.61 2.2 - -
Claude Resources Inc.
20. Q1 2012 Management’s Discussion and Analysis
(in thousands of CDN dollars, except as otherwise noted) Page 19
Table 10: 2011 Amisk Gold Project Fall Drill Results
From Length
Hole Easting Northing Az/Dip Au (g/t) Ag (g/t) Zn (%) Pb (%)
(m) (m)
Incl 763.00 2.00 5.71 22.0 - -
And 809.39 10.61 1.65 2.6 - -
Incl 809.39 2.21 6.06 8.5 - -
AL-11-319 676744 6065948 97/-47 53.00 32.00 0.98 7.1 - -
Incl 68.00 1.00 8.95 39.7 - -
And 159.5 29.00 0.59 5.6 - -
And 206.5 21.00 1.28 8.5 - -
Incl 223.00 1.50 11.3 45.3 - -
And 339.00 18.95 1.95 14.9 - -
Incl 348.00 3.01 7.38 57.7 - -
AL-11-320 676709 6065787 105/-47 NSI - -
Note: Intervals noted are intercepted width not true width, have been calculated using a 0.3 g/tonne cut-off and are uncut. True width
is variable between 60 and 100 percent of drilled width. They may include internal dilution intervals of up to 10 metres. No Significant
Intercepts (“NSI”).
The 2011 Amisk drill program confirmed mineralization within the current resource model and to depths of
700 metres. In addition to focusing on growth of the gold and silver resource base, the presence of
significant grades of zinc and lead in the hangingwall will be evaluated during 2012.
Looking forward at Amisk, exploration will focus on expansion of the open pit resource, completion of
preliminary economic studies and further evaluation of the underground potential.
Madsen Project
The Madsen Project comprises over 10,000 acres (4,000 hectares) and, having produced in excess of 2.4
million ounces, is the third largest gold producer in the Red Lake camp in Ontario, Canada. Infrastructure
includes a fully functional 500 ton per day mill, a 4,125 foot deep shaft and permitted tailings facility.
Initiated from the 10th level in December of 2008, the Phase I underground program included testing of the
plunge extension of the 8 Zone as well as conceptual targets along the 8 Zone shear system. Results from
Phase I deep drilling of the 8 Zone Trend demonstrated down plunge continuity to 450 feet below the 27th
level with multiple holes returning strong visible gold associated with intensely silicified, biotite-altered
basalt. See Table 11 for highlights of Phase I of the 8 Zone drill program. Step-out drilling to the east and
west confirmed the development of favorable 8 Zone structure and stratigraphy. The system remains open
down plunge and along strike to the east and west.
Table 11: Highlights from Phase I of the 8 Zone drill program at the Madsen Mine, Ontario.
Hole ID From To Au Length Au Length Visible
(m) (m) (g/t) (m) (oz/ton) (ft) Gold
Noted
MUG-08-01 883.00 883.75 127.12 0.75 3.71 2.46
MUG-09-02b 891.25 891.70 21.52 0.45 0.63 1.48
MUG-09-03 915.40 917.89 33.39 2.49 0.97 8.17
(incl) 58.18 1.25 1.70 4.10
MUG-09-04 909.55 917.45 25.77 7.90 0.75 25.92
(incl) 141.80 0.95 4.14 3.12
MUG-09-05 943.51 946.90 24.30 3.39 0.71 11.45
(incl) 62.09 1.22 1.81 4.00
Claude Resources Inc.
21. Q1 2012 Management’s Discussion and Analysis
(in thousands of CDN dollars, except as otherwise noted) Page 20
Figure 10: Madsen Mine Cross Section
Figure 11: Madsen Property Overview
Claude Resources Inc.
22. Q1 2012 Management’s Discussion and Analysis
(in thousands of CDN dollars, except as otherwise noted) Page 21
In the second quarter of 2011, rehabilitation of the 16th level was completed and the second drill chamber to
support Phase II drilling was completed. The 8 Zone Trend hosts the past-producing 8 Zone and is highly
prospective for future high grade discoveries. The 16th level provides the ideal drill platform to explore both
at depth as well as the strike potential of this 8 Zone Trend.
During 2011, Phase II underground drilling completed 14,800 metres and 9 holes, targeting the 8 zone
plunge and strike continuity as well as sub-parallel footwall structures. Drill holes targeting the plunge
continuity of the 8 Zone include MUG-11-12, 14 (14b) and 16. Drill hole 14b and drill hole 16, the deepest
hole ever completed on the Madsen property, intercepted silicified and visible gold-bearing, basalt and
returned 8.06 grams of gold per tonne over 2.02 metres and 5.69 grams of gold per tonne over 2.14 metres,
respectively. These intercepts extend the 8 Zone system 250 metres down plunge from previous drilling to
approximately 1,600 metres below surface. The system continues to remain open down plunge and will be
the target of future drilling.
Drill holes targeting the strike continuity of the 8 Zone include MUG-11-10, 11, 13, 15, 17 and 19. Drill
hole 13 and drill hole 17 intercepted silicified, biotite-altered basalt and returned 15.70 grams of gold per
tonne over 2.00 metres and 53.70 grams of gold per tonne over 0.70 metres, approximately 950 metres
below surface. These intercepts are in the hanging-wall of the 8 Zone system and interpreted to correlate
with and be an extension of the McVeigh Tuff, located approximately 650 metres up-dip. The McVeigh
Tuff hosts a current Indicated Resource of 115,000 ounces at 9.59 grams of gold per tonne and has seen
very limited drill testing below 350 metres. In addition to the McVeigh mineralization, the 8 Zone
structure is developed in all holes completed along strike and is characterized by anomalous gold associated
with biotite-altered, variably silicified basaltic and ultramafic lithologies.
Table 12: Highlights from Phase II of the Madsen Underground 8 Zone
Drill Program
Hole ID Width (m) Au (g/t) Elevation * Zone
MUG-11-13 2.00 15.70 927 McVeigh
MUG-11-14 2.00 6.27 1,051 McVeigh
MUG-11-14b 2.02 8.06 1,543 8 Zone
MUG-11-16 2.14 5.69 1,595 8 Zone FW
MUG-11-17 0.70 53.70 927 McVeigh
and 2.00 5.64 1,079 McVeigh
∗ Elevation presented as metres below surface. Composites calculated using a 3 grams per tonne Au cut-off grade. Reported
width is drilled length and interpreted to represent 75 - 85 percent of true width. Note, hole MUG-11-14 was lost with hole
MUG-11-14b wedged off and completed.
Figure 12: Madsen Longitudinal Section
Claude Resources Inc.
23. Q1 2012 Management’s Discussion and Analysis
(in thousands of CDN dollars, except as otherwise noted) Page 22
These latest results provide encouragement for the Company’s 2012 program and continue to demonstrate
that the 8 Zone is a high grade gold system that has strong vertical continuity and remains open at depth
and along strike to the northeast. Furthermore, the discovery of economic grades and widths hosted within
the depth continuity of the McVeigh Tuff opens up significant exploration potential.
Quality Assurance and Quality Control Procedures
Rigorous quality assurance and quality control procedures have been implemented including the use of
blanks, standards and duplicates. Geochemical analyses were submitted to ALS Chemex in Vancouver,
British Columbia and or the Seabee minesite lab. The former laboratory is ISO approved. Core samples
were analyzed by a 30 gram gold fire assay with an atomic absorption and gravimetric and or screen fire
finish.
MINERAL RESERVES AND MINERAL RESOURCES
The Mineral Reserves and Mineral Resources estimates are conducted under the direction of Qualified
Persons Brian Skanderbeg, P.Geo., Vice President Exploration and Peter Longo, P.Eng., Vice President
Operations.
Since 2008, the Company’s NI 43-101 Resource Base has increased over 400 percent. The increase noted
is attributable to the discovery and delineation of the L62 and Santoy Gap deposits in 2011, which
increased Mineral Reserves and Mineral Resources at the Seabee Gold Operation from 662,000 ounces to
1,300,000 ounces. Results from exploration at the Company’s Amisk (1,566,000 gold equivalent ounces)
and Madsen (1,255,000 ounces) projects have also contributed to this increase.
Seabee Gold Operation
During 2011, Claude completed over 60,000 metres of underground drilling to sustain Mineral Reserves at
the Seabee Gold Mine.
Claude Resources Inc.
24. Q1 2012 Management’s Discussion and Analysis
(in thousands of CDN dollars, except as otherwise noted) Page 23
Since discovery during the second quarter of 2011, the L62 Zone has been the focus of an aggressive
exploration program and has grown rapidly. The L62’s high grade results obtained from drilling completed
between September and December 2011 were incorporated into and had a material impact on the Seabee
Mine’s updated National Instrument 43-101 resource calculation as at December 31, 2011 (Please see
Claude news release “Claude Resources Inc. Increases Inferred Resource Base 236 Percent at Seabee Gold
Operation” dated March 14, 2012).
At December 31, 2011, proven and probable reserves in the Seabee Gold Operation were 2,059,000 tonnes,
grading 5.37 grams per tonne or 355,600 ounces of gold. Compared to December 31, 2010, this represents
a five percent increase in reserve tonnage and one percent increase in reserve ounces. This modest increase
is attributable to L62 resource growth into the probable reserve classification offset by production
activities.
The Company’s mineral resources at its Seabee Gold Operation included Measured and Indicated Mineral
Resources of 70,700 ounces and Inferred Mineral Resources totalling 873,400 ounces. Compared to
December 31, 2010, this represents a 206 percent increase in contained gold within the Company’s mineral
resources which is mainly attributable to inferred growth relating to further drilling and discovery at
Seabee, Santoy Gap and Santoy 8.
Table 13: Seabee Gold Operation Mineral Reserves and Mineral Resources
Proven and Probable Reserves
December 31, 2011 December 31, 2010
Projects Tonnes Grade (g/t) Ozs Tonnes Grade (g/t) Ozs
Seabee 1,062,900 6.58 224,900 887,100 6.69 190,800
Santoy 8 997,100 4.08 130,600 1,079,900 4.66 161,900
Totals 2,059,900 5.37 355,600 1,967,100 5.58 352,600
Measured and Indicated Mineral Resources
Projects Tonnes Grade (g/t) Ozs Tonnes Grade (g/t) Ozs
Seabee 127,400 4.65 19,000 - - -
Santoy 8 12,600 5.04 2,000 - - -
Porky Main 160,000 7.50 38,600 160,000 7.50 38,600
Porky West 111,000 3.10 11,000 111,000 3.10 11,000
Totals 410,900 5.35 70,700 271,000 5.70 49,600
Inferred Mineral Resources
Projects Tonnes Grade (g/t) Ozs Tonnes Grade (g/t) Ozs
Santoy Gap 2,321,000 6.63 495,000 - - -
Seabee 813,900 6.83 178,800 705,500 6.33 143,600
Santoy 8 850,000 5.46 149,300 384,800 5.35 66,200
Porky Main 70,000 10.43 23,500 70,000 10.43 23,500
Porky West 138,300 6.03 26,800 138,300 6.03 26,800
Totals 4,193,200 6.48 873,400 1,298,600 6.23 260,100
For the above table of reserves, the following mining and economic factors have been applied:
•
Mineral reserves and mineral resources were estimated by Claude personnel and audited by SRK in 2011.
•
Mineral reserves and mineral resources estimates have been completed in accordance with CIM Standards and are reported
in accordance with Canadian Securities Administrators’ National Instrument 43-101. Mineral resources are exclusive of
mineral reserves.
•
Seabee reserves and resources are estimated at a cut-off grade of 4.57 grams of gold per tonne and Santoy 8 and Santoy
Gap reserves and resources are estimated at a cut-off grade of 3.0 grams of gold per tonne.
•
Cut-off grades were calculated using a two year trailing price of Can. $1,400 per ounce of gold, a U.S./CDN$ exchange
rate of 1:1 and overall ore mining and processing costs based on actual historical operating costs.
•
All figures are rounded to reflect the relative accuracy of the estimates. Totals may not represent the sum of the parts due to
rounding.
•
Mineral resources are not mineral reserves and do not have demonstrated economic viability.
•
L62 mineral reserves and mineral resources are included in the Seabee totals.
Claude Resources Inc.
25. Q1 2012 Management’s Discussion and Analysis
(in thousands of CDN dollars, except as otherwise noted) Page 24
Claude is planning approximately 60,000 metres of underground drilling to replace 2012 production and to
replace Mineral Reserves and Mineral Resources at the Seabee Gold Mine.
Amisk Gold Project
On February 17, 2011, Claude completed a National Instrument 43-101 compliant resource calculation
which included results of all drilling to date, inclusive of historic core. The independent mineral resource
statement was released in the first quarter of 2011 and outlined an Indicated Resource of 921,000 ounces of
0.95 grams of Au Eq per tonne and an Inferred Resource of 645,000 ounces at 0.70 grams of Au Eq per
tonne.
Table 14: Amisk Gold Project Consolidated Mineral Resource Statement*
Quantity Grade (g/tonne) Contained Ounces (000’s)
Resource Class
(000’s tonnes) Au Ag Au Eq Au Ag Au Eq
Indicated 30,150 0.85 6.17 0.95 827 5,978 921
Inferred 28,653 0.64 4.01 0.70 589 3,692 645
* Reported at a cut-off of 0.40 grams of gold equivalent (Au Eq) per tonne using a price of U.S. $1,100 per ounce of gold and U.S. $16
per ounce of silver inside a conceptual pit shell optimized using metallurgical and process recovery of 87 percent, overall ore mining
and processing costs of U.S. $15 per tonne and overall pit slope of 50 degrees. All figures are rounded to reflect the relative accuracy
of the estimates. Mineral resources are not mineral reserves and do not have demonstrated economic viability.
An updated NI 43-101 resource statement, inclusive of all drilling completed to the end of 2011, is
anticipated to be completed during the second quarter. This resource model will serve as the basis for the
Preliminary Economic Assessment at the Amisk Gold Project.
Madsen Exploration Project
During 2010, SRK finalized an independent National Instrument 43-101 mineral resource evaluation for
the Madsen Mine. This mineral resource evaluation was based on historical exploration and mining data,
Phase I underground drilling results up to September 27, 2009 and geological and resource modeling. The
resource evaluation was undertaken on the four separate zones, Austin, South Austin, McVeigh and 8 Zone
that comprise the Madsen Gold Mine. The National Instrument 43-101 Technical Report was filed on
January 20, 2010.
Table 15: Consolidated Mineral Resource Statement (1) for the Madsen Mine, Ontario
Resource Grade Grade Contained
Zone Tonnes
Class (g/tonne) (oz/ton) Gold (oz)
Indicated Austin 1,677,000 7.92 0.23 427,000
South Austin 850,000 9.32 0.27 254,000
McVeigh 374,000 9.59 0.28 115,000
8 Zone 335,000 12.21 0.36 132,000
Total 3,236,000 8.93 0.26 928,000
Inferred Austin 108,000 6.30 0.18 22,000
South Austin 259,000 8.45 0.25 70,000
McVeigh 104,000 6.11 0.18 20,000
8 Zone 317,000 18.14 0.53 185,000
Total 788,000 11.74 0.34 297,000
Note: mineral resources are not mineral reserves and do not have demonstrated economic viability. All figures have been rounded to
reflect the relative accuracy of the estimates. Reported at a cut-off grade of 5.0 g/t gold based on U.S. $1,000 per troy ounce of gold
and gold metallurgical recoveries of 94 percent.
Claude Resources Inc.
26. Q1 2012 Management’s Discussion and Analysis
(in thousands of CDN dollars, except as otherwise noted) Page 25
FINANCIAL RESULTS OF OPERATIONS
Highlights
Thousands of CDN$ March 31 March 31 Percent
(except per share amounts) 2012 2011 Change
Revenue $16,052 $13,322 20
Profit from mining operations 996 2,665 (63)
Net profit (loss) (491) 1,829 (127)
Earnings (loss) per share (0.00) 0.01 -
(basic and diluted)
Revenue
Gold revenue from the Company’s Seabee Gold Operation for the three months ended March 31, 2012
increased 21 percent to $16.1 million from $13.3 million reported for the three months ended March 31,
2011. The increase in gold revenue period over period was attributable to a 19 percent improvement in
Canadian dollar gold prices realized (Q1 2012 - $1,681 (U.S. $1,679); Q1 2011 - $1,408 (U.S. $1,428)) and
slightly higher gold sales volume (Q1 2012 – 9,547 ounces; Q1 2011 – 9,461 ounces).
Figure 13: Average Gold Price (London PM Fix – US$)
Net Profit (loss)
For the three months ended March 31, 2012, the Company recorded a net loss of $0.5 million, or $0.00 per
share. This compares to a net profit of $1.8 million, or $0.01 per share, for the three months ended March
31, 2011.
Production Costs
For the three months ended March 31, 2012, mine production costs of $11.8 million (three months ended
March 31, 2011 - $8.7 million) were 36 percent higher period over period. This increase was attributable to
increased spending on consumable supplies and labour.
Total Canadian dollar cash cost per ounce of gold(4) for the first quarter of 2012 increased 34 percent to
CDN $1,236 (U.S. $1,234) per ounce from CDN $924 (U.S. $937) during the first quarter of 2011,
principally as a result of higher operating costs due to increased tonnes processed.
Claude Resources Inc.
27. Q1 2012 Management’s Discussion and Analysis
(in thousands of CDN dollars, except as otherwise noted) Page 26
Depreciation and Depletion
For the three months ended March 31, 2012, depreciation and depletion was $3.3 million (March 31, 2011 -
$1.9 million), up 74 percent period over period. This result is attributable to a 32 percent increase in tonnes
throughput and an increase in property plant and equipment period over period.
General and Administrative Expense
General and administrative expense in the first three months of 2012 increased to $2.7 million, up 93
percent from the $1.4 million reported for the first three months of 2011. This variance primarily relates to
increased stock compensation expense resulting from a greater number of options granted period over
period and the granting of deferred share units to Directors of the Company.
Finance Expense
Finance expense includes interest, accretion expense and derivative gains or losses (if any). For the three
months ended March 31, 2012, Finance expense of $0.3 million was relatively unchanged period over
period
Finance and Other Income
Finance and other income consists of interest income, production royalties pursuant to the Red Mile
transactions and other income. For the three months ended March 31, 2012, finance and other income of
$0.7 million was relatively unchanged period over period.
Deferred Income Tax Expense
Deferred income tax expense was relatively unchanged period over period.
Liquidity and Financial Resources
The Company monitors its spending plans, repayment obligations and cash resources on a continuous basis
with the objective of ensuring that there is sufficient capital within the Company to meet business
requirements, after taking into account cash flows from operations and the Company’s holdings of cash and
cash equivalents and short-term investments. The Company’s typical cash requirement over the first and
second quarters of each year is significant because of the Seabee Gold Operation’s winter ice road
resupply, which includes restocking diesel, propane and other large consumables as well as the continued
upgrading of the mining fleet and mine infrastructure.
The Company had cash and cash equivalents of $8.4 million and short-term investments of $8.0 million at
March 31, 2012 (December 31, 2011 - $2.5 million of cash and cash equivalents and short-term
investments of $33.2 million). The Company monitors its positions with, and the credit quality of, the
financial institutions and government instruments in which it invests its excess cash and cash equivalents.
Other than balances maintained in various bank operating accounts, the Company’s investment policy
limits investments to government-backed financial instruments, bank certificates of deposit and bankers
acceptances.
At March 31, 2012, the Company had working capital of $16.2 million (December 31, 2011 - $42.4
million). Included in the working capital calculation at March 31, 2012 are demand loans of $7.3 million;
these loans have been classified as current liabilities due to their demand feature.
Claude Resources Inc.
28. Q1 2012 Management’s Discussion and Analysis
(in thousands of CDN dollars, except as otherwise noted) Page 27
March 31 December 31 Percent
2012 2011 Change
Current assets $ 52,244 $ 52,004 -
Current liabilities $ 36,012 $ 9,606 275
Working capital $ 16,232 $ 42,398 (62)
Current ratio 1.5 5.4 (72)
Investing
Mineral property expenditures during the three months ended March 31, 2012 were $28.3 million, an $11.3
million increase from the comparable period in 2011. Expenditures during 2012 were comprised of Seabee
Mine and Shaft development of $6.5 million, exploration costs (focusing on the Santoy Gap, Seabee North,
Amisk and Madsen exploration projects) of $7.6 million and property, plant and equipment additions of
$14.2 million. Property, plant and equipment additions include mining equipment, camp infrastructure and
tailings management facility expansion. The Company utilized its cash on hand and short-term investments
to fund these additions.
Financing
Financing activities during the first quarter of 2012 included the issuance of 338,676 common shares (Q1
2011 – 235,614) and 40,000 common shares (Q1 2011 – 156,667) pursuant to the Company’s Employee
Share Purchase Plan and the Company’s Stock Option Plan, respectively.
During the first quarter of 2012, the Company repaid $1.1 million of its demand loans and capital leases
outstanding. The proceeds and repayments of demand loans relate to production equipment at the Seabee
Gold Operation.
Capital Structure
The Company’s objective when managing capital is to safeguard its ability to continue as a going concern so that
it can continue to provide adequate returns to shareholders and benefits to other stakeholders. The Company
manages the capital structure and makes adjustments to it in light of changes in economic conditions and the risk
characteristics of the underlying assets. In order to maintain or adjust the capital structure, the Company may
issue new shares, sell assets or incur debt. The Company is not subject to externally imposed capital
requirements.
The Company utilizes a combination of short-term and long-term debt and equity to finance its operations and
exploration.
The Capital structure of the Company is as follows:
Table 16: Schedule of Capital Structure of the Company
Capital Structure March 31 December 31
Interest Maturity 2011 2011
Demand loan 4.575% Nov/2012 $ 656 $ 896
Demand Loans Prime + 1.50% Jan-Apr/2012 6,611 -
Debenture 12.00% May/2013 9,500 9,452
Total debt $ 16,767 $ 10,348
Shareholders’ equity 184,552 172,895
Debt to equity 9.09 % 5.99 %
Claude Resources Inc.
29. Q1 2012 Management’s Discussion and Analysis
(in thousands of CDN dollars, except as otherwise noted) Page 28
Financial and Other Instruments
In the normal course of its operations, the Company is exposed to gold price, foreign exchange, interest
rate, liquidity, equity price and counterparty risks. The overall financial risk management program focuses
on preservation of capital and protecting current and future Company assets and cash flows by reducing
exposure to risks posed by the uncertainties and volatilities of financial markets.
The Company may use derivative financial instruments to hedge some of its exposure to fluctuations in
gold prices and foreign exchange rates. The Company does not acquire, hold or issue derivatives for trading
purposes. The Company’s management of financial risks is aimed at ensuring that net cash flows are
sufficient to meet all its financial commitments as and when they fall due and to maintain the capacity to
fund its forecast project development and exploration strategies.
The value of the Company’s mineral resources is related to the price of gold and the outlook for this
mineral. Gold and precious metal prices historically have fluctuated widely and are affected by numerous
factors outside of the Company’s control, including, but not limited to, industrial and retail demand, central
bank lending, forward sales by producers and speculators, levels of worldwide production, short-term
changes in supply and demand because of speculative hedging activities and certain other factors related
specifically to gold. The profitability of the Company’s operations is highly correlated to the market price
of gold. If the gold price declines below the cost of production at the Company’s operations, for a
prolonged period of time, it may not be economically feasible to continue production.
The Company’s revenues from the production and sale of gold are denominated in U.S. dollars. However,
the Company’s operating expenses are primarily incurred in Canadian dollars and its liabilities are
primarily denominated in Canadian dollars. The results of the Company’s operations are subject to
currency risks. The operating results and financial position of the Company are reported in Canadian
dollars in the Company’s consolidated financial statements.
The Company did not have any derivative instruments outstanding at March 31, 2012 or March 31, 2011.
The Company’s main interest rate risk arises from interest earning cash deposits that expose the Company
to interest rate risk. No hedging programs were implemented by the Company to manage interest rate risk
during the quarter. The Company invests its cash and cash equivalents and short term investments with the
Government of Canada and major banks according to its investment policy.
The Company’s liquidity position is managed to ensure sufficient liquid funds are available to meet its
financial obligations in a timely manner. The Company manages liquidity risk by continuously monitoring
forecast and actual cash flows and ensuring that the Company has the ability to access required funding.
The Company is exposed to equity securities price risk arising from investments classified on the balance
sheet as available-for-sale. Investments in equity securities are approved by the Board on a case-by-case
basis. All of the Company’s available-for-sale equity investments are in junior resource companies listed on
the TSX Venture Exchange.
The Company is exposed to counterparty risk which is the risk that a counterparty will not complete its
obligations under a financial instrument resulting in a financial loss for the Company. The Company does
not generally obtain collateral or other security to support financial instruments subject to credit risk;
however, the Company only deals with credit worthy counterparties. Accounts receivable comprise
institutions purchasing gold under normal settlement terms of two working days. Counterparty risk under
derivative financial instruments is to reputable institutions. All significant cash balances are on deposit with
high-rated banking institutions. The carrying amount of financial assets recorded in the financial statements
represents the Company’s maximum exposure to credit risk without taking account of the value of any
collateral or other security obtained.
Claude Resources Inc.