Call Girls From Pari Chowk Greater Noida ❤️8448577510 ⊹Best Escorts Service I...
Cgi 20120308
1. KeyBanc
March 8, 2012 CapitalMarkets
INDUSTRIAL: Trucking
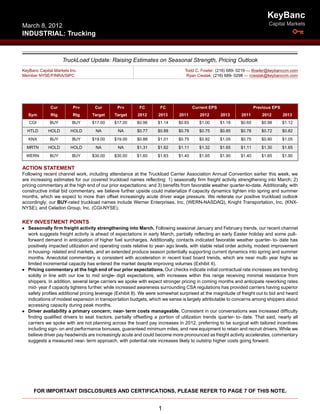
TruckLoad Update: Raising Estimates on Seasonal Strength, Pricing Outlook
KeyBanc Capital Markets Inc. Todd C. Fowler: (216) 689-0219 — tfowler@keybanccm.com
Member NYSE/FINRA/SIPC Ryan Cieslak: (216) 689-0298 — rcieslak@keybanccm.com
Cur Prv Cur Prv FC FC Current EPS Previous EPS
Sym Rtg Rtg Target Target 2012 2013 2011 2012 2013 2011 2012 2013
CGI BUY BUY $17.00 $17.00 $0.96 $1.14 $0.65 $1.00 $1.18 $0.65 $0.98 $1.12
HTLD HOLD HOLD NA NA $0.77 $0.88 $0.78 $0.75 $0.85 $0.78 $0.72 $0.82
KNX BUY BUY $19.00 $19.00 $0.88 $1.01 $0.75 $0.92 $1.05 $0.75 $0.90 $1.05
MRTN HOLD HOLD NA NA $1.31 $1.62 $1.11 $1.32 $1.65 $1.11 $1.30 $1.65
WERN BUY BUY $30.00 $30.00 $1.60 $1.83 $1.40 $1.65 $1.90 $1.40 $1.65 $1.90
ACTION STATEMENT
Following recent channel work, including attendance at the Truckload Carrier Association Annual Convention earlier this week, we
are increasing estimates for our covered truckload names reflecting: 1) seasonally firm freight activity strengthening into March; 2)
pricing commentary at the high end of our prior expectations; and 3) benefits from favorable weather quarter-to-date. Additionally, with
constructive initial bid commentary, we believe further upside could materialize if capacity dynamics tighten into spring and summer
months, which we expect to more than offset increasingly acute driver wage pressure. We reiterate our positive truckload outlook
accordingly; our BUY-rated truckload names include Werner Enterprises, Inc. (WERN-NASDAQ), Knight Transportation, Inc. (KNX-
NYSE), and Celadon Group, Inc. (CGI-NYSE).
KEY INVESTMENT POINTS
● Seasonally firm freight activity strengthening into March. Following seasonal January and February trends, our recent channel
work suggests freight activity is ahead of expectations in early March, partially reflecting an early Easter holiday and some pull-
forward demand in anticipation of higher fuel surcharges. Additionally, contacts indicated favorable weather quarter-to-date has
positively impacted utilization and operating costs relative to year-ago levels, with stable retail order activity, modest improvement
in housing-related end markets, and an extended produce season potentially supporting current dynamics into spring and summer
months. Anecdotal commentary is consistent with acceleration in recent load board trends, which are near multi-year highs as
limited incremental capacity has entered the market despite improving volumes (Exhibit 4).
● Pricing commentary at the high end of our prior expectations. Our checks indicate initial contractual rate increases are trending
solidly in line with our low to mid single-digit expectations, with increases within this range receiving minimal resistance from
shippers. In addition, several large carriers we spoke with expect stronger pricing in coming months and anticipate reworking rates
mid-year if capacity tightens further, while increased awareness surrounding CSA regulations has provided carriers having superior
safety profiles additional pricing leverage (Exhibit 8). We were somewhat surprised at the magnitude of freight out to bid and heard
indications of modest expansion in transportation budgets, which we sense is largely attributable to concerns among shippers about
accessing capacity during peak months.
● Driver availability a primary concern; near-term costs manageable. Consistent in our conversations was increased difficulty
finding qualified drivers to seat tractors, partially offsetting a portion of utilization trends quarter-to-date. That said, nearly all
carriers we spoke with are not planning across the board pay increases in 2012, preferring to be surgical with tailored incentives
including sign-on and performance bonuses, guaranteed minimum miles, and new equipment to retain and recruit drivers. While we
believe driver pay headwinds are increasingly acute and could become more pronounced as freight activity accelerates, commentary
suggests a measured near-term approach, with potential rate increases likely to outstrip higher costs going forward.
FOR IMPORTANT DISCLOSURES AND CERTIFICATIONS, PLEASE REFER TO PAGE 7 OF THIS NOTE.
1
2. Company Note
March 8, 2012
● 1Q12 consensus likely conservative; increasing estimates. Relative to historical seasonality, current 1Q12 estimates imply a
greater than average sequential decline from 4Q11 (Exhibit 2). While noting 4Q11 benefited from an extended peak and favorable
weather, based on our due diligence, seasonally firm freight activity strengthening into March, an extra operating day related to
Leap Year, and continued favorable weather, we believe current 1Q12 consensus estimates are likely conservative. Considering
these trends, we are increasing our 1Q12 estimates to above consensus, and modestly increasing our full year pricing expectations.
With constructive initial bid commentary, we believe further upside could materialize if capacity dynamics tighten into spring and
summer months.
● Reiterate positive outlook. With capacity balanced to tight at the current level of economic activity, we view pricing and utilization
dynamics favorably, and consider improvement in key housing and consumer-related markets incremental (see our February 5 note
“A Look at the Potential Impact of Improved Housing on Trucking”). Despite outperformance year-to-date (KBCM Truckload Index
+12% vs. +8% for the SP 500 and +1% for Dow Jones Transportation Average), valuations remain below five-year median levels
and we reiterate our positive outlook accordingly. Our top ideas include BUY-rated WERN, KNX, and CGI.
2
3. Company Note
March 8, 2012
SUMMARY
Exhibit 1: Summary of Estimate Changes for Truckload Coverage
1Q12E EPS 2012E EPS 2012E Pricing
Old New Consensus Old New Consensus Old New
CGI $0.19 $0.20 $0.19 $1.06 $1.10 $1.05 1.7% 2.4%
HTLD $0.15 $0.16 $0.17 $0.72 $0.75 $0.77 2.2% 2.9%
KNX $0.16 $0.17 $0.16 $0.90 $0.92 $0.88 2.6% 3.2%
MRTN $0.23 $0.25 $0.23 $1.30 $1.32 $1.31 2.7% 2.7%
WERN $0.31 $0.31 $0.29 $1.65 $1.65 $1.60 2.2% 2.2%
Source: KeyBanc Capital Markets Inc.
Note: Represents calendar year estimates for CGI, which has June 30 fiscal year-end
Exhibit 2: Current 1Q12 Consensus Estimates Are Below Historical 1Q/4Q Sequential Progression
Sequential EPS Decline in 1Q from 4Q
Current
10-Yr Avg Last Year Consensus
CGI ($0.05) ($0.04) ($0.05)
HTLD ($0.01) ($0.01) ($0.02)
KNX ($0.03) ($0.08) ($0.06)
MRTN ($0.03) ($0.05) ($0.12)
WERN ($0.09) ($0.11) ($0.11)
Source: KeyBanc Capital Markets Inc.
Exhibit 3: Sensitivity Analysis and 2012 Assumptions for Truckload Coverage
KBCM 2012
Annual Earnings Per Share
Price, Volume, and Operating Ratio 2012 Estimates
Accretion from 100 bps change
Estimates
Operating Price Volume Operating
Price Volume KBCM Consensus
Ratio (Y/Y % Chg) (Y/Y % Chg) Ratio
(based on TL operations only)
CGI (1) $0.09 $0.01 $0.12 2.4% -2.7% 93.4% $1.10 $1.05
HTLD $0.03 $0.01 $0.03 2.9% 2.6% 82.6% $0.75 $0.77
KNX $0.04 $0.01 $0.04 3.2% 1.5% 87.3% $0.92 $0.88
MRTN $0.08 $0.01 $0.09 2.7% 1.0% 91.9% $1.32 $1.30
WERN $0.07 $0.01 $0.10 2.2% -0.6% 90.2% $1.65 $1.61
(1)
Represents calendar-year estimates for CGI, which has June 30 fiscal year-end
Source: KeyBanc Capital Markets Inc.
3
4. Company Note
March 8, 2012
Exhibit 4: Freight Activity Was Seasonally Stable Through February, but Is Strengthening into March
Truckstop.com Market Dem and Index
a reading above 8 equals tight capacity
18
16
14
12
Index Value
10
8
6
4
2 Avg, 2003-2011 2011 2012 YTD
0
Jul
Feb
Jan
Jun
Oct
Mar
May
Nov
Dec
Sep
Aug
Apr
Source: Internet Truckstop, KeyBanc Capital Markets Inc.
Exhibit 5: Spot Rates Are in Line with Normal Seasonality
Spot Rates, Dry-van
$1.600
Spot rate per mile (ex fuel surcharge)
$1.500
$1.400
$1.300
$1.200
$1.100
$1.000
May
Mar
Feb
Nov
Apr
Jan
Jun
Aug
Sep
Jul
Oct
Dec
2011 2012 Avg, 2005-2011
Source: KeyBanc Capital Markets Inc., Internet Truckstop
4
5. Company Note
March 8, 2012
Exhibits 6 and 7: Contractual Rates Remain up Mid-to-High Single Digits Year-over-year
Contractual Dry-Van Truckload Rates Contractual Dry-Van Truckload Rates
Y/Y % Chg Rolling 3 mo. Avg.
12.0% $1.600
10.0%
$1.550
8.0%
6.0%
$1.500
4.0%
2.0% $1.450
0.0%
$1.400
-2.0%
-4.0%
$1.350
-6.0%
-8.0% $1.300
May-04
Jan-05
May-05
Jan-06
May-06
Jan-07
May-07
Jan-08
May-08
Jan-09
May-09
Jan-10
May-10
Jan-11
May-11
Jan-12
Oct-05
Oct-06
Oct-07
Oct-08
Oct-09
Oct-10
Oct-11
Jul-05
Jan-06
Jul-06
Jan-07
Jul-07
Jan-08
Jul-08
Jan-09
Jul-09
Jan-10
Jul-10
Jan-11
Jul-11
Jan-12
Sep-04
Sep-05
Sep-06
Sep-07
Sep-08
Sep-09
Sep-10
Sep-11
Apr-05
Apr-06
Apr-07
Apr-08
Apr-09
Apr-10
Apr-11
Source: KeyBanc Capital Markets Inc., Truckloadrate.com
Exhibit 8: Compliance, Safety, Accountability BASICs by Carrier (as of February 24, 2012)
Controlled
Fatigued Driving Substances and
Unsafe Driving (HOS) Driver Fitness Alcohol Vehicle Maintenance
Carrier Power Units Drivers (60% Threshold) (60% Threshold) (75% Threshold) (75% Threshold) (75% Threshold) Cargo-Related Crash Indicator
Truckload Carriers:
Swift Transportation Inc. 15,212 14,300 41.5% 43.9% 65.8% 31.3% 53.3% NA NA
Schneider National Carriers Inc. 10,617 12,216 22.2% 13.8% 38.4% 3.9% 63.5% NA NA
JB Hunt Transport Inc. 10,512 10,096 14.0% 35.0% 29.8% 5.8% 36.6% NA NA
Werner Enterprises Inc. 8,156 10,384 47.9% 12.0% 53.2% 33.3% 59.1% NA NA
Landstar Ranger Inc. 5,844 6,384 19.8% 55.1% 25.5% 1.9% 58.5% NA NA
US Xpress Inc 5,907 6,638 57.3% 49.4% 48.3% 37.2% 50.7% NA NA
Crete Carrier Corporation 5,421 5,141 24.5% 28.0% 19.8% 13.7% 39.6% NA NA
Knight Transportation Inc. 3,644 3,704 42.6% 30.4% 76.6% 29.4% 56.7% NA NA
Knight Refrigerated LLC 630 739 46.7% 38.4% 86.5% No Violations 36.8% NA NA
Quality Carriers Inc 3,424 3,360 25.1% 45.8% 56.8% Inconclusive 60.1% NA NA
Celadon Trucking Service Inc 3,810 2,650 40.3% 42.6% 66.8% 23.5% 52.1% NA NA
Celadon Canada Inc 256 266 16.7% 16.6% No Violations No Violations 31.6% NA NA
Heartland Express Inc. 2,886 2,886 26.9% 24.3% 36.7% 39.2% 13.8% NA NA
Con-way Truckload Inc. 2,741 2,968 50.8% 26.9% 30.4% 56.8% 37.2% NA NA
Marten Transport Ltd. 2,362 2,662 75.4% 18.8% 59.3% Inconclusive 25.3% NA NA
Western Express Inc. 2,450 2,450 80.7% 70.0% 94.5% 66.6% 63.1% NA NA
USA Truck Inc. 2,368 2,508 54.9% 62.5% 60.1% 60.7% 67.0% NA NA
Covenant Inc. 1,675 3,000 53.8% 34.8% 47.2% 1.8% 32.3% NA NA
CRST Expedited Inc. 1,931 3,979 94.1% 37.9% 63.5% 9.8% 25.9% NA NA
Interstate Distributor Co. 1,908 2,119 36.2% 39.0% 33.5% Inconclusive 30.1% NA NA
NFI Interactive Logistics LLC 1,250 1,387 17.5% 42.7% 45.1% No Violations 59.9% NA NA
Less-than-truckload Carriers:
Con-way Freight 9,304 14,103 3.5% 21.6% 28.7% 0.9% 25.7% NA NA
Con-way Freight Canada Inc 132 207 No Violations Inconclusive No Violations No Violations 13.1% NA NA
ABF Freight System Inc 3,848 6,730 6.4% 21.0% 20.8% No Violations 42.6% NA NA
Old Dominion Freight Line Inc 6,065 6,978 5.8% 29.9% 32.8% No Violations 44.6% NA NA
Fedex Freight Inc 14,703 18,820 1.7% 17.0% 23.8% 5.5% 38.6% NA NA
UPS Freight Inc 7,186 8,465 8.1% 38.1% 23.1% 1.6% 58.1% NA NA
New Penn Motor Express Inc 879 1,534 3.1% 13.8% 48.5% No Violations 25.9% NA NA
USF Holland Inc 3,948 4,876 16.3% 26.3% 12.0% 0.4% 56.9% NA NA
USF Reddaway Inc 1,488 1,413 0.4% 10.1% 3.8% No Violations 31.7% NA NA
YRC Inc 8,766 14,279 4.0% 27.1% 31.3% 0.0% 70.0% NA NA
Other:
Comtrak Logistics 2,153 2,135 22.8% 36.3% 33.2% 10.3% 74.2% NA NA
Ryder Truck Rental Inc 106,053 488 0.0% 30.6% 48.4% No Violations 14.0% NA NA
Note: As of February 24, 2012
Source: Federal Motor Carrier Safety Administration
5
6. Company Note
March 8, 2012
Exhibit 9: Truckload Valuation Comparison
12-Month 52- 52- Price Tgt
Market 03/08/12 Price Upside to Week Week P/E Multiple Hist(1) EV/EBITDA Hist(1) Dividend Net Cash Book Price Avg Vol Op
Ticker Companies Rating Cap (mil) Price Target Price Tgt Low High 2012E 2013E (2012E) P/E 2012E 2013E EV/EBITDA Yield (Debt)/Share / Share / Book ('000s) Margin
Truckload Covered Companies:
JBHT J.B. Hunt Transport Services, Inc. Hold $5,993 $51.20 NA NA $34.42 $53.02 20.5x 18.0x NA 19x 8.7x 7.9x 9x 1.0% ($6.23) $4.75 10.8x 864 9.9%
WERN Werner Enterprises, Inc. Buy $1,826 $25.06 $30.00 19.7% $19.78 $27.17 15.2x 13.2x 18.2x 17x 5.0x 4.5x 5x 0.8% $0.17 $9.89 2.5x 450 8.7%
KNX Knight Transportation, Inc. Buy $1,406 $17.71 $19.00 7.3% $12.63 $19.96 19.3x 16.8x 20.7x 21x 7.1x 6.5x 8x 1.4% ($0.57) $5.98 3.0x 522 11.5%
HTLD Heartland Express, Inc. Hold $1,269 $14.67 NA NA $12.75 $18.12 19.7x 17.3x NA 20x 6.9x 6.5x 10x 0.5% $1.60 $3.91 3.8x 244 20.2%
MRTN Marten Transport, Ltd. Hold $456 $20.72 NA NA $15.90 $23.32 15.7x 12.6x NA 18x 3.8x 3.4x 5x 0.4% $0.94 $14.42 1.4x 55 7.1%
CGI Celadon Group, Inc. (2) Buy $334 $14.65 $17.00 16.0% $8.18 $16.80 13.3x 11.3x 15.4x 17x 8.8x 7.7x 7x 0.0% ($11.05) $7.91 1.9x 113 5.7%
Peer Companies:
SWFT Swift Transportation Company NC $1,536 $11.01 NA NA $5.39 $15.29 11.6x 9.8x NA NA 5.4x 5.0x NA 0.0% ($10.80) $0.62 NM 1,343 10.6%
UACL Universal Truckload Services, Inc. NC $238 $15.30 NA NA $11.14 $19.08 13.0x 11.3x NA 18x 5.3x 4.7x 9x 0.0% $1.09 $10.93 1.4x 23 4.8%
PTSI P.A.M. Transportation Services, Inc. NC $98 $10.97 NA NA $9.03 $13.14 NM NM NA 15x 3.1x 2.7x 4x 0.0% ($3.16) $15.69 0.7x 3 NA
USAK USA Truck, Inc. NC $82 $7.89 NA NA $6.75 $13.24 NM 18.3x NA 16x 3.9x 3.4x 4x 0.0% ($11.83) $12.33 0.6x 38 -2.7%
CVTI Covenant Transport, Inc. NC $50 $3.37 NA NA $2.35 $9.86 NM 9.6x NA NM 4.0x 3.6x 6x 0.0% ($16.21) $5.91 0.6x 16 1.6%
Group Average $1,208 15.7x 13.6x 17.9x 5.6x 5.1x 7x 0.5% ($5.10) $8.40 2.7x 334 7.7%
(1)
Represents 5-year median
(2)
Represents calendar-year estimates for Celadon Group, Inc. which has June 30 fiscal year-end; Net debt includes off balance sheet obligations
Risks that could impede shares from reaching our price targets include a slowdown in freight demand from macro economic factors, price competition and/or increased operating costs.
Source: KeyBanc Capital Markets Inc., Factset Research Systems Inc.
6
7. Company Note
March 8, 2012
KeyBanc Capital Markets Inc. Disclosures and Certifications
Important disclosures for the companies mentioned in this report can be found at https://key2.bluematrix.com/sellside/
Disclosures.action.
Please refer to the analysts' recently published reports for company-specific valuation and risks.
Reg A/C Certification
The research analyst(s) responsible for the preparation of this research report certifies that:(1) all the views expressed in
this research report accurately reflect the research analyst's personal views about any and all of the subject securities or
issuers; and (2) no part of the research analyst's compensation was, is, or will be directly or indirectly related to the specific
recommendations or views expressed by the research analyst(s) in this research report.
Rating Disclosures
Distribution of Ratings/IB Services Firmwide and by Sector
KeyBanc Capital Markets INDUSTRIAL
IB Serv/Past 12 Mos. IB Serv/Past 12 Mos.
Rating Count Percent Count Percent Rating Count Percent Count Percent
BUY [BUY] 225 44.20 46 20.44 BUY [BUY] 108 46.80 11 10.19
HOLD [HOLD] 273 53.60 48 17.58 HOLD [HOLD] 123 53.20 12 9.76
SELL [UND] 11 2.20 4 36.36 SELL [UND] 0 0.00 0 0.00
Rating System
BUY - The security is expected to outperform the market over the next six to 12 months; investors should consider adding the
security to their holdings opportunistically, subject to their overall diversification requirements.
HOLD - The security is expected to perform in line with general market indices over the next six to 12 months; no buy or sell
action is recommended at this time.
UNDERWEIGHT - The security is expected to underperform the market over the next six to 12 months; investors should
reduce their holdings opportunistically.
The information contained in this report is based on sources considered to be reliable but is not represented to be
complete and its accuracy is not guaranteed. The opinions expressed reflect the judgment of the author as of the
date of publication and are subject to change without notice. This report does not constitute an offer to sell or a
solicitation of an offer to buy any securities. Our company policy prohibits research analysts and members of their
families from owning securities of any company followed by that analyst, unless otherwise disclosed. Our officers,
directors, shareholders and other employees, and members of their families may have positions in these securities and
may, as principal or agent, buy and sell such securities before, after or concurrently with the publication of this report.
In some instances, such investments may be inconsistent with the opinions expressed herein. One or more of our
employees, other than the research analyst responsible for the preparation of this report, may be a member of the Board
of Directors of any company referred to in this report. The research analyst responsible for the preparation of this report is
compensated based on various factors, including the analyst's productivity, the quality of the analyst's research and stock
recommendations, ratings from investor clients, competitive factors and overall Firm revenues, which include revenues
derived from, among other business activities, the Firm's performance of investment banking services. In accordance with
industry practices, our analysts are prohibited from soliciting investment banking business for our Firm.
Investors should assume that we are seeking or will seek investment banking or other business relationships with the
company described in this report.
7