Average GDP per Capita by Region (thousands US$, PPP rates, per resident)
•
1 j'aime•2,193 vues

Recommandé

Recommandé
Contenu connexe
Plus de Cushman & Wakefield
Plus de Cushman & Wakefield (14)
Dernier
Dernier (20)
Average GDP per Capita by Region (thousands US$, PPP rates, per resident)
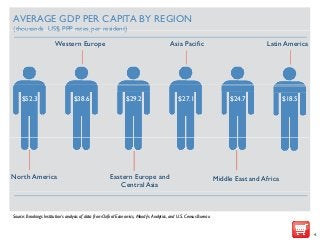
- 1. 2013/2014 WINNING IN GROWTH CITIES: RETAIL A Cushman & Wakefield Capital Markets Research Publication POPULATION AND GROSS DOMESTIC PRODUCT A good proxy for measuring the prospects of entering a particular retail market is population size. The number of potential consumers in each market would be of great importance to retailers as they weigh up the costs and benefits of opening stores across the world. However, population alone cannot effectively account for the difference in affluence and purchasing power power. In order to measure this, another indicator which was factored in our analysis was gross domestic product as calculated in purchasing power parity – therefore taking into account inflation and cost differences between countries. Both population and GDP for metropolitan cities were calculated by Brookings Institution as part of their analysis of data from Oxford Economics, Moody's Moody s Analytics, and U.S. Census Bureau. The most populated metropolitan area around the world in 2012 was Tokyo with over 36.6 million of residents. The Japanese capital was followed in second place by Jakarta, the Indonesian capital, which contained over 31 million inhabitants in 2012. The metropolitan area of Chongqing completed the top three with just over 29.1 million inhabitants. Indeed, it is not surprising that the most populous continent, Asia, contains the top eight largest cities across the globe by population. On the other hand, the purchasing power of the average consumer in each city differs significantly. If we examine the two largest cities by population as an example, Tokyo and Jakarta, GDP in the Japanese capital is almost seven times greater than that of Jakarta, making the case for a more attractive retail market. This does not exclude the potential for further development in the Indonesian capital due its vast population, but it does nonetheless highlight the disparity in purchasing power. When ranking cities by nominal GDP (PPP rate), Tokyo again comes out on top with just under $1.52 trillion, followed in second by New York with $1.21 trillion and Los Angeles with $ 787 billion. , g population, GDP p capita for , per p However, when taking into account p p these U.S. cities is far greater. Indeed, the first seven positions for GDP per capita are all occupied by U.S. Cities, with Hartford – famous for its insurance industry – in first place with almost $80,000 per inhabitant. Meanwhile, among the leading global gateway cities with a population of at least 10 million, New York has the highest GDP per capita, followed by Los Angeles, Paris and London. Moscow completes the top five, with Tokyo – the most populous metropolitan area in the world – sixth with $41,446 per capita. AVERAGE GDP PER CAPITA BY REGION (thousands US$, PPP rates, per resident) Western Europe $52.3 North America $38.6 Asia Pacific $29.2 $27.1 Eastern Europe and Central Asia Latin America $24.7 $18.5 Middle East and Africa Source: Brookings Institution’s analysis of data from Oxford Economics, Moody's Analytics, and U.S. Census Bureau 4