Revenue Drivers Key to Investment Bank Profitability
•
0 j'aime•284 vues

Revenue generation has a greater impact on long-term profitability and share prices than cost cutting alone. While cost cutting can provide short-term gains, investment banks should focus on innovating to create new business lines and revenue sources. An analysis of 12 banks found a strong correlation between operating revenue and pre-tax profit margins but a weak correlation with operating expenses. Revenue generation is thus a better determinant of valuation metrics like price-to-earnings and price-to-book value ratios.

Recommandé
Contenu connexe
Tendances
Tendances (20)
Similaire à Revenue Drivers Key to Investment Bank Profitability
Similaire à Revenue Drivers Key to Investment Bank Profitability (20)
Plus de Tricumen Ltd
Plus de Tricumen Ltd (20)
Dernier
Dernier (20)
Revenue Drivers Key to Investment Bank Profitability
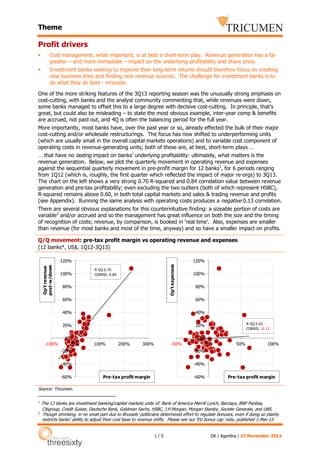
- 1. Theme Profit drivers Cost management, while important, is at best a short-term play. Revenue generation has a far greater – and more immediate – impact on the underlying profitability and share price. Investment banks seeking to improve their long-term returns should therefore focus on creating new business lines and finding new revenue sources. The challenge for investment banks is to do what they do best - innovate. One of the more striking features of the 3Q13 reporting season was the unusually strong emphasis on cost-cutting, with banks and the analyst community commenting that, while revenues were down, some banks managed to offset this to a large degree with decisive cost-cutting. In principle, that’s great, but could also be misleading – to state the most obvious example, inter-year comp & benefits are accrued, not paid out, and 4Q is often the balancing period for the full year. More importantly, most banks have, over the past year or so, already effected the bulk of their major cost-cutting and/or wholesale restructurings. The focus has now shifted to underperforming units (which are usually small in the overall capital markets operations) and to variable cost component of operating costs in revenue-generating units; both of these are, at best, short-term plays … … that have no lasting impact on banks’ underlying profitability: ultimately, what matters is the revenue generation. Below, we plot the quarterly movement in operating revenue and expenses against the sequential quarterly movement in pre-profit margin for 12 banks1, for 6 periods ranging from 1Q12 (which is, roughly, the first quarter which reflected the impact of major re-orgs) to 3Q13. The chart on the left shows a very strong 0.70 R-squared and 0.84 correlation value between revenue generation and pre-tax profitability; even excluding the two outliers (both of which represent HSBC), R-squared remains above 0.60, in both total capital markets and sales & trading revenue and profits (see Appendix). Running the same analysis with operating costs produces a negative 0.13 correlation. There are several obvious explanations for this counterintuitive finding: a sizeable portion of costs are variable2 and/or accrued and so the management has great influence on both the size and the timing of recognition of costs; revenue, by comparison, is booked in ‘real time’. Also, expenses are smaller than revenue (for most banks and most of the time, anyway) and so have a smaller impact on profits. Q/Q movement: pre-tax profit margin vs operating revenue and expenses (12 banks*, US$, 1Q12-3Q13) 120% Op't expenses Op't revenue post-w/down 120% R-SQ 0.70 CORREL 0.84 100% 80% 100% 80% 60% 60% 40% 40% 20% 20% 0% -100% R-SQ 0.02 CORREL -0.13 0% 0% 100% 200% -50% 300% 0% -20% -40% 50% 100% -20% -40% -60% -60% Pre-tax profit margin Pre-tax profit margin Source: Tricumen. 1 2 The 12 banks are investment banking/capital markets units of: Bank of America Merrill Lynch, Barclays, BNP Paribas, Citigroup, Credit Suisse, Deutsche Bank, Goldman Sachs, HSBC, J.P.Morgan, Morgan Stanley, Societe Generale, and UBS. Though shrinking, in no small part due to Brussels’ politicians determined effort to regulate bonuses, even if doing so plainly restricts banks’ ability to adjust their cost base to revenue shifts. Please see our ‘EU bonus cap’ note, published 1-Mar-13. 1/5 DK / Agentha / 27 November 2013
- 2. Theme Equity investors heavily favour revenue generators, too. Below, we focus on banks which generated 50%+ of their normalised Group 9m13 pre-tax profit from capital markets activities (MS’ Institutional Securities contributed 45%, but the bank’s share price is heavily influenced by capital markets earnings, so we include it in this peer group). For these banks, we compare capital markets revenues with Group historical book value and earnings valuations. This is an imperfect comparison, not least because capital markets earnings are but one of the factors influencing share valuation, especially at global universals (here, mainly Citigroup) and ‘specials’ (e.g. the ‘Swiss finish’ for CS and UBS). And yet, the link between operating revenue and valuation dynamics is evident, particularly for banks that have avoided ‘transformational’ restructuring from 1Q12 to date: Bank of America Merrill Lynch, Barclays, Deutsche Bank and J.P.Morgan – all of which have generated well over half of their 9m13 Group profit from capital markets activities. Operating revenue vs P/E and P/BV* valuations (US$, 1Q12-3Q13, indexed to 1Q12) Bank of America Merrill Lynch Barclays 140% 130% 130% 120% 120% 110% 110% 100% 100% 90% 90% Composite P/E & P/BV Op't revenue Composite P/E & P/BV Citigroup end-3Q13 end-2Q13 end-1Q13 end-4Q12 end-3Q12 end-2Q12 end-1Q12 end-3Q13 end-2Q13 end-1Q13 end-4Q12 60% end-3Q12 70% 60% end-2Q12 80% 70% end-1Q12 80% Op't revenue Credit Suisse Composite P/E & P/BV Composite P/E & P/BV Deutsche Bank end-3Q13 end-3Q13 Op't revenue end-2Q13 40% end-1Q13 60% end-4Q12 60% end-3Q12 80% end-2Q12 80% end-1Q12 100% 100% end-2Q13 120% end-1Q13 120% end-4Q12 140% 140% end-3Q12 160% end-2Q12 160% end-1Q12 180% Op't revenue Goldman Sachs 130% 120% 110% 100% 90% 80% 70% 60% 50% 40% 120% 110% 100% 90% 80% 70% 60% 50% Composite P/E & P/BV Op't revenue Composite P/E & P/BV end-3Q13 end-2Q13 end-1Q13 end-4Q12 end-3Q12 end-2Q12 end-1Q12 end-3Q13 end-2Q13 end-1Q13 end-4Q12 end-3Q12 end-2Q12 end-1Q12 40% Op't revenue Source: Tricumen analysis; share price sourced from FT.com. Notes: (1) composite price/earnings (P/E) and price/book value (P/BV) calculations are based on actual period-end values and share prices; (2) P/E outliers falling outside the 3-standard deviation band for the 12 banks peer group are excluded. 2/5 DK / Agentha / 27 November 2013
- 3. Theme Operating revenue vs valuations (US$, 1Q12-3Q13, indexed to 1Q12) (cont.) J.P.Morgan Morgan Stanley Composite P/E & P/BV Composite P/E & P/BV end-3Q13 end-2Q13 end-1Q13 end-1Q12 Op't revenue end-4Q12 60% end-3Q12 70% 60% end-2Q12 80% 70% end-3Q13 90% 80% end-2Q13 100% 90% end-1Q13 110% 100% end-4Q12 110% end-3Q12 120% end-2Q12 130% 120% end-1Q12 130% Op't revenue UBS 180% 160% 140% 120% 100% 80% 60% Composite P/E & P/BV end-3Q13 end-2Q13 end-1Q13 end-4Q12 end-3Q12 end-2Q12 end-1Q12 40% Op't revenue Source: Tricumen analysis; share price sourced from FT.com. Notes: (1) composite price/earnings (P/E) and price/book value (P/BV) calculations are based on actual period-end values and share prices; (2) P/E outliers falling outside the 3-standard deviation band for the 12 banks peer group are excluded. In conclusion, we believe that in the current ROE-constrained environment, the winners will need to find new revenue sources, or new ways of generating revenue from existing businesses. Most banks are already exploring more effectively partnering with their commercial, transaction or private banking divisions. We also expect more progress in genuine product innovation to create new markets. Arguably, the last large-scale innovation was the birth of credit derivatives; since then, new markets have emerged – e.g. longevity derivative, property derivatives and carbon trading - but none has grown enough to make a meaningful impact on capital markets revenues. The challenge for investment banks is to do what they do best - innovate. 3/5 DK / Agentha / 27 November 2013
- 4. Theme Appendix Q/Q movement: pre-tax profit margin vs operating revenue (12 banks*, US$, 1Q12-3Q13) Capital Markets Primary activities Op't revenue post-w/down 200% 120% R-SQ 0.70 CORREL 0.84 100% 100% 0% -50% 0% -50% -100% 60% R² = 0.206 50% 50% 100% 150% -100% Pre-tax profit margin 40% Sales & Trading 20% 150% 0% -100% -50% 0% 50% 100% 150% 200% 250% -20% R² = 0.6992 Op't revenue post-w/down Operating revenue post-w/down 80% 150% 100% 50% 0% -100% -40% 0% 100% 200% 300% -50% -60% -100% Pre-tax profit margin Pre-tax profit margin Q/Q movement: pre-tax profit margin vs operating expenses (12 banks*, US$, 1Q12-3Q13) Capital Markets Primary activities 200% Op't Expenses 120% 150% 100% 100% 80% R² = 0.2552 0% -50% 0% -50% 60% Operating Expenses 50% 40% -100% 20% R-SQ 0.02 CORREL -0.13 -40% -20% 100% 150% 200% Pre-tax profit margin Sales & Trading 150% 0% -60% 50% 0% 20% 40% 60% 80% Operating Expenses -20% -40% -60% -100% Pre-tax profit margin 100% 50% R² = 7E-05 0% -50% 0% 50% 100% 150% -50% -100% Pre-tax profit margin Source: Tricumen. Note: The 12 banks are investment banking/capital markets units of: Bank of America Merrill Lynch, Barclays, BNP Paribas, Citigroup, Credit Suisse, Deutsche Bank, Goldman Sachs, HSBC, J.P.Morgan, Morgan Stanley, Societe Generale, and UBS. 4/5 DK / Agentha / 27 November 2013
- 5. Theme About Tricumen Tricumen was founded in 2008. It quickly become a strong provider of diversified market intelligence across the capital markets and has since expanded into transaction and corporate banking coverage. Tricumen’s data has been used by many of the world’s leading investment banks as well as strategy consulting firms, investment managers and ‘blue chip’ corporations. Situated near Cambridge in the UK, Tricumen is almost exclusively staffed with senior individuals with an extensive track record of either working for or analysing banks; and boasts what we believe is the largest capital markets-focused research network of its peer group. Caveats This report and the information contained herein may not be reproduced or distributed in the whole or in part without the prior written consent of Tricumen Limited. Such consent is often given provided that the information released does not prejudice Tricumen Limited’s business or compromise the company’s ability to analyse the financial markets. Tricumen Limited has used all reasonable care in writing, editing and presenting the information found in this report. All reasonable effort has been made to ensure the information supplied is accurate and not misleading. For the purposes of cross- market comparison, all numerical data is normalised in accordance to Tricumen Limited’s proprietary product classification. Fully-researched dataset may contain margin of error of +/-10%; for modelled datasets, this margin may be wider. The information and commentary provided in this report has been compiled for informational purposes only. We recommend that independent advice and enquiries should be sought before acting upon it. Readers should not rely on this information for legal, accounting, investment, or similar purposes. No part of this report constitutes investment advice, any form of recommendation, or a solicitation to buy or sell any instrument or to engage in any trading or investment activity or strategy. Tricumen Limited does not provide investment advice or personal recommendation nor will it be deemed to have done so. Tricumen Limited makes no representation, guarantee or warranty as to the suitability, accuracy or completeness of the report or the information therein. Tricumen Limited assumes no responsibility for information contained in this report and disclaims all liability arising from negligence or otherwise in respect of such information. Tricumen Limited is not liable for any damages arising in contract, tort or otherwise from the use of or inability to use this report or any material contained in it, or from any action or decision taken as a result of using the report. 5/5 DK / Agentha / 27 November 2013