SlideShare une entreprise Scribd logo
1  sur  5
PRESUPUESTO DE COSTOS DEL PROYECTO
                        Costo total                      2012           2013            2014          2015          2016           2017               2018            2019            2020            2021            2022
gastos directos
materia prima                      $55,782         $62,475.84     $69,972.94    $78,369.69       $87,774.06      $98,306.94    $110,103.78     $123,316.23     $138,114.18     $154,687.88     $173,250.42     $194,040.48
sueldos y salarios                $692,400          $747,792     $807,615.36   $872,224.59      $942,002.56   $1,017,362.76   $1,098,751.78   $1,186,651.92   $1,281,584.08   $1,384,110.80   $1,494,839.67   $1,614,426.84
gastos indirectos

     materiales y                     $10,499
articulos de limpieza                              $11,758.32     $13,169.32       $14,749.64    $16,519.59     $18,501.94      $20,722.18      $23,208.84      $25,993.90      $29,113.17      $32,606.75      $36,519.56
otros gastos
energia electrica                    6000               6720         7526.4          8429.568    9441.11616     10574.0501     11842.93611     13264.08844     14855.77906     16638.47254     18635.08925     20871.29996
depreciacion                     119907.57          119907.57     119907.57         119907.57     119907.57      119907.57       119907.57       119907.57       119907.57       119907.57       119907.57       119907.57
amortizacion                      $15,000            $15,000       $15,000           $15,000       $15,000        $15,000         $15,000         $15,000         $15,000         $15,000         $15,000         $15,000
mantenimiento                    134907.57          134907.57     134907.57         134907.57     134907.57      134907.57       134907.57       134907.57       134907.57       134907.57       134907.57       134907.57
total                            275815.14          276535.14     552350.28        278244.708   279256.2562    557500.9642     281658.0761     283079.2284     564737.3046     286453.6125     288450.2293     574903.8418

                                                inflacion 12%
                                                tasa de ingremento de sueldos 8%
PRESUPUESTO DE GASTOS DE ADMINISTRACIÓN
                              2012            2013       2014       2015       2016         2017          2018          2019          2020          2021          2022
Sueldos y salarios          302400          338688 343042.56 384207.667 430312.587    481950.098    539784.109    604558.203    677105.187    758357.809    849360.746
telefono                     12000           13440    15052.8 16859.136 18882.2323    21148.1002    23685.8722    26528.1769    29711.5581    33276.9451    37270.1785
Depreciación              $2,611.15       $2,611.15 $2,611.15 $2,611.15 $2,611.15       $2,611.15     $2,611.15     $2,611.15     $2,611.15     $2,611.15     $2,611.15
Amortización                 $1,800          $1,800    $1,800     $1,800     $1,800        $1,800        $1,800        $1,800        $1,800        $1,800        $1,800
Mantenimiento              $10,000         $11,200 $12,544.00 $14,049.28 $15,735.19    $17,623.42    $19,738.23    $22,106.81    $24,759.63    $27,730.79    $31,058.48
Gastos de oficina        $1,302.00       $1,458.24 $1,633.23 $1,829.22 $2,048.72        $2,294.57     $2,569.92     $2,878.31     $3,223.70     $3,610.55     $4,043.81
Otros gastos                29546.5       33092.08 37063.1296 41510.7052 46491.9898   52071.0285     58319.552    65317.8982     73156.046    81934.7715    91766.9441
Totales                  359659.65       402289.47 413746.868 462867.155 517881.875   579498.362    648508.828    725800.549    812367.277    909322.012    1017911.32

                     inflacion 12%
                     incremento del sueldo y salario 8%
gastos de venta y de distribucion
                                   2012       2013          2014      2015        2016       2017        2018        2019         2020          2021          2022
Sueldos y salarios              372000     401760      433900.8     468613     506101.9    546590    590317.25   637542.63   688546.038   743629.7213    803120.099
Teléfono                         12000      13440         15052.8   16859.1    18882.23    21148.1   23685.872   26528.177   29711.5581   33276.94509    37270.1785
Depreciación                     $7,200     $7,200         $7,200    $7,200      $7,200     $7,200      $7,200      $7,200       $7,200        $7,200        $7,200
Impuestos
Mantenimiento                      6000       6720         7526.4   8429.57    9441.116   10574.05   11842.936   13264.088   14855.7791   16638.47254   18635.08925

Combustibles y gastos de
vehículos                         31200     34944      39137.28     43833.8     49093.8   54985.06   61583.268    68973.26   77250.0511   86520.05723    96902.4641
Totales                         428400     464064      502817.3     544935      590719    640497.3   694629.32   753508.15   817563.426   887265.1961   963127.8308


                                          inflacion 12%
                                          incremento del sueldo y salario 8%
ESTADO DE RESULTADOS

                                                       año

                            2012                2013               2014              2015              2016            2017            2018            2019            2020            2021            2022

ventas                $2,160,000   $   2,661,120.00             3273534         4032131.4      4965055.92        6113818.06      7528799.94      9270826.73     11415324.26     14057140.95     18360867.08
(-) costos de
produccion                874164         979063.68           1096551.322       1228137.48     1375513.978       1540575.655     1725444.734     1932498.102     2164397.874     2424125.619     2715020.693

utilidad bruta        $1,285,836   $   1,682,056.32          2176982.678       2803993.92     3589541.942       4573242.405     5803355.206     7338328.628     9250926.386     11633015.33     15645846.39
(-) gastos de
administracion         359659.65         402289.47             413746.87        462867.15         517881.88       579498.36       648508.83       725800.55       812367.28       909322.01       1017911.3
(-) gastos de
venta                     428400              464064           502817.28        544935.32         590719.05       640497.26       694629.32       753508.15       817563.43        887265.2       963127.83
utilidad de                      $
operación               $497,776 815,702.85                  1260418.528       1796191.45     2581739.472       3353246.785     4460217.056     5859019.928     7620995.676     9836428.121     9836428.121
gastos
financieros


utilidad antes
ISR y PTU               $487,776         815702.85           1260418.528       1796191.45     2581739.472       3353246.785     4460217.056     5859019.928     7620995.676     9836428.121     9836428.121
(-) ISR y PTU
(35% +10%)           $219,499.20       367066.2825           567188.3376      808286.1525     1161782.762       1508961.053     2007097.675     2636558.968     3429448.054     4426392.654     4426392.654

utilidad neta        $268,276.80       448636.5675           693230.1904      987905.2975      1419956.71       1844285.732     2453119.381      3222460.96     4191547.622     5410035.467     5410035.467
(+)
depresiacion y
amortizacion          $14,388.91         $14,388.91           $14,388.91       $14,388.91         $14,388.91     $14,388.91      $14,388.91      $14,388.91      $14,388.91      $14,388.91      $14,388.91

flujos de caja       $282,665.71        $463,025.48          $707,619.10     $1,002,294.21   $1,434,345.62     $1,858,674.64   $2,467,508.29   $3,236,849.87   $4,205,936.53   $5,424,424.38   $5,424,424.38


                 inflacion 12%
BALANCE GENERAL


  ACTIVOS                                                                                      PASIVO
Circulante
cajas y bancos
       1                           $185,863
     Total                                         $185,863             credito a banmujer                           $150,000
Fijos
                                                                                                        CAPITAL CONTABLE


Maquinaria
equipo                             23,148.00                        Aportaciones de los socios                        $98,011
Equipo de
oficina                            21759.57
Equipo de
venta y dist.                       60,000
Total                                             83,148.00
  Diferidos
Licencias y permisos                15,000

Total                                               15,000

Sumas del activo                                   $284,011         Suma pasivo mas capital                          $248,011


Se considero el equivalente a dos meses de costos de producción y gastos de operación y ventas.
Costos de venta anual                                                           275815.14
Gastos de administración                                                        359659.65
Gastos de venta                                                                              428400
                  Total                                                          $   1,063,877.79
                  Mensual                                                              88,656.48
                  Importe de dos meses                                               177,312.97
                  Imprevistos                                                                  8550

                  Total                                                              185,862.97

Contenu connexe

Tendances

Main World Equity Indices Fundamental Value - Based on Analyst Estimates
Main World Equity Indices Fundamental Value - Based  on Analyst EstimatesMain World Equity Indices Fundamental Value - Based  on Analyst Estimates
Main World Equity Indices Fundamental Value - Based on Analyst EstimatesBCV
 
Year 12 Maths A Textbook - Answers
Year 12 Maths A Textbook - AnswersYear 12 Maths A Textbook - Answers
Year 12 Maths A Textbook - Answerswesty67968
 
Mq9 nsw 5 3 answers
Mq9 nsw 5 3 answersMq9 nsw 5 3 answers
Mq9 nsw 5 3 answersShubham Saha
 
Maths A Textbook - Answers
Maths A Textbook - AnswersMaths A Textbook - Answers
Maths A Textbook - Answerswesty67968
 
Williams sonoma model
Williams sonoma model Williams sonoma model
Williams sonoma model Trishala Rasya
 
Maths A - Skill sheets answers
Maths A - Skill sheets answersMaths A - Skill sheets answers
Maths A - Skill sheets answerswesty67968
 
Financial Forecasting
Financial ForecastingFinancial Forecasting
Financial ForecastingTravonnLee
 
Jsw Ipo
Jsw IpoJsw Ipo
Jsw IpoKunal
 
Financials1 P
Financials1 PFinancials1 P
Financials1 Pemronly
 
Acme Company Financial Model
Acme Company Financial ModelAcme Company Financial Model
Acme Company Financial ModelBruceSlides555
 
Case 2 aymaan hossain (1531434030)
Case 2  aymaan hossain (1531434030)Case 2  aymaan hossain (1531434030)
Case 2 aymaan hossain (1531434030)AymaanHossain1
 
J.S. Die & Mold - Operations Review 2006-12-21
J.S. Die & Mold - Operations Review 2006-12-21J.S. Die & Mold - Operations Review 2006-12-21
J.S. Die & Mold - Operations Review 2006-12-21Bob Sloma
 
Financial Annual Report Common Size
Financial Annual Report Common SizeFinancial Annual Report Common Size
Financial Annual Report Common SizeTaylor Wiley
 
Tata Motors Ratio Analysis
Tata Motors Ratio AnalysisTata Motors Ratio Analysis
Tata Motors Ratio Analysispurval
 
Data length of stayagesexprincipal payer total chgesrt chgeimaging
Data length of stayagesexprincipal payer total chgesrt chgeimaging Data length of stayagesexprincipal payer total chgesrt chgeimaging
Data length of stayagesexprincipal payer total chgesrt chgeimaging ANIL247048
 
Tata Motors – Ratio Analysis
Tata Motors – Ratio AnalysisTata Motors – Ratio Analysis
Tata Motors – Ratio AnalysisJitendra
 

Tendances (20)

Main World Equity Indices Fundamental Value - Based on Analyst Estimates
Main World Equity Indices Fundamental Value - Based  on Analyst EstimatesMain World Equity Indices Fundamental Value - Based  on Analyst Estimates
Main World Equity Indices Fundamental Value - Based on Analyst Estimates
 
Year 12 Maths A Textbook - Answers
Year 12 Maths A Textbook - AnswersYear 12 Maths A Textbook - Answers
Year 12 Maths A Textbook - Answers
 
Mq9 nsw 5 3 answers
Mq9 nsw 5 3 answersMq9 nsw 5 3 answers
Mq9 nsw 5 3 answers
 
Maths A Textbook - Answers
Maths A Textbook - AnswersMaths A Textbook - Answers
Maths A Textbook - Answers
 
Williams sonoma model
Williams sonoma model Williams sonoma model
Williams sonoma model
 
Maths A - Skill sheets answers
Maths A - Skill sheets answersMaths A - Skill sheets answers
Maths A - Skill sheets answers
 
Microsoft Company
Microsoft CompanyMicrosoft Company
Microsoft Company
 
Financial Forecasting
Financial ForecastingFinancial Forecasting
Financial Forecasting
 
Jsw Ipo
Jsw IpoJsw Ipo
Jsw Ipo
 
Financials1 P
Financials1 PFinancials1 P
Financials1 P
 
Acme Company Financial Model
Acme Company Financial ModelAcme Company Financial Model
Acme Company Financial Model
 
Case 2 aymaan hossain (1531434030)
Case 2  aymaan hossain (1531434030)Case 2  aymaan hossain (1531434030)
Case 2 aymaan hossain (1531434030)
 
proforma sample
proforma sampleproforma sample
proforma sample
 
J.S. Die & Mold - Operations Review 2006-12-21
J.S. Die & Mold - Operations Review 2006-12-21J.S. Die & Mold - Operations Review 2006-12-21
J.S. Die & Mold - Operations Review 2006-12-21
 
Financial Annual Report Common Size
Financial Annual Report Common SizeFinancial Annual Report Common Size
Financial Annual Report Common Size
 
Tata Motors Ratio Analysis
Tata Motors Ratio AnalysisTata Motors Ratio Analysis
Tata Motors Ratio Analysis
 
CF Project
CF ProjectCF Project
CF Project
 
Data length of stayagesexprincipal payer total chgesrt chgeimaging
Data length of stayagesexprincipal payer total chgesrt chgeimaging Data length of stayagesexprincipal payer total chgesrt chgeimaging
Data length of stayagesexprincipal payer total chgesrt chgeimaging
 
Tata Motors – Ratio Analysis
Tata Motors – Ratio AnalysisTata Motors – Ratio Analysis
Tata Motors – Ratio Analysis
 
ABD Update
ABD UpdateABD Update
ABD Update
 

Similaire à Conta minjangos

alltel 2Q06_Supplement
alltel  2Q06_Supplementalltel  2Q06_Supplement
alltel 2Q06_Supplementfinance27
 
Financials for a Takeaway Outlet
Financials for a Takeaway OutletFinancials for a Takeaway Outlet
Financials for a Takeaway OutletBabar Malik
 
Financials for a Restaurant
Financials for a RestaurantFinancials for a Restaurant
Financials for a RestaurantBabar Malik
 
alltel 4Q 04_Supplemental
alltel  4Q 04_Supplementalalltel  4Q 04_Supplemental
alltel 4Q 04_Supplementalfinance27
 
alltel 4Q04_Supplemental
alltel  4Q04_Supplementalalltel  4Q04_Supplemental
alltel 4Q04_Supplementalfinance27
 
alltel 4Q04_Supplemental
alltel  4Q04_Supplementalalltel  4Q04_Supplemental
alltel 4Q04_Supplementalfinance27
 
Swifton CFOs LLC - Boston BizSpark presentation - Financial Projections for I...
Swifton CFOs LLC - Boston BizSpark presentation - Financial Projections for I...Swifton CFOs LLC - Boston BizSpark presentation - Financial Projections for I...
Swifton CFOs LLC - Boston BizSpark presentation - Financial Projections for I...David Fogel
 
Erin Parker Atvidcf V1
Erin Parker Atvidcf V1Erin Parker Atvidcf V1
Erin Parker Atvidcf V1Caneskid05
 
Swifton - The Capital Network - Financial Projections
Swifton - The Capital Network - Financial ProjectionsSwifton - The Capital Network - Financial Projections
Swifton - The Capital Network - Financial ProjectionsDavid Fogel
 
Swifton CFOs - McCarter English - Fin Proj 100511
Swifton CFOs - McCarter English - Fin Proj 100511Swifton CFOs - McCarter English - Fin Proj 100511
Swifton CFOs - McCarter English - Fin Proj 100511David Fogel
 
alltel 4Q04_Supplemental
alltel  4Q04_Supplementalalltel  4Q04_Supplemental
alltel 4Q04_Supplementalfinance27
 
alltel 4Q04_Supplemental
alltel  4Q04_Supplementalalltel  4Q04_Supplemental
alltel 4Q04_Supplementalfinance27
 
alltel 4Q04_Supplemental
alltel  4Q04_Supplementalalltel  4Q04_Supplemental
alltel 4Q04_Supplementalfinance27
 
alltel 4Q 04_Supplemental
alltel  4Q 04_Supplementalalltel  4Q 04_Supplemental
alltel 4Q 04_Supplementalfinance27
 
alltel 4Q04_Supplemental
alltel  4Q04_Supplementalalltel  4Q04_Supplemental
alltel 4Q04_Supplementalfinance27
 
alltel 4Q04_Supplemental
alltel  4Q04_Supplementalalltel  4Q04_Supplemental
alltel 4Q04_Supplementalfinance27
 
alltel 4Q04_Supplemental
alltel  4Q04_Supplementalalltel  4Q04_Supplemental
alltel 4Q04_Supplementalfinance27
 

Similaire à Conta minjangos (20)

alltel 2Q06_Supplement
alltel  2Q06_Supplementalltel  2Q06_Supplement
alltel 2Q06_Supplement
 
Eden Grove Hotel Projections
Eden Grove Hotel ProjectionsEden Grove Hotel Projections
Eden Grove Hotel Projections
 
Financials for a Takeaway Outlet
Financials for a Takeaway OutletFinancials for a Takeaway Outlet
Financials for a Takeaway Outlet
 
Financials for a Restaurant
Financials for a RestaurantFinancials for a Restaurant
Financials for a Restaurant
 
alltel 4Q 04_Supplemental
alltel  4Q 04_Supplementalalltel  4Q 04_Supplemental
alltel 4Q 04_Supplemental
 
alltel 4Q04_Supplemental
alltel  4Q04_Supplementalalltel  4Q04_Supplemental
alltel 4Q04_Supplemental
 
alltel 4Q04_Supplemental
alltel  4Q04_Supplementalalltel  4Q04_Supplemental
alltel 4Q04_Supplemental
 
Wmt Model Template
Wmt Model TemplateWmt Model Template
Wmt Model Template
 
Swifton CFOs LLC - Boston BizSpark presentation - Financial Projections for I...
Swifton CFOs LLC - Boston BizSpark presentation - Financial Projections for I...Swifton CFOs LLC - Boston BizSpark presentation - Financial Projections for I...
Swifton CFOs LLC - Boston BizSpark presentation - Financial Projections for I...
 
Erin Parker Atvidcf V1
Erin Parker Atvidcf V1Erin Parker Atvidcf V1
Erin Parker Atvidcf V1
 
Swifton - The Capital Network - Financial Projections
Swifton - The Capital Network - Financial ProjectionsSwifton - The Capital Network - Financial Projections
Swifton - The Capital Network - Financial Projections
 
Swifton CFOs - McCarter English - Fin Proj 100511
Swifton CFOs - McCarter English - Fin Proj 100511Swifton CFOs - McCarter English - Fin Proj 100511
Swifton CFOs - McCarter English - Fin Proj 100511
 
Anexo 2
Anexo 2Anexo 2
Anexo 2
 
alltel 4Q04_Supplemental
alltel  4Q04_Supplementalalltel  4Q04_Supplemental
alltel 4Q04_Supplemental
 
alltel 4Q04_Supplemental
alltel  4Q04_Supplementalalltel  4Q04_Supplemental
alltel 4Q04_Supplemental
 
alltel 4Q04_Supplemental
alltel  4Q04_Supplementalalltel  4Q04_Supplemental
alltel 4Q04_Supplemental
 
alltel 4Q 04_Supplemental
alltel  4Q 04_Supplementalalltel  4Q 04_Supplemental
alltel 4Q 04_Supplemental
 
alltel 4Q04_Supplemental
alltel  4Q04_Supplementalalltel  4Q04_Supplemental
alltel 4Q04_Supplemental
 
alltel 4Q04_Supplemental
alltel  4Q04_Supplementalalltel  4Q04_Supplemental
alltel 4Q04_Supplemental
 
alltel 4Q04_Supplemental
alltel  4Q04_Supplementalalltel  4Q04_Supplemental
alltel 4Q04_Supplemental
 

Plus de Daucus

Depreciacion de equipo operativo
Depreciacion de equipo operativoDepreciacion de equipo operativo
Depreciacion de equipo operativoDaucus
 
Conta minjangos
Conta minjangosConta minjangos
Conta minjangosDaucus
 
Elaboracion y comercializacion de productos saludables daucus
Elaboracion y comercializacion de productos saludables daucusElaboracion y comercializacion de productos saludables daucus
Elaboracion y comercializacion de productos saludables daucusDaucus
 
Estudio administrativo
Estudio administrativoEstudio administrativo
Estudio administrativoDaucus
 
Estudio tecnico
Estudio tecnicoEstudio tecnico
Estudio tecnicoDaucus
 
Estudio mercadológico
Estudio mercadológicoEstudio mercadológico
Estudio mercadológicoDaucus
 
Estudio mercadológico
Estudio mercadológicoEstudio mercadológico
Estudio mercadológicoDaucus
 

Plus de Daucus (7)

Depreciacion de equipo operativo
Depreciacion de equipo operativoDepreciacion de equipo operativo
Depreciacion de equipo operativo
 
Conta minjangos
Conta minjangosConta minjangos
Conta minjangos
 
Elaboracion y comercializacion de productos saludables daucus
Elaboracion y comercializacion de productos saludables daucusElaboracion y comercializacion de productos saludables daucus
Elaboracion y comercializacion de productos saludables daucus
 
Estudio administrativo
Estudio administrativoEstudio administrativo
Estudio administrativo
 
Estudio tecnico
Estudio tecnicoEstudio tecnico
Estudio tecnico
 
Estudio mercadológico
Estudio mercadológicoEstudio mercadológico
Estudio mercadológico
 
Estudio mercadológico
Estudio mercadológicoEstudio mercadológico
Estudio mercadológico
 

Conta minjangos

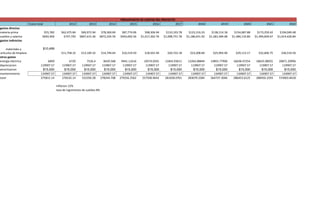
  • 1. PRESUPUESTO DE COSTOS DEL PROYECTO Costo total 2012 2013 2014 2015 2016 2017 2018 2019 2020 2021 2022 gastos directos materia prima $55,782 $62,475.84 $69,972.94 $78,369.69 $87,774.06 $98,306.94 $110,103.78 $123,316.23 $138,114.18 $154,687.88 $173,250.42 $194,040.48 sueldos y salarios $692,400 $747,792 $807,615.36 $872,224.59 $942,002.56 $1,017,362.76 $1,098,751.78 $1,186,651.92 $1,281,584.08 $1,384,110.80 $1,494,839.67 $1,614,426.84 gastos indirectos materiales y $10,499 articulos de limpieza $11,758.32 $13,169.32 $14,749.64 $16,519.59 $18,501.94 $20,722.18 $23,208.84 $25,993.90 $29,113.17 $32,606.75 $36,519.56 otros gastos energia electrica 6000 6720 7526.4 8429.568 9441.11616 10574.0501 11842.93611 13264.08844 14855.77906 16638.47254 18635.08925 20871.29996 depreciacion 119907.57 119907.57 119907.57 119907.57 119907.57 119907.57 119907.57 119907.57 119907.57 119907.57 119907.57 119907.57 amortizacion $15,000 $15,000 $15,000 $15,000 $15,000 $15,000 $15,000 $15,000 $15,000 $15,000 $15,000 $15,000 mantenimiento 134907.57 134907.57 134907.57 134907.57 134907.57 134907.57 134907.57 134907.57 134907.57 134907.57 134907.57 134907.57 total 275815.14 276535.14 552350.28 278244.708 279256.2562 557500.9642 281658.0761 283079.2284 564737.3046 286453.6125 288450.2293 574903.8418 inflacion 12% tasa de ingremento de sueldos 8%
  • 2. PRESUPUESTO DE GASTOS DE ADMINISTRACIÓN 2012 2013 2014 2015 2016 2017 2018 2019 2020 2021 2022 Sueldos y salarios 302400 338688 343042.56 384207.667 430312.587 481950.098 539784.109 604558.203 677105.187 758357.809 849360.746 telefono 12000 13440 15052.8 16859.136 18882.2323 21148.1002 23685.8722 26528.1769 29711.5581 33276.9451 37270.1785 Depreciación $2,611.15 $2,611.15 $2,611.15 $2,611.15 $2,611.15 $2,611.15 $2,611.15 $2,611.15 $2,611.15 $2,611.15 $2,611.15 Amortización $1,800 $1,800 $1,800 $1,800 $1,800 $1,800 $1,800 $1,800 $1,800 $1,800 $1,800 Mantenimiento $10,000 $11,200 $12,544.00 $14,049.28 $15,735.19 $17,623.42 $19,738.23 $22,106.81 $24,759.63 $27,730.79 $31,058.48 Gastos de oficina $1,302.00 $1,458.24 $1,633.23 $1,829.22 $2,048.72 $2,294.57 $2,569.92 $2,878.31 $3,223.70 $3,610.55 $4,043.81 Otros gastos 29546.5 33092.08 37063.1296 41510.7052 46491.9898 52071.0285 58319.552 65317.8982 73156.046 81934.7715 91766.9441 Totales 359659.65 402289.47 413746.868 462867.155 517881.875 579498.362 648508.828 725800.549 812367.277 909322.012 1017911.32 inflacion 12% incremento del sueldo y salario 8%
  • 3. gastos de venta y de distribucion 2012 2013 2014 2015 2016 2017 2018 2019 2020 2021 2022 Sueldos y salarios 372000 401760 433900.8 468613 506101.9 546590 590317.25 637542.63 688546.038 743629.7213 803120.099 Teléfono 12000 13440 15052.8 16859.1 18882.23 21148.1 23685.872 26528.177 29711.5581 33276.94509 37270.1785 Depreciación $7,200 $7,200 $7,200 $7,200 $7,200 $7,200 $7,200 $7,200 $7,200 $7,200 $7,200 Impuestos Mantenimiento 6000 6720 7526.4 8429.57 9441.116 10574.05 11842.936 13264.088 14855.7791 16638.47254 18635.08925 Combustibles y gastos de vehículos 31200 34944 39137.28 43833.8 49093.8 54985.06 61583.268 68973.26 77250.0511 86520.05723 96902.4641 Totales 428400 464064 502817.3 544935 590719 640497.3 694629.32 753508.15 817563.426 887265.1961 963127.8308 inflacion 12% incremento del sueldo y salario 8%
  • 4. ESTADO DE RESULTADOS año 2012 2013 2014 2015 2016 2017 2018 2019 2020 2021 2022 ventas $2,160,000 $ 2,661,120.00 3273534 4032131.4 4965055.92 6113818.06 7528799.94 9270826.73 11415324.26 14057140.95 18360867.08 (-) costos de produccion 874164 979063.68 1096551.322 1228137.48 1375513.978 1540575.655 1725444.734 1932498.102 2164397.874 2424125.619 2715020.693 utilidad bruta $1,285,836 $ 1,682,056.32 2176982.678 2803993.92 3589541.942 4573242.405 5803355.206 7338328.628 9250926.386 11633015.33 15645846.39 (-) gastos de administracion 359659.65 402289.47 413746.87 462867.15 517881.88 579498.36 648508.83 725800.55 812367.28 909322.01 1017911.3 (-) gastos de venta 428400 464064 502817.28 544935.32 590719.05 640497.26 694629.32 753508.15 817563.43 887265.2 963127.83 utilidad de $ operación $497,776 815,702.85 1260418.528 1796191.45 2581739.472 3353246.785 4460217.056 5859019.928 7620995.676 9836428.121 9836428.121 gastos financieros utilidad antes ISR y PTU $487,776 815702.85 1260418.528 1796191.45 2581739.472 3353246.785 4460217.056 5859019.928 7620995.676 9836428.121 9836428.121 (-) ISR y PTU (35% +10%) $219,499.20 367066.2825 567188.3376 808286.1525 1161782.762 1508961.053 2007097.675 2636558.968 3429448.054 4426392.654 4426392.654 utilidad neta $268,276.80 448636.5675 693230.1904 987905.2975 1419956.71 1844285.732 2453119.381 3222460.96 4191547.622 5410035.467 5410035.467 (+) depresiacion y amortizacion $14,388.91 $14,388.91 $14,388.91 $14,388.91 $14,388.91 $14,388.91 $14,388.91 $14,388.91 $14,388.91 $14,388.91 $14,388.91 flujos de caja $282,665.71 $463,025.48 $707,619.10 $1,002,294.21 $1,434,345.62 $1,858,674.64 $2,467,508.29 $3,236,849.87 $4,205,936.53 $5,424,424.38 $5,424,424.38 inflacion 12%
  • 5. BALANCE GENERAL ACTIVOS PASIVO Circulante cajas y bancos 1 $185,863 Total $185,863 credito a banmujer $150,000 Fijos CAPITAL CONTABLE Maquinaria equipo 23,148.00 Aportaciones de los socios $98,011 Equipo de oficina 21759.57 Equipo de venta y dist. 60,000 Total 83,148.00 Diferidos Licencias y permisos 15,000 Total 15,000 Sumas del activo $284,011 Suma pasivo mas capital $248,011 Se considero el equivalente a dos meses de costos de producción y gastos de operación y ventas. Costos de venta anual 275815.14 Gastos de administración 359659.65 Gastos de venta 428400 Total $ 1,063,877.79 Mensual 88,656.48 Importe de dos meses 177,312.97 Imprevistos 8550 Total 185,862.97