Social Conversations and Digital Review Q1 2011
•
2 j'aime•1,072 vues

Now that Q1 2011 is all wrapped up, what are we learning about social media so far this year? What are the early trends and where are the social conversations happening?

Recommandé
Recommandé
Contenu connexe
Tendances
Tendances (10)
En vedette
En vedette (20)
Similaire à Social Conversations and Digital Review Q1 2011
Similaire à Social Conversations and Digital Review Q1 2011 (20)
Dernier
Dernier (20)
Social Conversations and Digital Review Q1 2011
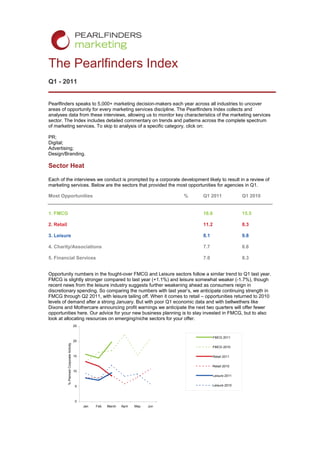
- 1. The Pearlfinders Index Q1 - 2011 Pearlfinders speaks to 5,000+ marketing decision-makers each year across all industries to uncover areas of opportunity for every marketing services discipline. The Pearlfinders Index collects and analyses data from these interviews, allowing us to monitor key characteristics of the marketing services sector. The Index includes detailed commentary on trends and patterns across the complete spectrum of marketing services. To skip to analysis of a specific category, click on: PR; Digital; Advertising; Design/Branding. Sector Heat Each of the interviews we conduct is prompted by a corporate development likely to result in a review of marketing services. Below are the sectors that provided the most opportunities for agencies in Q1. Most Opportunities % Q1 2011 Q1 2010 1. FMCG 16.6 15.5 2. Retail 11.2 8.3 3. Leisure 8.1 9.8 4. Charity/Associations 7.7 8.6 5. Financial Services 7.0 8.3 Opportunity numbers in the fought-over FMCG and Leisure sectors follow a similar trend to Q1 last year. FMCG is slightly stronger compared to last year (+1.1%) and leisure somewhat weaker (-1.7%), though recent news from the leisure industry suggests further weakening ahead as consumers reign in discretionary spending. So comparing the numbers with last year’s, we anticipate continuing strength in FMCG through Q2 2011, with leisure tailing off. When it comes to retail – opportunities returned to 2010 levels of demand after a strong January. But with poor Q1 economic data and with bellwethers like Dixons and Mothercare announcing profit warnings we anticipate the next two quarters will offer fewer opportunities here. Our advice for your new business planning is to stay invested in FMCG, but to also look at allocating resources on emerging/niche sectors for your offer. 25 FMCG 2011 20 % Planned Corporate Activity FMCG 2010 15 Retail 2011 Retail 2010 10 Leisure 2011 5 Leisure 2010 0 Jan Feb March April May Jun
- 2. Desirable Discipline During Q1, we tracked the number of times marketing decision-makers said that they were considering a particular service category. Pearlfinders clients span the marketing spectrum so this data is entirely discipline neutral and without bias during interviews. Most Likely To Engage Marketing Support % Q1 2011 Q1 2010 1. Digital 17.2 13.3 2. Consumer PR 12.6 13.3 3. Corporate PR 11.7 9.1 4. Advertising 8.8 6.6 5. Social Media 8.5 6.2 Last year, digital agencies lost ground to advertising, integrated and even consumer PR shops as each scaled up their own digital capabilities. Digital agencies have now reclaimed this ground in the minds of many marketers. Increasingly, budget-holders are prioritising projects with more rapid ROI such as ecommerce, display, smartphone optimisation and search. During Q1 2011 we have seen a steady increase in opportunities making it the most popular discipline. Consumer and corporate PR activity throughout the first three months of 2011 has followed a broadly similar pattern to that experienced in 2010. We now expect consumer PR work to experience a gentle increase in opportunities moving into Q2, with corporate PR tailing off somewhat now that the end of many companies' financial years has been reached. 20 18 Digital 2011 16 Digital 2010 % Considering Category 14 12 Consumer PR 2011 10 Consumer PR 2010 8 6 Corporate PR 2011 4 Corporate PR 2010 2 0 Jan Feb March April May June
- 3. Trigger Happy The triggers we monitor in the media are the starting point for our research. These represent indicators for corporate developments and potential marketing challenges. Then by analysing the interviews we have with marketing decision-makers at these organisations, we are able to track which of the triggers yield the highest number of qualified new business opportunities. Best Triggers For New Business Opportunities % Q1 2011 Q1 2010 1. Marketing Decision-Maker Moves 31.5 26.6 2. NPD / Innovation 22.1 14.1 3. Restructuring / Growth 21.4 17.0 4. Agency Reviews 13.6 18.5 5. M&A 7.0 4.4 More and more agency opportunities are arising from innovation, new product launches and development, as the UK’s entrepreneurial spirit returns. Last year, this category of corporate development generated the greatest demand for marketing services in Q4 (29.3%), having grown throughout the year. We anticipate NPD/innovation will continue to deliver one in five of all agency briefs, and the tax breaks for small businesses in this year's Budget could even boost this. 45 40 DMM 2011 35 DMM 2010 30 NPD/Innovation 2011 % Triggers 25 20 NPD/Innovation 2010 15 Restructuring/growth 2011 10 Restructuring/growth 2010 5 0 Jan Feb March April May June
- 4. Top Sectors for Marketing Decision-Maker Job Moves After the annual peak in appointments and role changes that accompanies the New Year, marketing decision-maker job moves have tailed off. We expect this to level out in Q2 as budgets for the new financial year are announced and allocated. Last year, the public sector was one of the top destinations for new marketing budget holders, but now it only accounts for 3% of appointments. Government cuts have had the opposite impact on the third sector. It is now essential for charities to have the best fundraisers and marketers to plug the gap with corporate funding, while associations representing the financial sector have also been bolstering their marketing and comms teams. Q1 2011 Q1 2010 1. Charity / Associations 1. Financial Services 2. Financial Services 2. FMCG 3. FMCG 3. Charity / Associations 4. Retail 4. Public Sector 5. Media 5. Leisure Target Audience For brands looking to reach specific consumer audiences there were three dominant demographic categories. Consumer audiences were the main focus within 78% of our interviews. Top 3 B2C Audiences % Q1 2011 Q1 2010 1. Male 24.3 16.8 2. ABC1 19.1 19.9 3. Female 16.5 11.2 Of the marketers we spoke to, 21.8% were focusing on B2B marketing in Q1, with the three sectors below providing the most B2B marketing opportunities. Top 3 Sectors Investing in B2B Marcoms % Q1 2011 Q1 2010 1. Industry / Manufacturing 20.5 16.3 2. Professional Services 20.5 10.2 3. Financial Services 13.6 9.2
- 5. Feeling Positive We asked senior decision-makers we spoke to in Q1 how positive they were feeling about the business environment. In the past we've used this to give us a sense for which marketing teams are getting the green light for new projects and securing budgets. We used a score where '1' is most positive and '10' the least. Most Positive Sectors Q1 2011 1. Apparel 2.5 2. eCommerce 2.6 3. Pharma / Healthcare 2.8 4.Telecoms 3.0 5. Retail 3.0 Month 2010 2011 March March June Sept April May July Nov Dec Aug Feb Jan Oct 1 2 Apparel Average Positivity eCommerce 3 Pharma/Healthcare 4 5
- 6. Customer Objective We gathered data on companies' primary customer marketing objectives. Primary Objective Q1 2011 Q1 2010 1. Acquisition 65.3 68.4 2. Retention 16.8 11.3 3. Development 17.9 20.3 80 70 Acquisition 2011 60 Acquisition 2010 50 Retention 2011 40 % Retention 2010 30 Development 2011 Development 2010 20 10 0 Jan Feb March April May June July Aug Sept Oct Nov Dec With acquisition and development priorities appearing constant when compared to this time last year, the focus for marketers this quarter has been on retaining customers. What's apparent in times of uncertain budgets is that repeat custom proves the most cost-effective way of driving revenues. National Or Regional Where marketing decision-makers specified a need for agencies of a particular size or geographical reach, we tracked the trend. Agency Size / Geographical Reach Q1 2011 Q1 2010 1. National 60.6 50.8 2. Regional / Niche 39.4 49.2 While there has been a noticeable shift towards agencies with national capabilities since last year, this can be attributed to the increase in larger brands conducting agency reviews. These brands are not seeking the services of pitch or search and selection consultants however. In Q1 2010 8.1% of reviews we researched involved search and selection consultants, but so far this year just 3% have taken this approach. One of the lessons larger brands appear to have taken from the recession is to aim to achieve as much as possible through internal resources, particularly for areas where external advice isn't absolutely necessary. Agency reviews are evidently falling into this category.
- 7. Q1 2011 Index: PR Highlights • PR was consistently the most popular discipline throughout the last 12 months, featuring in 40% of all conversations in Q1 2011. • Of the 337 PR-specific opportunities we profiled, only 29 arose from press-reported scheduled PR reviews. • For the first time in 12 months, consumer PR is no longer the most planned-for marketing discipline in the mix, second to digital. • Corporate and B2B comms activity is picking up: this quarter, 26% of PR opportunities were targeting a B2B audience, where the figure was 23% last year. Sector activity The largest incidence of PR opportunities was in the FMCG industry (56), followed by Retail (40) then Charity/Associations (38). While FMCG remains the most fertile sector, all three are levelling after the first half of 2010, when uncertainty over market conditions fuelled both consumer and corporate PR efforts, while charities and associations cut their spend. Looking forward, we have found decision- makers are predicting comms projects that had been on hold will restart. 18 16 14 FMCG % PR Opportunities 12 10 Retail 8 6 4 Charity/Associations 2 0 Q1 Q2 Q3 Q4 Q1 For Leisure and Retail industries, meanwhile, a lift is expected from the upcoming bank holiday season. Brands ranging from Marston's and Domino's Pizza to Stanley Gibbons and ITN spoke about leveraging the royal wedding for a fresh marketing push. Looking more closely at both sectors compared to the first quarter of 2010, as an indication of activity in the market, an initial dip after the New Year will reverse as investment in PR returns during the summer months. We predict the retail sector will see an increased demand for corporate PR as the stronger players look to reassure investors they can continue to deliver dividends as others in the sector deliver profit warnings. 14 12 Leisure 2011 10 % PR Opportunities Leisure 2010 8 6 Retail 2011 4 Retail 2010 2 0 Jan Feb March April May June
- 8. Online PR now central to restructuring and mergers The return of more mergers, acquisitions and corporate restructuring activity to the corporate landscape generated a surge in PR opportunities this quarter. Its most notable impact was on online PR and social media, which had 30 opportunities for agency involvement as a result of M&A or corporate restructuring in Q1, compared to just 11 in the same period last year. While the role of online PR in B2C marcoms and even corporate business development and sales has been well documented, its central role in supporting M&A and corporate restructuring is now evident. When BSM was acquired by the AA, it was the AA’s social media expert that led the brand strategy. Brit Insurance is planning to use inbound investment from its new owners to drive recruitment, again via social media. Morrisons' strategy to build an online offering through acquisitions has naturally been accompanied by a greater focus on its broader perception online, again via social media channels. Products in place of props A fresh debate this quarter was the role of PR agencies in product placement. While media planning and creative agencies have been responsible for brokering the initial deals we’ve seen, we think there is scope for the PR industry to win work here. Broadcast PR and even prop placement specialists have long been cultivating relationships with TV channels and production companies to secure placement, but going forward, we see an opportunity for PR experts to feed into strategy. We anticipate openings with companies looking to craft specific narratives around their brands across multiple media outlets. Listening, not broadcasting While the last two years saw a social media bandwagon that compelled brands to build a presence to keep up with competitors, in 2011 many consumer brands stopped to take stock. The response has been to reinstate a more traditional perspective – shifting priorities from branded portals and broadcasting messages, to media monitoring, data mining and customer service. In conversations about social media, more than twice as many decision-makers this quarter mentioned a broader traditional approach, compared to Q1 2010. What this will mean for the coming year is a greater proportion of integrated briefs incorporating social media, while for PR departments the remit is to be more responsive – the emphasis online has moved from being proactive to reactive. At video game publisher Ubisoft, for example, we were told "customer understanding" is at the heart of a new overarching strategy.
- 9. Q1 2011 Index: Digital Highlights • A third (32.7%) of marketing budget holders we spoke to were evaluating digital or social media support in Q1. • Figures indicate a steady rise – throughout 2010, the average figure was 27%. • Among digital opportunities, 35% of decision-makers also spoke about mobile. A year ago, the figure was just 23%. • 12% of decision-makers mentioned social commerce as a priority. Last quarter, the figure was 8%. • In new product launches, 55% of marketers planned to invest specifically in digital channels. Active sectors The top three industries investing in digital this quarter were FMCG (43), followed by Retail (41), then Charities / Associations (25). Mapping the incidence of digital opportunities this year against the first half of 2010, it's clear there's steady investment from brands over the same period. 25 20 FMCG % Digital Opportunities 15 Retail 10 5 Charity/Associations 0 Q1 Q2 Q3 Q4 Q1 Disciplines within Digital As tablets and smartphones become the primary consumer touchpoints and the number of hours consumers spend on them rises, brands have increasingly turned to social media and mobile strategies to reach them - the appetite for agencies with mobile expertise has never been stronger. 25 Social media 20 Mobile % Digital Opportunities 15 e-commerce 10 Search 5 Web builds 0 Q1 Q2 Q3 Q4 Q1 The popularity of smartphones among older consumers has also been the catalyst for an increasing number of digital briefs targeting this group – four times as many in Q1 this year than last. However, many budget holders are unsure where to focus their resources, citing the importance of "getting it right first time". Meaningful user behaviour and platform optimisation insights remain scarce
- 10. for tablets and are in great demand among budget holders grappling with translating both content and revenue structures to best effect on new platforms. The digital editor of The Telegraph, for one, told us commercial decisions have yet to be made on a tablet version, and the next few months will be a research phase. Across all industries, the number of decision-makers planning to invest in app development has increased steadily – but we found the terminology has changed. There were no mentions of "tablets" early last year, as decision-makers waited to gauge public response to the iPad. Mentions of augmented reality and QR codes more than doubled in Q1 2011 compared to the same period in 2010, again driven by the potential smartphones and tablets offer. Geolocal Marketplace Set to Explode While one of the big talking points last year was geo-location, and how marketers could establish an initiative that's relevant to their brand, this year we are already seeing the topic shoot up the priority list. It seems inevitable that this will accelerate through the year following major announcements this month on Facebook Places, Google Latitude and Twitter's new dashboard functionality. Facebook clearly expects to change the marketing landscape with the launch of Places Deals and brands anticipating this move contributed to the spike in conversations about Facebook this quarter. It has also, in the UK at least, taken the wind out of Foursquare’s sails and marginalised the platform in marketers' minds. 60 50 Facebook Twitter % Social Media Conversation 40 Linkedin YouTube 30 Foursquare Myspace 20 10 0 Q1 Q2 Q3 Q4 Q1 Q2 Q3 Q4 Q1 2009 2010 2011 Twitter is taking a different approach by rolling out a dashboard that lets marketers access data about their followers. The available metrics include whether more male or female followers are retweeting a brand’s messages and what percentage of followers are in different countries and states. It will be some time before advertisers commit serious marketing resources to either platform, but the desire is there. Truly indispensible digital agencies will be those getting involved at the research and development stage rather than simply implementation.
- 11. Q1 2011 Index: Advertising Highlights • There were over twice as many advertising briefs in Q1 2011 than Q1 2010. • 14% of marketing budget holders we interviewed were evaluating advertising support. • 25.9% of opportunities came from scheduled reviews (+4.8% on Q4 2010 but half the level of Q1 2010). • New marketing decision-makers still generate 14.7% of advertising opportunities, but this is 10% less than in 2010. • The most popular target demographic was men. 31.5% of advertising briefs were tailored to this group. • While other marketing disciplines have seen a drop in briefs targeting ABC1 audiences, advertising saw a boost +7.8% on the previous quarter and is +8.3% on Q1 2010. • Advertising budgets are once again being siphoned off for digital projects. Advertising is now the fourth most sought after marketing discipline while digital is seeing sustained growth. Active Sectors The top three industries investing in advertising this quarter were FMCG (26), followed by Retail (12), then Leisure (11). While FMCG and retail have steadily contributed more advertising opportunities over the last 15 months, the leisure sector has been providing fewer opportunities for the last two consecutive quarters. 30 FMCG 25 % Advertising Opportunities 20 Retail 15 10 Leisure 5 0 Q1 Q2 Q3 Q4 Q1 Digital predictions Mobile display ad spend was predicted to rise five-fold in Europe in 2011, and in its first quarter we found 16% of conversations about advertising also brought mobile into the equation. We found that four times as many agency reviews in Q1 2011 touched on both advertising and digital (43) than in the same period in 2010, when only 10 decision-makers were evaluating the two disciplines together. It remains to be seen whether this steep rise will continue, but for ad agencies, an understanding of both fields will ensure you're more likely to be included in planning mobile campaigns rather than simply providing creative for digital shops to adapt. Getting to grips with placement The single biggest event in terms of advertising legislation this quarter was the legalisation of UK product placement. Hailed as a solution to the TV viewer's tendency to fast-forward ads, marketers are now reading up on regulations to understand what's possible, and what could benefit the brand. Analysts predicted that brand owners would fear a consumer backlash – but brands we spoke to said this fear stems not from the public but from within the marketing industry itself.
- 12. As product placement strategy is integrated more broadly into creative campaigns, we think there is an opportunity for advertising agencies to get involved earlier with new products. While products developed for specific shows might be a step too far for many, we expect brands to turn increasingly to their incumbent to ensure NPD and even pack design is working in harmony with placement strategy. Kellogg's Marketing Services Director’s objection to product placement is the absence of introduction or explanation – the best agencies will address this by broadening involvement with all the marcoms channels being utilised.
- 13. Q1 2011 Index: Design and Branding Highlights • 12.4% of marketing budget holders we interviewed were reviewing design / branding support. • As a proportion of all briefs profiled this was down 4.2% on the previous quarter, but up 2.6% on Q1 last year (9.8%). • The most popular target demographic was men – 25% of design / branding briefs were tailored towards this group. • Design and branding for B2B brands has seen a solid increase on the previous quarter (+6.9%). • Briefs targeting ABC1 audiences (14.6%) are becoming increasingly scarce, contributing a smaller portion of opportunities each quarter for the last four (-11.7% on Q1 2010). Active Sectors Of the 109 design and branding specific briefs we profiled in Q1, the largest incidence was for the FMCG sector (25), followed by Retail and then Charity / Associations. Charities and associations saw the biggest increase on Q4 for design and branding opportunities (+6.6%). 35 30 % Design & Branding Opportunities FMCG 25 20 Retail 15 10 5 Charity/Associations 0 Q1 Q2 Q3 Q4 Q1 Pack design There were nearly twice as many packaging design opportunities in Q1 2011 (43) compared with 2010 (27) as brands seek to address current consumer, retailer and internal expectations. Greener packaging is expected as standard, although further redesigns have been required following health risks from mineral oils in recycled card. Supermarkets are increasingly prescriptive on pack format, driving demand for greater creativity to achieve standout. Cost cutting has also led to opportunities for pack design as brands look to use less packaging and cheaper materials. 29.7% of opportunities came from NPD and innovation, more than doubling over the last 12 months from 12.3% Q1 2010. Looking to the future, we expect each of these trends to remain on budget-holders’ priority lists.
- 14. Online budget allocation Having tracked opportunities for all marketing disciplines over the last 15 months we can plot the following graph to compare demand for digital vs. design and branding expertise. 20 18 Digital 16 Design/Branding 14 % Considering Category 12 Linear 10 (Design/Branding) 8 Linear (Digital) 6 4 2 0 Jan Feb March April May June July Aug Sept Oct Nov Dec Jan Feb March 2010 Month 2011 The two disciplines followed a similar trajectory in the first quarter of 2010, but have since settled into a pattern of competition. A peak in opportunities for design shops corresponds very closely with the months where digital is less dominant and vice versa. Looking at the trend lines it is clear that there is confusion among budget holders when it comes to allocating resources to online projects. While it is rare to come up against a digital agency when pitching for a major design brief, it is the ongoing development and creation of content and branded material online where the lines are blurred. As brands’ demand for dynamic, rich content steadily rises, costs need to be managed, and there is often a temptation to opt for a commoditised solution from the retained digital agency. We think design shops are missing out on this longer-term source of repeat business, and can make a strong case for greater involvement in content creation. Smaller design shops also need to be assertive about their digital capabilities and successes from the outset, reassuring marketers of your ability to provide a solution that fully addresses the challenges attached to multiplatform brand activity. In other words, making the business case for design leading the way rather than technical expertise.