1. Trading the GARTLEY 222
Sometimes old trading ideas are the best ideas —
if you can quantify them with modern analysis and
testing procedures. Here, a "classic" chart pattern
is defined mathematically and tested to see if it can
produce profits.
BY AARON BEHLE AND MARK CONWAY
s an increasingly challenging market has weeded
out traders over the past few years, many sur-
vivors in search of an edge are revisiting the
works of the original technical analysis masters,
including Richard Schabacker, J.M. Hurst, W.D. Gann and
Harold M. Gartley.
Gartley wrote Profits in the Stock Market in 1935, and what
makes the book striking is not that it shows how much techni-
cal analysis has advanced since then, but rather, how little it
has changed. In many cases, "modern"
patterns with catchy names are simply
rehashes of price behavior observed long
ago by people like Gartley.
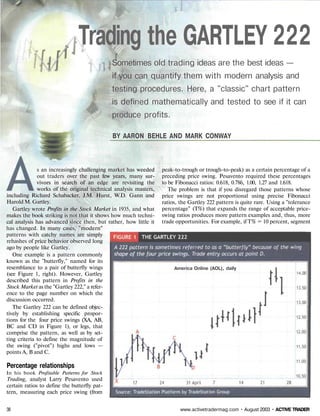
One example is a pattern commonly
known as the "butterfly," named for its
resemblance to a pair of butterfly wings
(see Figure 1, right). However, Gartley
described this pattern in Profits in the
Stock Market as the "Gartley 222," a refer-
ence to the page number on which the
discussion occurred.
The Gartley 222 can be defined objec-
tively by establishing specific propor-
tions for the four price swings (XA, AB,
ВС and CD in Figure 1), or legs, that
comprise the pattern, as well as by set-
ting criteria to define the magnitude of
the swing ("pivot") highs and lows —
points А, В and C.
Percentage relationships
In his book Profitable Patterns for Stock
Trading, analyst Larry Pesavento used
certain ratios to define the butterfly pat-
tern, measuring each price swing (from
peak-to-trough or trough-to-peak) as a certain percentage of a
preceding price swing. Pesavento required these percentages
to be Fibonacci ratios: 0.618, 0.786, 1.00, 1.27 and 1.618.
The problem is that if you disregard those patterns whose
price swings are not proportional using precise Fibonacci
ratios, the Gartley 222 pattern is quite rare. Using a "tolerance
percentage" (T%) that expands the range of acceptable price-
swing ratios produces more pattern examples and, thus, more
trade opportunities. For example, if T% = 10 percent, segment
America Online (AOL), daily
38 www.activetradermag.com • August 2003 • ACTIVE TRADER
2. AB (the second price swing) can be
between 51.8 percent and 71.8 percent of
segment XA (the first price swing),
rather than exactly 61.8 percent.
Another criterion that can be applied
to the pattern is the "strength" of the
pivot points. For example, a pivot high
has a strength of 3 when the three bars
preceding the high and the three succeed-
ing it are all lower than the high; a pivot
high with four preceding and succeeding
lower highs would have a strength of 4.
Each pivot in the 222 pattern must meet
this strength requirement. As the pivot
strength increases, so does the length of
the pattern and the likely duration of a
trade based on it. However, the higher
the pivot strength, the fewer patterns that
will qualify for trading, and the longer
those patterns will be.
Pivot strength can also be measured in
percentage terms — e.g., a 2-percent
swing from peak to trough on a 60-
minute chart, or a 10 percent swing on a
daily chart. These parameters should be
appropriate to the time frame; price moves on an intraday chart
will be proportionally smaller than those on daily or weekly
charts. (With all these criteria, finding the pattern by scanning
charts is difficult, at best. Accordingly, code for defining the pat-
tern in both the TradeStation and Wealth-Lab analysis pro-
grams can be found at www.activetradermag.com/code.htm.)
Using objective criteria for defining price patterns allows
you to build a consistent strategy for trading them. We will use
specific Gartley 222 pattern parameters to enter both long and
short trades on different time frames. Back-testing on the
Nasdaq 100 stocks over the past several years will provide an
indication of the strategy's potential.
Defining the swing relationships
In Figure 1, which shows a bullish 222 pattern, low X to high A
defines segment XA; high A to low В defines segment AB, and
so on. The first thing to determine is how the size of these price
swings should relate to each other.
Low В retraces a certain percentage of high A, but is higher
than low X. Segment ВС is an even smaller retracement of high
A, but segment CD retraces all of segment ВС but is above low
X. Point D is the buy point.
To measure the retracements, we'll use the proportions
defined in Appendix I of Pesavento's book:
AB should be 61.8 percent of XA
ВС should be 61.8-78.6 percent of AB
CD should be 127.0-161.8 percent of ВС
AD should be 78.6 percent of XA
Figure 2 (above) shows a bearish 222 pattern, which resem-
bles the letter "W." Reversing the logic of the bullish pattern,
Morgan Stanley (MWD), daily
peak X to trough A defines the segment XA, trough A to peak
В defines the segment AB, etc.
High В retraces a percentage of trough A but is lower than
high X. Again, segment CD retraces all of segment ВС but does
not reach the point X high. Point D is the sell short point.
The pattern lines in Figure 2 are based on the following cri-
teria:
1. Pivot strength = 3
2. Maximum number of bars in pattern =100
3. T% = 10 percent
Gartley 222 strategy
A Gartley 222 setup should always have a minimum potential
reward/risk ratio of 2:1. This system uses a stop-loss at Point X
and a profit target equal to 61.8 percent of segment CD ("DT"
in the following calculations). The profit target for a bullish
butterfly will be equal to Point D + DT, and the short target for
a bearish butterfly will be D - DT.
The calculations used are:
XA = | X - A |
AB = | A - В |
BC= | B-C |
D = A - (0.786 * XA) for bullish butterfly
D = A + (0.786 * XA) for bearish butterfly
C D = | C - D |
AD = | A - D |
DT = 0.618 * CD
Tolerance = T%
continued on p. 40
ACTIVE TRADER • August 2003 • www.activetradermag.com 39
3. Entry rules
Bullish Gartley 222:
1. A > С and С > В and В > D and D > X
2. The pattern must be a trough-peak-trough-peak
sequence
3. AB / XA > 0.618 - T% and AB / XA < 0.618 + T%
4. ВС / AB > 0.618 - T% and ВС / AB > 0.786 + T%
5. Repeat for CD / ВС and AD / XA.
6. If the conditions above are true, then buy at price D with
a limit order.
Bearish Gartley 222:
1. A < С and С < В and В < D and
D<X
2. The pattern must be a peak-trough-
peak-trough sequence
3. AB / XA > 0.618 - T% and
AB / XA < 0.618 + T%
4. ВС / AB > 0.618 - T% and
ВС / AB > 0.786 + T%
5. Repeat for CD / ВС and AD / XA.
6. If the conditions above are true,
then sell short at price D with a
limit order.
Exit rules
Bullish Gartley 222:
1. Profit Target: D + DT
2. Stop Loss: X
Bearish Gartley:
1. Profit Target: D - DT
2. Stop Loss: X
Example 1
Figure 3 (left) is an example of a very
favorable reward/risk ratio for a Gartley
222 trade. The stock twice closed within
10 cents of the pattern high. A short trade
initiated at this level would have a profit
target of at least 60 cents with risk limit-
ed to 10 cents - a 6:1 reward/risk ratio.
Note the two different lines denoting
segment CD. In a bearish 222 pattern, D
is the price level at which to short — e.g.,
it is based on the high of a bar satisfying
the condition that segment CD retraces
at least 127 percent of segment BD. If this
condition is true, the pattern is drawn.
Now, suppose the next bar's high price
is lower, and that segment CD now
retraces only 125 percent of segment BD.
This is not a valid Gartley pattern and no
pattern is drawn. In this case, though, the
second bar did have a higher high, so a
new segment CD line is drawn. Although
the strategy calls for entry at point D on
the initial bar that completes the pattern,
it is useful to keep tracking subsequent
bars that fulfill the pattern criteria in the event you miss the first
opportunity and need a second chance to enter the trade.
However, if the next bar's high is higher and comes back
into the "Gartley range," the pattern will be drawn again.
These "multiple" patterns tend to develop when price is trad-
ing in a range. The T% has been loosened to 20 percent in this
case; the higher the tolerance, the more patterns that will occur.
Although this is a modified version of the Gartley setup, we
prefer to see all potential patterns as they take shape.
Varying the input parameters to reflect different swing pro-
portions and pivot strengths will identify different kinds of
Gartley setups. For example, higher pivot strengths will reveal
setups that are developing over longer time frames. A higher-
EMC Corp. (EMC), 60-minute
12/23 12/24 12/26 12/27 12/30 12/31 1/2
40 www.activetradermag.com • August 2003 • ACTIVE TRADER
4. strength pattern combined with a lower-strength pattern is a
powerful combination for trading these setups. In some situa-
tions, a lower-strength (shorter-term) pattern will form within a
higher-strength pattern, in which case you can enter a trade
based on the shorter-term pattern and have the potential to cap-
italize on the longer-term pattern.
Intraday setups
These patterns can also be traded on intraday charts. A Gartley
222 setup on a 60-minute chart is suitable for a swing trade
with an approximate holding period between one and three
days.
In Figure 4 (opposite page), the stock does not initially hit
the profit target, but pulls back to the
buy point. However, it stays above the
stop-loss point at the bottom of the chart
and, finally, the real move occurs two
days later.
Remember to adjust the pattern
parameters to your holding period. In
this case, the pivot strength was set to 5
and the pattern developed over seven
trading days. A trader may decide to
hold a position over the same period for
"time symmetry" - that is, sometimes
the moves that spring from a Gartley
setup are proportional to the original pat-
tern length (in time).
Figure 5 (left) is a good example of
time symmetry. The bullish setup devel-
ops over 16 trading days, and 16 days
later EBAY had gained more than six
points from the entry. Here, the stop-loss
amount is less than one point, so even if
you chose to exit the trade on the first up
move, the trade's reward/risk ratio was
at least 3:1.
As long as price stays in the zone
between the troughs, the pattern is valid
until price either breaks below the first
trough or moves above the second trough.
Some traders wait for a confirmation bar - a close above the open
or a close greater than the previous close. However, if the
reward/risk ratio is good, place a limit order close to the bottom
of the pattern and let the price action do the rest.
Figure 6 (below) shows another intraday (five-minute bars)
setup. Like the Figure 5 example, this pattern is time-symmet-
ric, and the high occurs around one hour later. Also, this setup
was based on a pivot strength of 4, and the pattern is 16 bars in
length — referred to as a "4x4" because of its perfect symme-
try and compact form.
Gartley 222 patterns can be traded on 1-, 2-, and 3- minute
charts. The only caveat regarding these time frames is to be
careful of a bullish setup that occurs after a run-up - you
continued on p. 42
Additional reading
Professional Stock Trading: System
Design and Automation
by Mark R. Conway and Aaron N.
Behle.
(2003, Acme Trader LLC, Waltham,
Mass.).
Profits in the Stock Market
by Harold M. Gartley
(1935, Lambert-Gann Publishing
Co., Pomeroy, Wash.).
Profitable Patterns for Stock
Trading
by Larry Pesavento
(1999, Traders Press Inc.,
Greenville, S.C.).
10:05 10:20 10:35 10:50 11:05 11:20 11:35 11:50 12:05 12:20 12:35
ACTIVE TRADER • August 2003 • www.activetradermag.com 41
5. 42
could be looking at an "M" top pattern.
Similarly, a bearish setup after a mid-day
correction may be a "W" bottom pattern.
Context is important for intraday pat-
terns, so keep an eye on the longer-term
time frames.
Test results
Table 1 (above) shows the back-testing
results for daily Gartley 222 setups using
the rules we defined earlier. The results
reflect 165 trades in 100 stocks. In all the
tests the profit factor (gross profit divided
by gross loss) was consistently in a range
of 1.4 to 1.5. These trades were not filtered
in terms of their reward/risk ratios (that
is, all setups were traded, not just those
above a favorable threshold, such as 3:1).
The test reflects only one set of pattern
parameters, in this case, a T% of 10 per-
cent and a pivot strength of 7. One
parameter set does not capture all the
possible patterns that occurred over the
three-year period.
The approach used here makes it pos-
sible to find price patterns using objec-
tive criteria, which in turn makes it pos-
sible to test trading ideas based on the
pattern to see if they have potential.
For information on the authors, see p. 10.
Code for this pattern can be found at
www.activetradermag.com/code.htm.
www.activetradermag.com • August 2003 • ACTIVE TRADER