Real Estate Market Overview: Dallas-Forth Worth
•
1 like•857 views

Texas real estate market overview provided by the Texas A&M Real Estate Research Center. For cities of Dallas-Fort Worth and Arlington. NOTE: Full-sized view or download is optimal.

Recommended
Recommended
More Related Content
Viewers also liked
More from Dee Patience
More from Dee Patience (10)
Recently uploaded
Recently uploaded (20)
Real Estate Market Overview: Dallas-Forth Worth
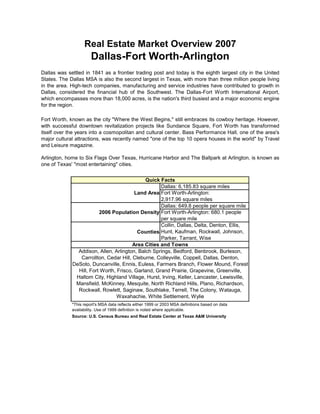
- 1. Real Estate Market Overview 2007 Dallas-Fort Worth-Arlington Dallas was settled in 1841 as a frontier trading post and today is the eighth largest city in the United States. The Dallas MSA is also the second largest in Texas, with more than three million people living in the area. High-tech companies, manufacturing and service industries have contributed to growth in Dallas, considered the financial hub of the Southwest. The Dallas-Fort Worth International Airport, which encompasses more than 18,000 acres, is the nation's third busiest and a major economic engine for the region. Fort Worth, known as the city quot;Where the West Begins,quot; still embraces its cowboy heritage. However, with successful downtown revitalization projects like Sundance Square, Fort Worth has transformed itself over the years into a cosmopolitan and cultural center. Bass Performance Hall, one of the area's major cultural attractions, was recently named quot;one of the top 10 opera houses in the worldquot; by Travel and Leisure magazine. Arlington, home to Six Flags Over Texas, Hurricane Harbor and The Ballpark at Arlington, is known as one of Texas' quot;most entertainingquot; cities. Quick Facts Dallas: 6,185.83 square miles Land Area Fort Worth-Arlington: 2,917.96 square miles Dallas: 649.8 people per square mile 2006 Population Density Fort Worth-Arlington: 680.1 people per square mile Collin, Dallas, Delta, Denton, Ellis, Counties Hunt, Kaufman, Rockwall, Johnson, Parker, Tarrant, Wise Area Cities and Towns Addison, Allen, Arlington, Balch Springs, Bedford, Benbrook, Burleson, Carrollton, Cedar Hill, Cleburne, Colleyville, Coppell, Dallas, Denton, DeSoto, Duncanville, Ennis, Euless, Farmers Branch, Flower Mound, Forest Hill, Fort Worth, Frisco, Garland, Grand Prairie, Grapevine, Greenville, Haltom City, Highland Village, Hurst, Irving, Keller, Lancaster, Lewisville, Mansfield, McKinney, Mesquite, North Richland Hills, Plano, Richardson, Rockwall, Rowlett, Saginaw, Southlake, Terrell, The Colony, Watauga, Waxahachie, White Settlement, Wylie *This report's MSA data reflects either 1999 or 2003 MSA definitions based on data availability. Use of 1999 definition is noted where applicable. Source: U.S. Census Bureau and Real Estate Center at Texas A&M University
- 2. Microsoft product screen shot reprinted with permission from Microsoft Corporation.
- 3. Metropolitan Statistical Areas (MSAs) DALLAM SHERMAN HANSFORD OCHILTREE LIPSCOMB HUTCHINSON HARTLEY MOORE ROBERTS HEMPHILL 2 CARSON POTTER WHEELER OLDHAM GRAY RANDALL ARMSTRONG DONLEY COLLINGSWORTH DEAF SMITH BRISCOE PARMER CASTRO SWISHER HALL CHILDRESS HARDEMAN WICHITA 25 BAILEY LAMB HALE FLOYD MOTLEY COTTLE WILBARGER FOARD 14 20 GRAYSON CLAY 21 LAMAR ARCHER MONTAGUE COOKE RED RIVER FANNIN COCHRAN HOCKLEY DICKENS KING KNOX BAYLOR LUBBOCK CROSBY BOWIE DELTA FRANKLIN WISE DENTON COLLIN HUNT JACK TITUS YOAKUM TERRY LYNN GARZA KENT STONEWALL HASKELL THROCKMORTON YOUNG HOPKINS 8 MORRIS CASS CAMP ROCKWALL RAINS PARKER WOOD UPSHUR MARION JONES SHACKLEFORD DALLAS TARRANT 1 GAINES DAWSON BORDEN SCURRY FISHER STEPHENS PALO PINTO KAUFMAN 22 13 GREGG SMITH HARRISON VAN ZANDT JOHNSON HOOD ELLIS CALLAHAN EASTLAND ANDREWS MARTIN HOWARD MITCHELL NOLAN TAYLOR ERATH SOMERVELL HENDERSON 17 16 PANOLA RUSK 9 NAVARRO HILL EL PASO 24 COMANCHE CHEROKEE BOSQUE STERLING COKE LOVING RUNNELS WINKLER ANDERSON ECTOR MIDLAND COLEMAN BROWN SHELBY FREESTONE 18 HAMILTON GLASSCOCK MCLENNAN CORYELL NACOGDOCHES MILLS LIMESTONE 11 SAN CULBERSON WARD HUDSPETH CRANE AUGUSTINE UPTON REAGAN HOUSTON SABINE CONCHO LEON TOM GREEN LAMPASAS IRION FALLS REEVES ANGELINA MCCULLOCH SAN SABA ROBERTSON 6 BELL TRINITY MADISON JASPER NEWTON MENARD SCHLEICHER POLK BURNET TYLER MILAM PECOS WALKER BRAZOS JEFF DAVIS CROCKETT MASON LLANO SAN WILLIAMSON JACINTO BURLESON KIMBLE 4 SUTTON HARDIN 3 GRIMES TRAVIS MONTGOMERY GILLESPIE LEE BLANCO ORANGE TERRELL WASHINGTON LIBERTY 10 BASTROP JEFFERSON KERR HAYS AUSTIN PRESIDIO WALLER EDWARDS VAL VERDE CHAMBERS REAL KENDALL FAYETTE BREWSTER CALDWELL HARRIS COMAL BANDERA FORT BEND COLORADO 19 GUADALUPE GALVESTON GONZALES KINNEY LAVACA UVALDE MEDINA BRAZORIA WHARTON BEXAR 23 WILSON DE WITT JACKSON FRIO MATAGORDA ZAVALA KARNES MAVERICK ATASCOSA VICTORIA GOLIAD CALHOUN DIMMIT BEE REFUGIO MCMULLEN LA SALLE ARANSAS LIVE OAK 7 12 SAN PATRICIO JIM WELLS NUECES 1. Abilene 14. Lubbock DUVAL WEBB KLEBERG 2. Amarillo 15. McAllen-Edinburg-Mission 3. Austin-Round Rock 16. Midland JIM HOGG ZAPATA BROOKS KENEDY 4. Beaumont-Port Arthur 17. Odessa 15 5. Brownsville-Harlingen 18. San Angelo STARR WILLACY 6. College Station-Bryan 19. San Antonio HIDALGO 5 CAMERON 7. Corpus Christi 20. Sherman-Denison 8. Dallas-Fort Worth-Arlington 21. Texarkana 9. El Paso 22. Tyler 10. Houston-Sugar Land-Baytown 23. Victoria 11. Killeen-Temple-Fort Hood 24. Waco 12. Laredo 25. Wichita Falls 13. Longview Prepared by the Labor Market and Career Information Department, TWC Edited by Real Estate Center at Texas A&M University
- 4. Table of Contents Demographics ..............................................................................................1 Education .....................................................................................................5 Employment .................................................................................................7 Economy ....................................................................................................15 Infrastructure ..............................................................................................16 Public Facilities ..........................................................................................17 Multifamily ..................................................................................................20 Housing ......................................................................................................24 Retail ..........................................................................................................37 Hotel...........................................................................................................43 Office..........................................................................................................45 Industrial ....................................................................................................58
- 5. Real Estate Center Market Overview 2007 Dallas – Fort Worth – Arlington, TX Dallas-Fort Worth-Arlington Market Overview 2007 Demographics Fort Worth-Arlington Dallas MD MD Population* Population* Percent Percent Change Change Year Population Year Population - 1996 3,076,605 - 1996 1,551,044 2.6 1997 3,178,447 3.2 1997 1,591,973 2.7 1998 3,283,020 3.2 1998 1,634,973 2.7 1999 3,381,283 2.9 1999 1,678,673 1.9 2000 3,451,226 2.0 2000 1,710,318 3.2 2001 3,585,379 3.7 2001 1,764,411 2.5 2002 3,664,340 2.2 2002 1,808,534 2.2 2003 3,737,262 2.0 2003 1,848,627 2.1 2004 3,812,875 2.0 2004 1,887,381 2.1 2005 3,893,123 2.1 2005 1,926,352 3.0 2006 4,019,499 3.1 2006 1,984,468 * July 1 population estimates * July 1 population estimates Source: U.S. Census Bureau Source: U.S. Census Bureau County Population Growth Growth 1996-2006 County 1996 2006 (in percent) 378,488 Collin 698,851 84.6 2,073,484 Dallas 2,345,815 13.1 5,085 Delta 5,561 9.4 354,915 Denton 584,238 64.6 97,597 Ellis 139,300 42.7 69,914 Hunt 83,338 19.2 110,751 Johnson 149,016 34.6 62,129 Kaufman 93,241 50.1 76,476 Parker 106,266 39.0 34,993 Rockwall 69,155 97.6 1,323,207 Tarrant 1,671,295 26.3 40,610 Wise 57,891 42.6 * July 1 population estimates Source: U.S. Census Bureau -1-
- 6. Real Estate Center Market Overview 2007 Dallas – Fort Worth – Arlington, TX Area Cities With 10,000 or More Residents Growth Growth 1990 2000 1990 2000 1990-2000 1990-2000 City City (cont'd) Population Population Population Population (percent) (percent) Addison 8,783 14,166 61.3 Grapevine 29,202 42,059 44.0 Allen 18,309 43,554 137.9 Greenville 23,071 23,960 3.9 Arlington 261,721 332,969 27.2 Haltom City 32,856 39,018 18.8 Athens 10,967 11,297 3.0 Highland Village 7,027 12,173 73.2 Balch Springs 17,406 19,375 11.3 Hurst 33,574 36,273 8.0 Bedford 43,762 47,152 7.7 Irving 155,037 191,615 23.6 Benbrook 19,564 20,208 3.3 Keller 13,683 27,345 99.8 Burleson 16,113 20,976 30.2 Lancaster 22,117 25,894 17.1 Carrollton 82,169 109,576 33.4 Lewisville 46,521 77,737 67.1 Cedar Hill 19,976 32,093 60.7 Mansfield 15,607 28,031 79.6 Cleburne 22,205 26,005 17.1 McKinney 21,283 54,369 155.5 Colleyville 12,724 19,636 54.3 Mesquite 101,484 124,523 22.7 Coppell 16,881 35,958 113.0 North Richland Hills 45,895 55,635 21.2 Corinth 3,944 11,325 187.1 Plano 128,713 222,030 72.5 Dallas 1,006,877 1,188,580 18.0 Richardson 74,840 91,802 22.7 Denton 66,270 80,537 21.5 Rockwall 10,486 17,976 71.4 DeSoto 30,544 37,646 23.3 Rowlett 23,260 44,503 91.3 Duncanville 35,748 36,081 0.9 Saginaw 8,551 12,374 44.7 Ennis 13,883 16,045 15.6 Seagoville 8,969 10,823 20.7 Euless 38,149 46,005 20.6 Southlake 7,065 21,519 204.6 Farmers Branch 24,250 27,508 13.4 Terrell 12,490 13,606 8.9 Flower Mound 15,527 50,702 226.5 The Colony 22,113 26,531 20.0 Forest Hill 11,482 12,949 12.8 University Park 22,259 23,324 4.8 Fort Worth 447,619 534,694 19.5 Watauga 20,009 21,908 9.5 Frisco 6,141 33,714 449.0 Waxahachie 18,168 21,426 17.9 Garland 180,650 215,768 19.4 Weatherford 14,804 19,000 28.3 Grand Prairie 99,616 127,427 27.9 White Settlement 15,472 14,831 -4.1 (in Dallas Co. only) 81,527 99,760 22.4 Wylie 8,716 15,132 73.6 Source: U.S. Census -2-
- 7. Real Estate Center Market Overview 2007 Dallas – Fort Worth – Arlington, TX Texas Metropolitan Area Population* Change Percent Metropolitan Area 1996 2006 Change Austin-Round Rock 1,073,037 1,513,565 41.1 McAllen-Edinburg-Mission 503,411 700,634 39.2 Laredo 171,583 231,470 34.9 Dallas-Fort Worth-Arlington 4,627,649 6,003,967 29.7 Houston-Sugar Land-Baytown 4,334,020 5,539,949 27.8 Brownsville-Harlingen 312,086 387,717 24.2 San Antonio 1,599,427 1,942,217 21.4 Texas 19,340,342 22,859,968 18.2 Tyler 166,087 194,635 17.2 Sherman-Denison 102,993 118,478 15.0 El Paso 656,482 736,310 12.2 College Station-Bryan 172,341 192,152 11.5 Amarillo 217,579 241,515 11.0 Killeen-Temple-Fort Hood 318,613 351,322 10.3 Waco 205,894 226,189 9.9 Midland 114,412 124,380 8.7 Longview 190,556 203,367 6.7 Lubbock 247,099 261,411 5.8 Texarkana 127,694 134,510 5.3 Victoria 108,636 114,088 5.0 Odessa 121,519 127,462 4.9 Corpus Christi 398,529 415,810 4.3 San Angelo 104,574 105,752 1.1 Abilene 156,351 158,063 1.1 Beaumont-Port Arthur 380,417 379,640 -0.2 Wichita Falls 151,170 145,528 -3.7 * July 1 population estimates Source: U.S. Census Bureau Dallas-Fort Worth-Arlington MSA Projected Population Texas State Data Center Texas Water Development Year (Scenario 0.5) Board 5,161,544 2000 5,161,518 5,667,966 2005 - 6,197,165 2010 6,506,854 6,753,598 2015 - 7,340,103 2020 7,830,371 7,973,634 2025 - 8,648,782 2030 8,947,262 9,360,952 2035 - 10,106,814 2040 10,103,144 Sources: Texas State Data Center (2006 projection) and Texas Water Development Board (2006 projection) -3-
- 8. Real Estate Center Market Overview 2007 Dallas – Fort Worth – Arlington, TX Texas Metropolitan Area Population Growth Forecast, 2000 - 2020 Texarkana Wichita Falls Beaumont-Port Arthur Abilene San Angelo Sherman-Denison Longview Lubbock Midland Tyler Waco Odessa Victoria College Station-Bryan Amarillo San Antonio Corpus Christi Texas Killeen-Temple-Fort Hood Houston-Sugar Land-Baytown El Paso Dallas-Fort Worth-Arlington Brownsville-Harlingen Austin-Round Rock McAllen-Edinburg-Mission Laredo 0% 10% 20% 30% 40% 50% 60% 70% 80% 90% Source: Texas State Data Center – Scenario 0.5 (2006 projection) Household Composition Dallas Fort Worth- Arlington PMSA PMSA Texas Average household size (2000) 2.7 2.68 2.74 Population younger than 18 (2000, in percent) 28.0 28.0 28.2 Population 65 and older (2000, in percent) 7.7 8.8 9.9 Source: U.S. Census Bureau (1999 definition) Distribution by Race and Hispanic or Latino Origin, 2000 (in percent) Dallas Fort Worth- PMSA Arlington PMSA Texas White 67.2 74.3 71.0 Black 25.1 11.2 11.5 Asian 4.0 3.2 2.7 American Indian 0.6 0.6 0.6 Other 10.7 8.3 11.7 Two or more races 2.4 2.4 2.5 Hispanic (of any race) 23.0 18.2 32.0 Source: U.S. Census Bureau (1999 definition) -4-
- 9. Real Estate Center Market Overview 2007 Dallas – Fort Worth – Arlington, TX Dallas-Fort Worth-Arlington Market Overview 2007 Education Educational Attainment, Persons Age 25 and Older (in percent) High school Some college, Associate's Bachelor's Master's Doctorate graduate no degree degree degree degree degree County 15.1 23.1 6.3 32.8 11.3 1.2 Collin 21.7 21.3 5.0 18.0 6.0 0.8 Dallas 36.1 21.5 4.0 8.5 4.8 0.5 Delta 19.9 26.1 6.7 26.6 7.4 1.2 Denton 30.8 24.6 5.3 12.4 3.2 0.4 Ellis 34.3 22.0 3.8 10.7 4.6 0.8 Hunt 33.2 25.0 5.5 9.7 2.8 0.4 Johnson 33.8 22.9 5.5 8.9 2.4 0.3 Kaufman 30.4 25.3 6.2 12.5 3.8 1.1 Parker 22.9 25.3 5.9 22.4 7.1 0.7 Rockwall 23.5 25.1 6.0 18.8 5.7 0.7 Tarrant 34.8 23.5 4.8 9.2 2.4 0.4 Wise 24.8 22.4 5.2 15.6 5.2 0.8 Texas Source: U.S. Census Bureau 2000 Educational Level, Persons Age 25 and Older, 2000 (in percent), PMSA Dallas Fort Worth- PMSA Arlington PMSA Level of Education High School Graduate or Higher 79.4 81 Bachelor's Degree or Higher 30 25.1 Source: U.S. Census Bureau 2000 (1999 definition) -5-
- 10. Real Estate Center Market Overview 2007 Dallas – Fort Worth – Arlington, TX Local College and University Enrollment, Fall Semester School 2002 2003 2004 2005 2006 Dallas Baptist University 4,417 4,538 4,714 4,988 5,146 DCCCD Brookhaven College 9,184 9,718 9,714 9,725 9,634 DCCCD Cedar Valley College 3,990 4,443 4,265 4,300 4,357 DCCCD Eastfield College 9,071 9,376 9,410 9,452 9,187 DCCCD El Centro College 5,672 6,182 5,903 6,629 6,529 DCCCD Mountain View College 6,266 5,843 5,980 6,140 6,766 DCCCD North Lake College 8,456 7,960 8,189 8,623 8,830 DCCCD Richland College 13,562 13,204 13,412 13,552 13,774 Paul Quinn College 871 858 966 771 783 Southern Methodist University 10,955 11,161 10,901 11,024 10,990 Tarrant County Northeast Campus 10,882 11,602 12,405 12,372 12,135 Tarrant County Northwest Campus 5,182 6,025 7,241 7,356 7,546 Tarrant County South Campus 8,027 8,200 9,971 9,885 9,431 Tarrant County Southeast Campus 8,370 8,579 8,657 8,975 9,339 Texas Christian University 8,074 8,275 8,632 8,706 8,865 Texas Wesleyan University 2,576 2,845 2,742 2,662 2,930 Texas Woman's University 8,703 9,701 10,746 11,326 11,479 University of Dallas 3,159 3,125 2,987 2,992 2,941 University of North Texas 30,183 31,065 31,155 31,947 33,443 University of Texas at Arlington 23,821 24,979 25,297 25,216 24,825 University of Texas at Dallas 13,229 13,718 14,092 14,399 14,523 Weatherford College 3,569 3,895 4,216 4,437 4,379 Source: Texas Higher Education Coordinating Board -6-
- 11. Real Estate Center Market Overview 2007 Dallas – Fort Worth – Arlington, TX Dallas-Fort Worth-Arlington Market Overview 2007 Employment Top 20 DFW Employers Employer Sector Employees Wal-Mart Stores, Inc. Retail 29,237 AMR Corp./American Airlines Airline 25,000 Dallas ISD Education 19,359 Texas Health Resources Health care 17,000 Raytheon Co. Defense and aerospace 16,250 Verizon Communications, Inc. Telecommunications 15,900 Lockheed Martin Aeronautics Co. Military aircraft 15,000 Baylor Health Care System Health care 14,572 AT&T Communications 14,000 U.S. Postal Service Government 13,850 HCA Healthcare Health care 13,000 Albertson's Inc. Retail grocery 12,240 City of Dallas Government 12,221 Countrywide Home Loans Financial services 11,798 Kroger Food Stores Grocery 11,500 Citigroup Inc. Financial services 10,635 Brinker International Inc. Restaurants 10,283 TTI, Inc. Semiconductor 9,972 Fort Worth ISD Education 9,881 Texas Instruments Semiconductor 9,700 Source: Greater Dallas Chamber Economic Development Guide Nov-2006 -7-
- 12. Real Estate Center Market Overview 2007 Dallas – Fort Worth – Arlington, TX Fort Worth Top Ten Employers Employer Sector Employees Airline 28,492 American Airlines Military aircraft 15,000 Lockheed Martin Aeronautics Co. Fort Worth ISD Education 10,389 Bell Helicopter - Textron, Inc. Manufacture vertical flight aircraft 6,000 City of Fort Worth Municipal government 5,750 Tarrant County Government Government 4,050 Chase Financial services 4,000 Cook Children's Medical Center Non-profit children's health care 3,800 Harris Methodist Fort Worth Hospital Medical 3,789 BNSF Railway Transportation services 3,500 Source: Fort Worth Chamber of Commerce Feb-2006 Fort Worth Top Ten Private Employers Employer Sector Employees Airline 28,492 American Airlines Military aircraft 15,000 Lockheed Martin Aeronautics Co. Bell Helicopter - Textron, Inc. Manufacture vertical flight aircraft 6,000 Chase Financial services 4,000 Cook Children's Medical Center Non-profit children's health care 3,800 Harris Methodist Fort Worth Hospital Medical 3,789 BNSF Railway Transportation services 3,500 RadioShack Corp. Electronics 3,337 JPS Health Network Health Care 3,309 Alcon Laboratories Ophthalmic pharmaceuticals 2,977 Source: Fort Worth Chamber of Commerce Feb-2006 -8-
- 13. Real Estate Center Market Overview 2007 Dallas – Fort Worth – Arlington, TX Arlington Top Ten Employers Employer Sector Employees Arlington Independent School Dist. Education 8,000 University of Texas at Arlington Education 5,700 Six Flags Over Texas Hospitality & Tourism 3,200 General Motors Manufacturing 3,000 The Parks Mall Retail 3,000 Texas Rangers Baseball Club Hospitality & Tourism 1,800 City of Arlington Government 1,700 AmeriCredit Finance 1,300 Arlington Memorial Hospital Health care 1,300 Providian Financial Financial call center 1,200 Source: Arlington Chamber of Commerce April-2007 Arlington Top Ten Private Employers Employer Sector Employees Six Flags Over Texas Hospitality & Tourism 3,200 General Motors Manufacturing 3,000 The Parks Mall Retail 3,000 Texas Rangers Baseball Club Hospitality & Tourism 1,800 AmeriCredit Finance 1,300 Arlington Memorial Hospital Health care 1,300 Providian Financial Finance 1,200 Wal-Mart Retail 1,200 National Semiconductor Manufacturing 1,100 Chase Bank Call Center Finance 1,000 Source: Arlington Chamber of Commerce April-2007 -9-
- 14. Real Estate Center Market Overview 2007 Dallas – Fort Worth – Arlington, TX Employment Growth by Industry Dallas-Plano- Fort Worth - Irving Arlington Texas Employment Growth 2006 (Percent Change) 3.7 3.0 3.3 Unemployment Rate 2006 (Percent Change) 4.8 4.7 4.9 Net Job Change in 2006 72,200 24,100 318,300 2006 Employment Growth by Sector (Percent Change) Natural Resources and Mining and Construction 5.3 6.9 7.5 Manufacturing 1.8 2.9 3.2 Trade, Transportation, and Utilities 2.0 1.8 2.5 Information 0.0 -2.4 -0.4 Financial Activities 4.2 0.8 2.6 Professional and Business Services 8.2 5.3 6.0 Educational and Health Services 5.2 6.5 2.8 Leisure and Hospitality 3.5 2.2 3.9 Government 2.5 1.6 1.7 Source: Texas Workforce Commission and Real Estate Center at Texas A&M University Texas Metropolitan Area Nonfarm Employment Change Percent Metropolitan Area 1996 2006 Change McAllen-Edinburg-Mission 126,900 202,600 59.7 Midland 126,900 202,600 59.7 Laredo 56,500 84,200 49.0 Austin-Round Rock 540,900 720,000 33.1 Brownsville-Harlingen 94,000 121,300 29.0 College Station-Bryan 71,400 90,200 26.3 Tyler 73,700 91,700 24.4 Killeen-Temple-Fort Hood 97,600 118,100 21.0 Dallas-Fort Worth-Arlington 2,331,600 2,860,800 22.7 San Antonio 658,300 811,300 23.2 Longview 76,100 91,600 20.4 Houston-Sugar Land-Baytown 1,981,700 2,446,000 23.4 Texas 8,257,900 10,053,300 21.7 Lubbock 111,300 128,400 15.4 Waco 92,600 106,000 14.5 Corpus Christi 155,100 173,800 12.1 Odessa 48,100 57,400 19.3 Amarillo 96,900 110,100 13.6 Victoria 45,200 50,000 10.6 El Paso 236,700 264,800 11.9 Texarkana 50,300 55,700 10.7 Sherman-Denison 42,000 44,500 6.0 Abilene 60,600 65,300 7.8 San Angelo 42,500 44,700 5.2 Wichita Falls 59,600 62,500 4.9 Beaumont-Port Arthur 151,200 160,500 6.2 Source: Texas Workforce Commission and Real Estate Center at Texas A&M University - 10 -
- 15. Real Estate Center Market Overview 2007 Dallas – Fort Worth – Arlington, TX Metropolitan Area Nonfarm Employment Change 1996-2006 Wichita Falls San Angelo Sherman-Denison Beaumont-Port Arthur Abilene Victoria Texarkana El Paso Corpus Christi Amarillo Waco Lubbock Odessa Longview Killeen-Temple-Fort Hood Texas Dallas-Fort Worth-Arlington San Antonio Houston-Sugar Land-Baytown Tyler College Station-Bryan Brownsville-Harlingen Austin-Round Rock Laredo Midland McAllen-Edinburg-Mission 0% 10% 20% 30% 40% 50% 60% 70% Source: Texas Workforce Commission and Real Estate Center Average Hourly Wage 2005 Brownsville-Harlingen $12.25 McAllen-Edinburg-Mission $12.72 Abilene $13.39 Laredo $13.50 San Angelo $14.08 El Paso $14.14 Wichita Falls $14.17 Killeen-Temple-Fort Hood $14.23 Waco $14.45 Longview $14.63 Sherman-Denison $14.66 Texarkana $14.71 Corpus Christi $14.89 Tyler $15.11 Odessa $15.11 Victoria $15.34 Amarillo $15.37 Lubbock $15.51 Beaumont-Port Arthur $15.59 San Antonio $15.76 College Station-Bryan $15.85 Midland $16.56 Texas $17.10 Austin-Round Rock $18.71 Houston-Sugar Land-Baytown $18.76 Dallas-Fort Worth-Arlington $18.84 $10.00 $12.00 $14.00 $16.00 $18.00 $20.00 Source: Texas Workforce Commission - 11 -
- 16. Real Estate Center Market Overview 2007 Dallas – Fort Worth – Arlington, TX Dallas-Plano-Irving MD Fort Worth-Arlington MD Nonfarm Employment Nonfarm Employment Percent Percent Change Change Year Employment Year Employment 1,650,000 - 681,500 - 1996 1996 1,742,600 5.6 710,300 4.2 1997 1997 1,826,100 4.8 742,800 4.6 1998 1998 1,893,900 3.7 769,600 3.6 1999 1999 1,966,900 3.9 796,300 3.5 2000 2000 1,976,500 0.5 798,500 0.3 2001 2001 1,916,000 -3.1 789,000 -1.2 2002 2002 1,883,000 -1.7 782,600 -0.8 2003 2003 1,903,300 1.1 794,900 1.6 2004 2004 1,951,500 2.5 813,000 2.3 2005 2005 2,023,700 3.7 837,100 3.0 2006 2006 Source: Texas Workforce Commission and Source: Texas Workforce Commission and Real Estate Center at Texas A&M University Real Estate Center at Texas A&M University Nonfarm Employment Growth Dallas-Fort Worth-Arlington MSA 7.0 6.0 5.0 Percent Change from Previous Year 4.0 3.0 2.0 1.0 0.0 -1.0 -2.0 -3.0 -4.0 1997 1998 1999 2000 2001 2002 2003 2004 2005 2006 Dallas-Plano-Irving Fort Worth-Arlington Source: Texas Workforce Commission and Real Estate Center at Texas A&M University - 12 -
- 17. Real Estate Center Market Overview 2007 Dallas – Fort Worth – Arlington, TX Distribution of Employment in Major Categories Dallas-Plano-Irving MD 2,500,000 2,000,000 Total Annual Jobs 1,500,000 1,000,000 500,000 0 2002 2003 2004 2005 2006 Natural Resources and Mining and Construction Manufacturing Trade, Transportation, and Utilities Information Financial Activities Professional and Business Services Educational and Health Services Leisure and Hospitality Government Source: Texas Workforce Commission and Real Estate Center at Texas A&M University Distribution of Employment in Major Categories Fort Worth-Arlington MD 900,000 800,000 700,000 600,000 Total Annual Jobs 500,000 400,000 300,000 200,000 100,000 0 2002 2003 2004 2005 2006 Natural Resources and Mining and Construction Manufacturing Trade, Transportation, and Utilities Information Financial Activities Professional and Business Services Educational and Health Services Leisure and Hospitality Government Source: Texas Workforce Commission and Real Estate Center at Texas A&M University - 13 -
- 18. Real Estate Center Market Overview 2007 Dallas – Fort Worth – Arlington, TX Dallas-Fort Worth-Arlington MSA Unemployment Rate 7 6 5 4 Percent 3 2 1 0 1997 1998 1999 2000 2001 2002 2003 2004 2005 2006 Source: Texas Workforce Commission and Real Estate Center at Texas A&M University - 14 -
- 19. Real Estate Center Market Overview 2007 Dallas – Fort Worth – Arlington, TX Dallas-Fort Worth-Arlington Market Overview 2007 Economy Fort Worth-Arlington MD Dallas-Plano-Irving MD Gross Retail Sales Gross Retail Sales Sales per Sales per Capita Year Total Sales Capita Year Total Sales 1995 1995 39,453,669,760 #N/A 16,781,866,218 #N/A 1996 1996 43,244,343,151 14,056 18,512,124,617 11,935 1997 1997 45,596,786,952 14,346 19,368,252,131 12,166 1998 1998 50,395,804,082 15,350 20,434,340,405 12,498 1999 1999 54,369,358,086 16,080 20,948,095,725 12,479 2000 2000 57,063,698,868 16,534 23,806,625,051 13,919 2001 2001 55,934,773,026 15,601 25,232,389,298 14,301 2002 2002 55,529,200,413 15,154 23,956,639,978 13,246 2003 2003 56,474,148,771 15,111 25,038,695,682 13,544 2004 2004 64,552,459,062 16,930 27,099,154,429 14,358 2005 2005 78,916,290,105 20,271 28,386,068,582 14,736 State Average 2005: $15,935 State Average 2005: $15,935 * 2006 data not available as of April 15, 2007. * 2006 data not available as of April 15, 2007. Source: Texas Comptroller's Office Source: Texas Comptroller's Office Gross Retail Sales per Capita 2005 Brownsville-Harlingen Texarkana McAllen-Edinburg-Mission El Paso Corpus Christi Wichita Falls Beaumont-Port Arthur College Station-Bryan Sherman-Denison Waco Abilene San Angelo Laredo Victoria Killeen-Temple-Fort Hood Houston-Sugar Land-Baytown San Antonio Fort Worth-Arlington MD Amarillo Longview Tyler Austin-Round Rock Odessa Texas Midland Dallas-Plano-Irving MD Lubbock $5,000 $7,000 $9,000 $11,000 $13,000 $15,000 $17,000 $19,000 $21,000 Source: Texas Comptroller's Office - 15 -
- 20. Real Estate Center Market Overview 2007 Dallas – Fort Worth – Arlington, TX Dallas-Fort Worth-Arlington Market Overview 2007 Infrastructure DFW Airline Activity 2002 2003 2004 2005 2006 Airport Dallas Love Field 2,811,471 2,795,554 2,945,588 2,949,266 3,439,050 Enplaned 2,811,283 2,793,376 2,944,168 2,947,499 3,435,667 Deplaned 5,622,754 5,588,930 5,889,756 5,896,765 6,874,717 Total Dallas/Fort Worth International Total enplaned and 52,814,185 53,253,607 59,445,740 59,161,779 60,226,138 deplaned* *Domestic and international passengers Source: Dallas-Fort Worth International Airport and Dallas Love Field Airport Airport Cargo Statistics 2002 2003 2004 2005 2006 Airport Dallas/Fort Worth International* 738,074 734,828 817,825 817,866 834,643 *In US Tons Source: Dallas-Fort Worth International Airport - 16 -
- 21. Real Estate Center Market Overview 2007 Dallas – Fort Worth – Arlington, TX Dallas-Fort Worth-Arlington Market Overview 2007 Public Facilities Dallas City Public Facilities Building Permits 2005* Dallas City Building Permit Office * 2006 data not available as of April 15, 2007. Denton City Public Facilities Building Permits 2005* Denton City Building Permit Office * 2006 data not available as of April 15, 2007. - 17 -
- 22. Real Estate Center Market Overview 2007 Dallas – Fort Worth – Arlington, TX Hurst City Public Facilities Building Permits 2005* Hurst City Building Permit Office * 2006 data not available as of April 15, 2007. Fort Worth City Public Facilities Building Permits 2005* Fort Worth City Building Permit Office * 2006 data not available as of April 15, 2007. - 18 -
- 23. Real Estate Center Market Overview 2007 Dallas – Fort Worth – Arlington, TX Garland City Public Facilities Building Permits 2005* Garland City Building Permit Office * 2006 data not available as of April 15, 2007. - 19 -
- 24. Real Estate Center Market Overview 2007 Dallas – Fort Worth – Arlington, TX Dallas-Fort Worth-Arlington Market Overview 2007 Multifamily Apartment Statistics 2006 Texas Metro Dallas Fort Worth Average Average rent per square foot $0.82 $0.75 $0.77 Average rent for units built since 2000 $0.92 $0.83 $0.86 Average occupancy 92.1% 91.1% 92.8% Average occupancy for units built since 2000 94.0% 92.6% 94.1% Source: Apartment MarketData Research Multifamily Building Permits 5+ Multifamily Building Permits 18,000 16,000 14,000 12,000 10,000 Units 8,000 6,000 4,000 2,000 0 p 1987 1988 1989 1990 1991 1992 1993 1994 1995 1996 1997 1998 1999 2000 2001 2002 2003 2004 2005 2006 Dallas Fort Worth-Arlington 2006 figure is a preliminary number. Source: U.S. Bureau of Census and Real Estate Center at Texas A&M University - 20 -