
Recommandé
Recommandé
Contenu connexe
Tendances
Tendances (20)
En vedette
Similaire à DREAM Model for Analyzing Delaware River
Similaire à DREAM Model for Analyzing Delaware River (20)
Plus de Kim Beidler
Plus de Kim Beidler (20)
Dernier
Dernier (20)
DREAM Model for Analyzing Delaware River
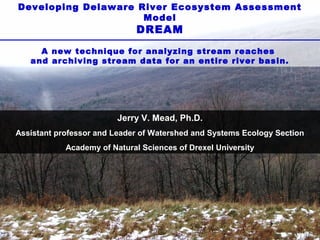
- 1. Developing Delaware River Ecosystem Assessment Model DREAM A new technique for analyzing stream reaches and archiving stream data for an entire river basin. Jerry V. Mead, Ph.D. Assistant professor and Leader of Watershed and Systems Ecology Section Academy of Natural Sciences of Drexel University
- 5. Web-served geodatabase Archive baseline and project data; Archive modeling and associated metadata; Allow users to access and assess information quickly.
- 6. Evaluating multiple-environmental targets Atrazine Water temperature Storm water Stream order 7-9 4-6 1:2 (worst than reference) 1:1 (no change) 1-3 Carbon storage Total phosphorus
- 7. How will the tool work?
- 8. Problem! So many streams! ~29,000 km2 ? +
- 9. Split into 120 m long reaches Generalized stream reach NHD data base Channel width 30 m riparian zone
- 11. %Forest cover (30 meter resolution) ® %Forest cover (1 meter resolution) 1:1,966,745 % Forest cover 0 15 25 35 45 55 65 75 85 95 impervious grass/herb forest
- 12. Field measurements of forest cover = point survey of land cover = 120 per reach X 33 reaches 120 meter reach 30 meters 30 meters
- 13. # Cases % Forest cover (measured)
- 14. Error in model estimates of riparian forest cover Resolution of forest map 1 meter 30 meter
- 15. 100 75 50 25
- 16. Models or environmental indicators included Indicator Total PhosphorusE Description Total Suspended Solids E Land use in the watershed Source McNair unpublished; Fischer et al. 2008 McNair unpublished; Fischer et al. 2008 Land use in the watershed Carbon stocksX Forest litter inputsX Stream channel widthX Water temperatureX Richness of MacroinvertbratesX Stream fish growth potentialX Intolerant stream fish diversity Based on forest inventory (good for climate-change mgt.) Riparian vegetation and litter inputs to stream Developed using 190 locations in the basin Developed using 101 gages in basin # of mayfly (E), stonefly (P) , caddisfly (T) taxa in a stream reach Non-native/native X (cold, cool, and warm water species) Major determinant of native fish biodiversity; sensitive to variety of disturbances, Sensitive to variety of disturbances. Murdoch et al. 2007 Mead et al. 2009 Mead et al. 2009 Mead et al. 2009 Fischer et al. 2008 Mead et al. 2009 Horwitz et al. 2008 Louisiana Waterthrush (Seiurus motacilla) habitat Riparian quality indicator and areas at risk (Figure 3) Prosser and Brooks 1998 Known sites of Species of special concern Factor in site prioritization Natural Heritage Programs & unpub. data Stream salamander abundance and diversity Horwitz et al 2009; NJ Fish IBI program Flinders et al. 2008
- 17. Fish bioenergetics models • Brook trout Native fishes • Yellow perch Hartman et al. 2008 Kitchell et al. 1977 • Juvenile American shad Limburg 1995 Non-native fishes • Brown trout Dieterman et al. 2004 • Smallmouth bass Shuter and Post 1990 • Common carp Opuszynski et al. 1989, Specziar 2002, Stecyk
- 18. Climate change
- 19. us al in t ou a) T r tt n tr u ow o Br alm (S rp io) ca arp on c m us m rin Co yp ) ra (C ss pte ba ro th i c ou s m lm u al oln Sm alm (S ) ns h rc sce Pe ve w la llo a f ad Ye erc sh (P n ) ica a er sim s Am idi le p ni sa ve a ju los ) (A t t ou fon Tr s k nu oo eli Br av (S % Change in growth from current condition With high carbon emissions scenario
- 20. Conclusions • Technique assessed riparian zones rapidly. ~3hrs for ~340,000 stream reaches; • 30 meter maps not accurate enough for riparian assessment (under-estimated). 1 meter resolution maps over estimated forest cover by 15%; • Delaware has heavily deforested coastal zone (average 28% forest cover). Increasing forest cover from south to north. • The Environmental Planning Tool approach is extremely effective at estimating riparian forest cover for an entire river basin at the reach (120 m long) scale.
- 21. Developing the Tool •Watershed groups help develop tool; •Watershed groups use tool as demo; •Tool disseminated and put online; •Form a review board for tool expansion.
- 22. Thank you!