Contenu connexe
Similaire à Deloitte Holiday Survey 2013 - Infographic
Similaire à Deloitte Holiday Survey 2013 - Infographic (20)
Plus de Deloitte United States
Plus de Deloitte United States (20)
Deloitte Holiday Survey 2013 - Infographic
- 1. Share on Facebook
Post on LinkedIn
Tweet on Twitter
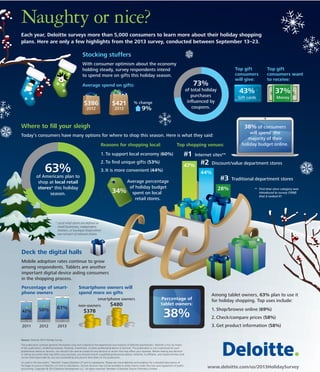
Naughty or nice?
Each year, Deloitte surveys more than 5,000 consumers to learn more about their holiday shopping
plans. Here are only a few highlights from the 2013 survey, conducted between September 13–23.
Stocking stuffers
With consumer optimism about the economy
holding steady, survey respondents intend
to spend more on gifts this holiday season.
73%
Average spend on gifts:
$386
$421
2012
9%
43%
Where to fill your sleigh
37%
Money
38% of consumers
Today’s consumers have many options for where to shop this season. Here is what they said:
Reasons for shopping local:
Top shopping venues:
1. To support local economy (60%)
2. To find unique gifts (53%)
63%
Top gift
consumers want
to receive:
Gift cards
of total holiday
purchases
influenced by
coupons.
% change
2013
Top gift
consumers
will give:
47%
3. It is more convenient (44%)
of Americans plan to
shop at local retail
stores* this holiday
season.
#1
Internet sites**
#2
Discount/value department stores
44%
Average percentage
of holiday budget
34% spent on local
retail stores.
will spend the
majority of their
holiday budget online.
#3
28%
Traditional department stores
** First time since category was
introduced to survey (1998)
that it ranked #1.
* Local retail stores are defined as
small businesses, independent
retailers, or boutique shops which
are not part of national chains.
Deck the digital halls
Mobile adoption rates continue to grow
among respondents. Tablets are another
important digital device aiding consumers
in the shopping process.
Percentage of smartphone owners
Smartphone owners will
spend more on gifts
smartphone owners
42%
2011
50%
2012
61%
non-owners
$378
$480
Percentage of
tablet owners:
38%
2013
Among tablet owners, 63% plan to use it
for holiday shopping. Top uses include:
1. Shop/browse online (69%)
2. Check/compare prices (58%)
3. Get product information (58%)
Source: Deloitte 2013 Holiday Survey
This publication contains general information only and is based on the experiences and research of Deloitte practitioners. Deloitte is not, by means
of this publication, rendering business, financial, investment, or other professional advice or services. This publication is not a substitute for such
professional advice or services, nor should it be used as a basis for any decision or action that may affect your business. Before making any decision
or taking any action that may affect your business, you should consult a qualified professional advisor. Deloitte, its affiliates, and related entities shall
not be held responsible for any loss sustained by any person who relies on this publication.
As used in this document, “Deloitte” means Deloitte LLP and its subsidiaries. Please see www.deloitte.com/us/about for a detailed description of
the legal structure of Deloitte LLP and its subsidiaries. Certain services may not be available to attest clients under the rules and regulations of public
accounting. Copyright © 2013 Deloitte Development LLC. All rights reserved. Member of Deloitte Touche Tohmatsu Limited.
www.deloitte.com/us/2013HolidaySurvey