2. 328 Environ Monit Assess (2011) 174:327–335
to get rid of the pests damaging agricultural and
horticultural crops and also to eradicate vectors.
The residues of these compounds are still found to
some extent in various substances in some coun-
tries. So, there is a need for further monitoring of
samples for residues of this group of pesticides.
Feed and fodder, when contaminated, act as
main source of entry of pesticides in animal body.
Once the animal body system gets contaminated
with pesticide residues, not only does it affect the
animals directly but also exerts indirect effect on
human health through food of animal origin like
milk and meat. Therefore, unless residues in feed
and fodder are controlled, pesticides are likely to
accumulate in animal body tissues and then ex-
crete in milk. Most of the residue-monitoring pro-
grammes are concentrated on food crops, fruits
and vegetables. As evidenced from survey of lit-
erature, only a few reports about the status of
pesticide residues in feed and fodder are available
from India (Kaphalia and Seth 1982; Shastry 1983;
Dikshith et al. 1989; Singh et al. 1997; Gupta et al.
2000; Prasad and Chhabra 2001; Kang et al. 2002)
and abroad (Pierson et al. 1982; Lovell et al. 1996).
Therefore, the present investigation was under-
taken to analyse 533 feed samples collected from
different areas of Bundelkhand region of India
during the period of 2002–2005 for persistent OC
residues.
Materials and methods
Sampling
Feed samples comprising of oilseed cakes of
mustard (Brassica sp.), linseed (Linum usita-
tissum), sesamum (Sesamum indicum), cotton,
pulse byproducts i.e. chunnies (powdered outer
seed coat) of gram (Cicer arietinum), lentil (Lens
culinaris), pea (Pisum sativum), urd (Vigna sp.),
arhar (Cajanus cajan), cereal straw (wheat,
paddy), cereal by products (chunnies of oat, rice,
wheat flour) and pashu ahar™ (commercial
concentrate mixture) were collected from dif-
ferent places like Jhansi, Banda, Gwalior, Jalaun,
Tikamgar, Hamirpur, Chattarpur, Panna, Sagar
and Bhind which cover the Bundelkhand region
of India.
Analytical procedure
Extraction and clean-up
The analytical methods of Luke et al. (1975)
and Nakamura et al. (1994) were followed with
modifications. Samples ground to a fine powder
(20 g) were extracted in soxhlet for 8 h continu-
ously in hexane. The extract was dried, concen-
trated and cleaned up by partitioning and column
chromatography using florisil.
Gas chromatographic analysis
The qualitative and quantitative determination
was done in gas chromatography on a Varian CP-
3800 equipment fitted with Ni63
electron capture
detector. The column used was WCOT fused silica
capillary having dimension of 30 m × 0.32 mm
id × 0.25 μm film thickness (CP-SIL 5 CB). The
operating conditions of GC were as follows:
Temperatures
Column − 180◦
C (1 min)
3o
Cmin-1
250◦
C
(5 min)
Injector − 260◦
C, Split (1:10)
Detector − 300◦
C
Carrier gas: Nitrogen at a flow rate of
1 ml min−1
through column and 30 ml min−1
make
up.
The identification of peaks and quantification
of concentration was done based on the external
standard solution injected initially and after every
five samples.
The pesticides determined were α-HCH, β-
HCH, γ-HCH, δ-HCH, op|
DDE, pp|
DDE, op|
DDD, pp|
DDD, op|
DDT, pp|
DDT, aldrin, hep-
tachlor, α-endosulfan, β-endosulfan, endosulfan
sulfate and dicofol. A working standard solution
of mixture of all the above pesticides was prepared
by combining aliquots of each individual stock
solution of 100 μg/ml and diluting to a concentra-
tion of 1.0 μg min−1
with isooctane. The standard
solution was stored in standard stoppered tubes at
4◦
C in refrigerator.
3. Environ Monit Assess (2011) 174:327–335 329
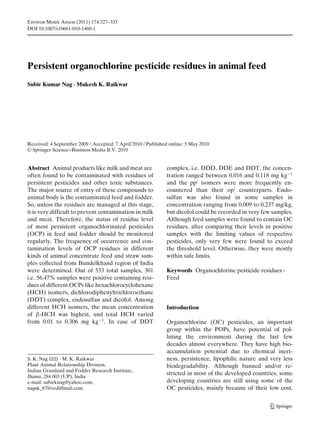
Fig. 1 Extended of contamination of feed samples with OC pesticide residue
Results and discussion
Method performance and validation
The detector linearity was tested by linear re-
gression analysis of five-point response versus
concentration calibration curve for each analyte.
Linear regression equations were used to quan-
tify analytes in samples. Calibration of gas chro-
matograph was done before sample analysis using
the standards of pesticides obtained from authen-
tic sources. Qualitative and quantitative analyses
were performed by comparing the retention time
and peak area of the samples, respectively, with
those of the calibrated reference standards.
Recovery experiment was conducted by spiking
the feed samples with all the pesticide standards
taken for analysis at 0.1 and 0.5 mg kg−1
level to
see the efficiency of extraction and analytical pro-
cedure. The mean average recovery varied from
88–95% with standard deviation being less than
8 U indicating good repeatability of the method.
The limit of detections were 0.001 mg kg−1
for
HCH (α, γ, δ), 0.002 mg/kg for endosulfan (α, β,
sulfate), 0.003 mg/kg DDT (op|
and pp|
isomers of
DDE, DDD and DDT) and 0.005 for β-HCH and
dicofol.
Residues in the samples
The overall and relative contamination of differ-
ent feed samples is shown in Figs. 1 and 2,
respectively. Out of 533 samples analysed for
Fig. 2 Level of
contamination of
different feed samples
with OC pesticide
residues
5. Environ Monit Assess (2011) 174:327–335 331
different organochlorinated pesticides, 301 sam-
ples were positive containing residues of HCH
isomers, DDTs, endosulfan and dicofol. About
60% samples were found contaminated in case
of mustard seed cake (MSC), cotton seed cake
(CSC), linseed cake (LSC), gram chunni (GC), pea
chunni and rice chunni (RC). For the rest of the
samples, the extent of contamination was 30–40%.
The concentrations of different HCH isomers
viz., α, β, γ and δ and that of total HCH in dif-
ferent feed samples are given Table 1. Apart from
the most active isomer i.e. γ-isomer (lindane),
other isomers like α, β and δ were also detected
in most of the feed samples. It was observed that
among different HCH isomers, the concentration
of predominantly accumulating, metabolically sta-
ble and most persistent β-HCH was highest in
most of the samples. The mean total HCH con-
centration, which is the summation of all individ-
ual isomers, varied from 0.01 to 0.306 mg kg−1
in different samples, and this was found lesser
than the earlier studies (Kaphalia and Seth 1982;
Dikshith et al. 1989; Singh et al. 1997; Gupta et al.
2000).
Endosulfan, one of the cyclodiene groups of
chlorinated insecticides, measured as its two ac-
tive isomers α and β and their toxic metabolite
endosulfan sulphate were detected in all types
of samples except groundnut cake (GNC), gram
straw (GS) and RC where no residue of en-
dosulfan was found. The mean total endosulfan
residues comprising of α and β isomers and sul-
phate varied from 0.009 to 0.237 mg/kg in different
kinds of feed samples (Table 2). In earlier in-
stances, endosulfan was not included normally in
the monitoring programme for OCPs of feed and
Table 2 Concentration of endosulfan isomers and sulfate (mg kg−1) in feed samples
Samples α-Endosulfan β-Endosulfan Endosulfan sulfate -Endosulfan
Mustard seed cake Tr–0.04 Tr–0.166 Tr–0.223 Tr–0.389
(0.007 ± 0.008) (0.018 ± 0.032) (0.031 ± 0.064) (0.03 ± 0.061)
Linseed cake Tr–0.307 Tr–0.083 Tr–0.148 Tr–0.307
(0.017 ± 0.054) (0.016 ± 0.021) (0.034 ± 0.053) (0.035 ± 0.064)
Cottonseed cake Tr–0.031 Tr–0.032 Tr–0.024 Tr–0.048
(0.012 ± 0.009) (0.008 ± 0.008) (0.009 ± 0.01) (0.018 ± 0.014)
Sesamum seed cake Tr 0.048 0.008–0.046 0.008–0.094
(0.027 ± 0.019) (0.051 ± 0.043)
Groundnut cake – – – –
Wheat straw Tr–0.025 Tr–0.022 Tr–0.029 Tr–0.044
(0.008 ± 0.008) (0.007 ± 0.007) (0.016 ± 0.01) (0.019 ± 0.016)
Lentil straw Tr–0.326 Tr–0.012 0.006 0.001–0.326
(0.101 ± 0.132) (0.008 ± 0.005) (0.087 ± 0.122)
Gram straw – – – –
Oat chunni 0.003–0.198 Tr–0.858 Tr–0.305 Tr–1.287
(0.072 ± 0.077) (0.198 ± 0.333) (0.104 ± 0.142) (0.237 ± 0.435)
Urd chunni 0.0168 – 0.005–0.011 0.005–0.028
(0.008 ± 0.003) (0.016 ± 0.011)
Gram chunni Tr–0.074 Tr–0.049 0.003–0.0615 0.003–0.12
(0.015 ± 0.019) (0.012 ± 0.013) (0.020 ± 0.018) (0.029 ± 0.033)
Arhar chunni 0.009–0.022 0.0396 – 0.009–0.061
(0.015 ± 0.009) (0.035 ± 0.026)
Pea chunni – 0.0092 – 0.017
Rice chunni 0.004–0.009 0.0036 0.0031 0.008–0.01
(0.006 ± 0.002) (0.009 ± 0.001)
Wheat flour chunni – – 0.031–0.065 0.031–0.065
(0.048 ± 0.016) (0.048 ± 0.016)
Compound feed 0.01–0.023 0.023–0.046 0.003 0.046–0.06
(0.017 ± 0.006) (0.035 ± 0.011) (0.053 ± 0.007)
7. Environ Monit Assess (2011) 174:327–335 333
other samples except in rare cases as observed
through scanning of literature. The focus of mon-
itoring was mainly concentrated on DDTs and
HCHs. But Prasad and Chhabra (2001) found
that endosulfan constituted 8% of total OCPRs
in overall feed and fodder samples collected and
analysed at Karnal, India. Deka et al. (2004) also
detected β-endosulfan and endosulfan sulphate
in concentrated feed samples at Jorhat, Assam
(India) while in Ludhiana (Punjab), India endo-
sulfan could be detected in one sample out of 17
total feed concentrate samples (Kang et al. 2002).
DDT residues represented by op|
and pp|
iso-
mers of DDD, DDE and DDT, ether singly or
in different combinations, were found present in
different types of samples except GS where they
were totally absent. In samples of MSC, CSC,
LSC, wheat straw (WS), lentil straw (LS) and
GC all the components of total DDT were de-
tected. In samples of GNC, only pp|
DDE could
be found. In general, it was observed that the
pp|
isomers of DDE, DDD and DDT were more
frequently encountered than their op|
isomers.
The mean total DDT concentration in different
feed samples varied from 0.016 to 0.118 mg kg−1
(Table 3) which was less than those reported by
Kaphalia and Seth (1982), Dikshith et al. (1989)
and Battu et al. (1996). However, Sharma et al.
(2005) detected only pp|
DDT in the range of
0.007 ± 0.005 μg g−1
in concentrate feed samples
collected from Haryana (India).
Dicofol, a DDT analogue and an acaricide, was
found present in the samples of only MSC, LSC,
CSC, WS, LS, oat chunni (OC) and GC. In others,
it could not be detected. The mean concentra-
tion ranged between 0.0305 and 0.3356 mg kg−1
(Table 3). In other monitoring works on feed and
fodder samples for OCPs carried out at different
places, the presence or absence of dicofol residues
was not mentioned excepting Kang et al. (2002)
who detected dicofol in two samples out of a total
of 17 having mean concentration of 0.26 mg kg−1
.
The maximum residue limit or tolerance limit
of pesticides in feed materials have not been set
in India. However, the limiting value (which may
be defined as the concentration of a pesticide in
feed and fodder if fed to lactating animals daily,
the likely residues in milk will be less than their
MRL values and safe for human consumption)
of a pesticide in feed can be derived on the ba-
sis of its legal permissible limit in milk and its
rate of transference from feed to milk. Based on
short-term feeding experiments on buffaloes, the
transfer coefficients of HCH isomers and DDT
Table 4 Number of samples exceeding the limiting value of HCH isomers and total DDT
Samples Pesticides with their limiting value and no. of samples exceeding them
α-HCH (0.12) β-HCH (0.02) γ -HCH (0.12) δ-HCH (0.07) Total DDT (0.10)
Mustard seed cake Nil 19 (10.79%) Nil 3 (1.7%) 12 (6.82%)
Linseed seed cake Nil 4 (4.7%) Nil 1 (1.17%) 2 (2.35%)
Cotton seed cake Nil 4 (10.52%) Nil Nil 3 (7.89%)
Sesamum seed cake Nil Nil Nil Nil 1 (4.54%)
Groundnut cake – – – – Nil
Wheat straw Nil 2 (4.16%) Nil Nil 1 (2.08%)
Gram straw Nil – – – –
Lentil straw Nil 1 (3.85%) Nil Nil 3 (11.54%)
Gram chunni 8 (14.81%) 10 (18.52%) 5 (9.26%) 2 (3.7%) 7 (12.96%)
Pea chunni Nil – – – Nil
Urd chunni Nil – Nil Nil Nil
Arhar chunni Nil Nil Nil Nil Nil
Oat chunni Nil 3 (18.75%) Nil Nil 3 (18.75%)
Rice chunni Nil Nil Nil Nil Nil
Wheat flour chunni Nil Nil Nil Nil Nil
Pashu ahar Nil Nil Nil Nil 1 (6.25%)
Figure in parenthesis denote percentage of total samples analysed; (–) indicates that no sample was found containing residue
of that particular compound
8. 334 Environ Monit Assess (2011) 174:327–335
complex have been recommended (Kalra et al.
1986; Kapoor and Kalra 1988, 1993). Using these
values, the limiting values of different pesticides
in feed were calculated. Thus, the limiting values
of α-HCH, β-HCH, γ-HCH, δ-HCH and total
DDT were found to be 0.12, 0.02, 0.12, 0.07 and
0.10 mg/kg, respectively (Kang et al. 2002). We
have compared the residue data in our samples
with respect to the above limiting values (Table 4).
In case of α- and γ-HCH, only eight (14.81%)
and five (9.26%) samples, respectively, of GC had
concentration higher than the limiting value, and
in all other feed samples, the level was below
the threshold limit. For β-HCH 19 (10.79%) sam-
ples of MSC, four each of LSC (4.7%) and CSC
(10.52%), two (4.16%) of WS, one (3.85%) of LS,
10 (18.52%) of GC and three (18.75%) of OC
contained residues higher than its limiting value of
0.02 mg kg−1
. Only three samples (1.7%) of MSC,
one (1.17%) of LSC and two (3.7%) of GC had δ-
HCH concentration above its limiting value. The
limiting value of total DDT (0.10 mg kg−1
) was
exceeded in 12 (6.82%) samples of MSC, two of
LSC (2.35%), three (7.89%) of CSC, one (4.54%)
of sesamum seed cake, one (2.08%) of WS, three
(11.54%) of LS, seven (12.96%) of GC, three
(18.75%) of OC and one (6.25%) of pashu ahar
samples.
From the results of the present study, it has
been revealed that feeds meant for animal con-
sumption are still containing residues of OC
pesticides to some extent though the levels of
contamination are not much and number of sam-
ples exceeding the limiting value are also very less.
However, regular monitoring of feed samples is
necessary for checking the status of residues since
contaminated feed and fodder act as the main
source of entry of pesticides in animal body. Based
on the results of the monitoring programme, ap-
propriate measures should be taken so that ani-
mal products which are free from residues can be
produced.
Acknowledgements The authors are highly thankful to
the Indian Council of Agricultural Research (ICAR), New
Delhi for providing the financial support and sponsoring
the research work. The authors are also grateful to the
Head, PAR Division and Director, IGFRI, Jhansi, INDIA
for their encouraging support.
References
Battu, R. S., Singh, B., Chahal, K. K., & Kalra, R. L.
(1996). Contamination of animal feed with residues of
HCH and DDT. Pesticide Research Journal, 8(2), 172–
175.
Deka, S. C., Barman, N., & Baruah, A. A. L. H. (2004).
Monitoring of pesticide residues in feed, fodder and
butter in Assam. Pesticide Research Journal, 16(1), 86–
89.
Dikshith, T. S. S., Kumar, S. N., Raizada, R. B., &
Srivastava, M. K. (1989). Organochlorine insecticide
residues in cattle feed. Bulletin of Environmental
Contamination and Toxicology, 43, 691–696.
Gupta, A., Singh, B., Parihar, N. S., & Bhatnagar, A.
(2000). Monitoring of HCH and DDT residues in
certain animal feed and feed concentrates. Pestology,
24(12), 47–49.
Kalra, R. L., Chawla, R. P., Joia, B. S., & Tiwana, M. S.
(1986). Excretion of DDT residues into milk of the
Indian buffalo, Bubalus bubalis (L.) after oral and
dermal exposure. Pesticide Science, 17, 128–134.
Kang, B. K., Singh, B., Chahal, K. K., & Battu, R. S. (2002).
Contamination of feed concentrate and green fodder
with pesticide residues. Pesticide Research Journal,
14(2), 308–312.
Kaphalia, B. S., & Seth, T. D. (1982). Organochlorine
pesticides contamination in some species of fodder
grasses. Environmental Pollution Series B, 3, 231–
237.
Kapoor, S. K., & Kalra, R. L. (1988). Residues of HCH in
milk after its oral administration or dermal application
to Indian buffaloes, Bubalus bubalis (L.). Pesticide
Science, 24, 193–204.
Kapoor, S. K., & Kalra, R. L. (1993). Comparative excre-
tion of DDT analogues into milk of Indian buffaloes,
Bubalus bubalis (L.) following their oral administra-
tion. Pesticide Science, 37, 261–266.
Lovell, R. A., McChesney, D. G., & Price, W. D. (1996).
Organohalogen and organophosphorus pesticides in
mixed feed rations: Findings from FDA’s domestic
surveillance during fiscal years 1989–1994. Journal-
Association of Official Analytical Chemists Interna-
tional, 79(2), 544–549.
Luke, M. A., Froberg, J. E., & Masumoto, H. T. (1975).
Extraction and clean up of organochlorine, organo-
phosphate, organonitrogen and hydrocarbon pes-
ticides in produce for determination by gas liquid
chromatography. Journal-Association of Official
Analytical Chemists, 58(5), 1020–1026.
Nakamura, Y., Tonogai, Y., Sekiguchi, Y., Tsumura, Y.,
Nishida, N., Takakura, K., et al. (1994). Multiresidue
analysis of 48 pesticides in agricultural products by
capillary gas chromatography. Journal of Agricultural
and Food Chemistry, 42(11), 2508–2518.
Pierson, D. A., Hoffman, J. S., Nord, P. J., Gebhart, J. E., &
Frank, C. W. (1982). Distribution of chlorinated pesti-
cides in animal feed components and finished feeds.
Journal of Agricultural and Food Chemistry, 30(1),
187–189.
9. Environ Monit Assess (2011) 174:327–335 335
Prasad, K. S. N., & Chhabra, A. (2001). Organochlorine
pesticide residues in animal feed and fodders. Indian
Journal of Animal Science, 71(12), 1178–1180.
Sharma, V., Wadhawa, B. K., & Stan, H. J. (2005). Mul-
tiresidue analysis of pesticides in animal feed concen-
trate. Bulletin of Environmental Contamination and
Toxicology, 74, 342–349.
Shastry, M. S. (1983). Monitoring of pesticide residues
in animal feeds and animal products. Pesticides, 10, 36–
38.
Singh, R., Kumar, B., Madan, V. K., Kumar, R., &
Kathpal, T. S. (1997). Monitoring of HCH residues in
animal feeds. Indian Journal of Animal Science, 67(3),
250–252.