Earth Observation for Climate - Julian Wilson, Joint Research Centre, institute for Environment and Sustainability, Italy
•
2 j'aime•656 vues

This presentation is from the EPA's FP7 Environment National Information Day 2010. For further information, see http://www.fp7ireland.com/

Recommandé
Recommandé
Contenu connexe
Tendances
Tendances (20)
En vedette
Similaire à Earth Observation for Climate - Julian Wilson, Joint Research Centre, institute for Environment and Sustainability, Italy
Similaire à Earth Observation for Climate - Julian Wilson, Joint Research Centre, institute for Environment and Sustainability, Italy (20)
Plus de Environmental Protection Agency, Ireland
Plus de Environmental Protection Agency, Ireland (20)
Dernier
Dernier (20)
Earth Observation for Climate - Julian Wilson, Joint Research Centre, institute for Environment and Sustainability, Italy
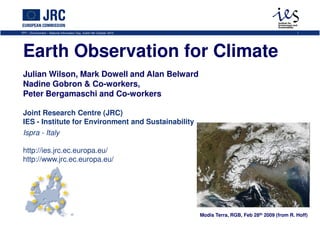
- 1. FP7 – Environment – National Information Day, Dublin 6th October 2010 1 Earth Observation for Climate Julian Wilson, Mark Dowell and Alan Belward Nadine Gobron & Co-workers, Peter Bergamaschi and Co-workers Joint Research Centre (JRC) IES - Institute for Environment and Sustainability Ispra - Italy http://ies.jrc.ec.europa.eu/ http://www.jrc.ec.europa.eu/ Modis Terra, RGB, Feb 28th 2009 (from R. Hoff)
- 2. Topics FP7 – Environment – National Information Day, Dublin 6th October 2010 2 • European capacity for space-based observations of climate study • JRC Research on Essential Climate Variables • CH4 emission inversions using SCIAMACHY • 12 year time series of fAPAR derived from two different sensors (MERIS & SeaWiFS)
- 3. Background FP7 – Environment – National Information Day, Dublin 6th October 2010 3 • Space Council 5# and 6# – Recognised space & Climate Change as key priority – Called on EC to define how GMES services and European space observation archives can contribute most effectively to the provision of data • Competitiveness Council December 2008 Cox and Stephenson 2007, Science Vol 317 – invited EC to foster the Observations implementation of the GMES climate change monitoring to support the EU policies
- 4. European capacity for monitoring and assimilating space based climate change observations FP7 – Environment – National Information Day, Dublin 6th October 2010 4 • Study published as JRC Science and Technical Report • Includes: 1. overview of European capacity 2. gap analysis 3. infrastructure issues 4. programmatic and governance adequacy discussion • Provides a European perspective: participants & contributors included ESA, EUMETSAT, Met Office, ECMWF, national • agencies
- 5. ECV Gap analysis table FP7 – Environment – National Information Day, Dublin 6th October 2010 5
- 6. Europe has the capacity to deliver FCDRs/ECVs FP7 – Environment – National Information Day, Dublin 6th October 2010 6 • Proven capacity in space hardware development / construction, algorithm development and operational generation of a subset of ECVs (gaps do exist) • World-leading capabilities in the reanalysis of climate data and assimilation of these and satellite derived observations to provide high quality analysis of climate and climate change • Relevant and capable institutions, with complementary (though not always synergistic) modes of operation
- 7. Current Capacity for FCDR/ECVs FP7 – Environment – National Information Day, Dublin 6th October 2010 7 • 31 of the GCOS ECVs are measurable through space-based observations • European capacity currently available or commissioned to measure 29 of these ECVs • Around 40% of these 29 are available through end-to-end production (e.g. CCI, some EUMETSAT SAF and GMES Services) – but long-term guarantees for operational production still have to be secured. However: • FDCR/ECV provisioning and reanalysis/assimilation in Europe is based on research funding or performed in the margins of numerical weather prediction (NWP) • Because funding is not from an operational budget line Europe is unable to make the move from research to operations • We are having to de-scope planned activities, even where these are essential and based on proven world-class science. This underplays European scientific capacity, is a handicap to joint implementation and makes it impossible for a climate service to deliver sustained information, as required in any legal or operational setting
- 8. The way forward to operational systems FP7 – Environment – National Information Day, Dublin 6th October 2010 8 • Joint Programme implementation is needed to fill gaps, avoid overlap and promote synergy • Domain-based approaches (atmosphere, ocean and land) should be enhanced by an integrated approach using dedicated assimilation schemes • Increased computing power (computational/storage, bandwidth and skilled personnel) is needed to ensure that coupled Earth System models can be run, and that the spatial and temporal resolution of these can be improved • The improvements should build on established skills centres nationally & at the European level. Effective provisioning of data and information needs a stable financial platform which guarantees sustained support for – a) the space segment making measurements – b) for the processing, product generation and their QA/QC – c) for reanalysis and assimilation strategies to turn these data into policy relevant information
- 9. What Next ? FP7 – Environment – National Information Day, Dublin 6th October 2010 9 • Because activities are funded from many sources the overall amount is difficult to establish. A dedicated study is needed to identify the current levels of public expenditure on climate information provision. From this we can then estimate the budget needed to secure operational climate information services in Europe. • A gap analysis performed on the basis of sensor capacity this may be VERY different to one based on product availability, this will be a topic for future work (maybe in the context of CEOS) • There is a notable difference between the availability of climate relevant products and generation of systematic time-series of GCOS compatible ECVs, future initiatives should acknowledge this and strive to achieve the demanding GCOS standards
- 10. basic principles + objectives of inverse modelling FP7 – Environment – National Information Day, Dublin 6th October 2010 10 monitoring of global and regional CH4 cycle ● anthropogenic sources ● natural sources and their feedback to climate change top down estimates of emissions monitoring of global and regional CH4 cycle ● anthropogenic sources ● natural sources and their feedback to climate change verification Kyoto protocol
- 11. SCIAMACHY - Scanning Imaging Absorption spectroMeter for Atmospheric CartograpHY FP7 – Environment – National Information Day, Dublin 6th October 2010 11 absorption spectra of solar radiation (near-IR) -> high sensitivity also in PBL SCIAMACHY Absorption Kernel
- 12. XCH4 and emissions - seasonal variation FP7 – Environment – National Information Day, Dublin 6th October 2010 12 SCIA TM5 [Bergamaschi et al., J. Geophys. Res., 2009]
- 13. Asia - seasonal XCH4 and emissions FP7 – Environment – National Information Day, Dublin 6th October 2010 13 SCIA TM5 [Bergamaschi et al., J. Geophys. Res., 2009]
- 14. Global Changes in Biosphere Vegetation Dynamics Using MERIS & SeaWiFS data FP7 – Environment – National Information Day, Dublin 6th October 2010 14 • Operational MERIS Level2 products (i.e. MGVI) provide FAPAR daily values at 1.2 km since April 2002. • The retrieval algorithm is physically based using TOA BRF in blue, red and NIR bands as inputs (Gobron et al., 1999, 2001). • Time-composite assigns one representative value over 10-days or monthly period (Pinty et al., 2002). • Remapping code is used by averaging available FAPAR values within 0.5º x 0.5º grid-cell to make global products (Taberner et al., 2004). • MERIS global products are processed at G-POD (ESRIN). • FAPAR from SeaWiFS data from 09/1997 are produced at JRC following same way (Gobron et al., 2001, Mélin et al., 2002).
- 15. 12 years of global monthly FP7 – Environment – National Information Day, Dublin 6th October 2010 15
- 16. Global View FP7 – Environment – National Information Day, Dublin 6th October 2010 16 Annual 2009 FAPAR anomalies at the global scale relative to the period 1998 to 2009 average: The strongest positive anomalies are found in Eastern Brazil and South Africa whilst South America and East Africa exhibit the strongest negative anomalies; the persistent droughts in Southern America, East Africa and Australia are clearly manifest in poor vegetation growth and vigour. 2009 Anomaly Gobron et. al, 2010, FAPAR in ‘State of the Climate in 2009’, M. Willett, L. V. Alexander, and P. W. Thorne, Eds., BAMS
- 17. Global View FP7 – Environment – National Information Day, Dublin 6th October 2010 17 Time series of monthly anomalies averaged along lines of longitude: the presence of a negative trend occurring over a latitude band 30º to 50º in the Southern Hemisphere. This trend is strong enough to yield global monthly negative anomalies for the most recent years. +90 +45 Latitude 0 -45 -90 98 99 00 01 02 03 04 05 06 07 08 09 10 Year Gobron et. al, 2010, FAPAR in ‘State of the Climate in 2009’, M. Willett, L. V. Alexander, and P. W. Thorne, Eds., BAMS
- 18. Global View FP7 – Environment – National Information Day, Dublin 6th October 2010 18 Monthly fAPAR spatially averaged over the globe from 1998 to 2009. 0.015 0.010 0.005 Anomalies 0.000 -0.005 -0.010 -0.015 98 99 00 01 02 03 04 05 06 07 08 09 10 Year Gobron et. al, 2010, FAPAR in ‘State of the Climate in 2009’, M. Willett, L. V. Alexander, and P. W. Thorne, Eds., BAMS
- 19. FP7 – Environment – National Information Day, Dublin 6th October 2010 19 Thank You!