SlideShare une entreprise Scribd logo
1  sur  16
Télécharger pour lire hors ligne
Esri News
for Facilities                                                                                                                     Summer 2012


GIS and The City 2.0
By Jack Dangermond


Seven billion. That number has received a lot        	 This growing recognition of cities as             more efficient consumers of limited resources.
of attention recently as the global popula-          the center of the human world was further           But as our cities become more populated and
tion has grown past this mark. But lost in the       highlighted when The City 2.0 was awarded           more numerous, how do we best manage this
media coverage of this milestone was another,        the 2012 TED Prize. “For the first time in the      complexity?
perhaps even more fascinating, global sta-           history of the prize, it is being awarded not to    	 We need to start thinking about cities in a
tistic: more than 50 percent of those 7 billion      an individual but to an idea,” the Technology/      different way.
people now live in cities, a number projected        Entertainment/Design (TED) committee
to grow to more than 75 percent during this          stated. “It is an idea upon which our planet’s      Reimagining the Canvas
century. In fact, there will be at least 19 cities   future depends.”                                    Fundamental to changing the way we think
in the world with a population greater than          	 Clearly, cities will play an increasingly im-     about cities is a reimagining of the way we
20 million people by the end of the twenty-          portant role in our survival. Cities offer easier   abstract them. Maps are abstractions of ge-
first century. Cities are human destiny.             access to services, and urban dwellers are          ography and have proved to be particularly 


 Tall structures can have a huge shadow impact on a city, as modeled here in CityEngine.
Contents                                        Summer 2012


Cover	
1	   GIS and The City 2.0

Case Study	
4	   City of Las Vegas Implements ParkPAD for Mobile Asset
     Management
5	   Building a University of the Future
                                                              Esri News for Facilities is a publication of the
5	   Cornerstone
                                                              Facilities Management Group of Esri.
8	   Smartphone Application Aids District’s Facilities        To contact the Esri Desktop Order Center, call 1-800-447-9778
     Maintenance                                              within the United States or 909-793-2853, ext. 1-1235, outside
                                                              the United States.
Software	
                                                              Visit the Esri website at esri.com.
9	   What’s Ahead for Mobile GIS in 2012 and Beyond?	
                                                              View Facilities Management online at esri.com/fm or scan the
                                                              code below with your smartphone.
Partner Spotlight	
10	 Lidar Speeds Up Mapping of Bustling Center City           Advertise with Us
                                                              E-mail ads@esri.com.
Solutions
                                                              Submit Content
12	 ArcGIS for Facilities
                                                              To submit articles for publication in Esri News for Facilities,
Technology                                                    contact Karen Richardson at krichardson@esri.com.

13	 Private Clouds: Moving from Hype to Reality (Really!)     Manage Your Subscription
14	 Geodesign Gathers Momentum                                To update your mailing address or subscribe or unsubscribe to
                                                              Esri publications, visit esri.com/manageyoursubscription.
                                                              International customers should contact an Esri distributor to
                                                              manage their subscriptions.
                                                              For a directory of distributors, visit esri.com/distributors.

                                                              Circulation Services
                                                              For back issues, missed issues, and other circulation services,
                                                              e-mail requests@esri.com; call 909-793-2853, extension 2778; or
                                                              fax 909-798-0560.


                                                                                                                         Copyright © 2012 Esri.
                                                                                                                         All rights reserved.
                                                                                                                         Printed in the United States of America.


                                                              The information contained in this work is the exclusive property of Esri or its licensors. This work is protected
                                                              under United States copyright law and other international copyright treaties and conventions. No part of this
                                                              work may be reproduced or transmitted in any form or by any means, electronic or mechanical, including
                                                              photocopying and recording, or by any information storage or retrieval system, except as expressly
                                                              permitted in writing by Esri. All requests should be sent to Attention: Contracts and Legal Services Manager,
                                                              Esri, 380 New York Street, Redlands, CA 92373-8100  usa.
                                                              The information contained in this work is subject to change without notice.
                                                              Esri, the Esri globe logo, 3D Analyst, ArcAtlas, ArcCatalog, ArcData, ArcDoc, ArcEditor, ArcExplorer, ArcGIS,
                                                              the ArcGIS logo, ArcGlobe, ArcIMS, ARC/INFO, ArcInfo, ArcLogistics, ArcMap, ArcNetwork, ArcNews,
                                                              ArcObjects, ArcPad, ArcPress, ArcReader, ArcSDE, ArcSurvey, ArcToolbox, ArcTools, ArcUser, ArcView,
                                                              ArcVoyager, ArcWatch, ArcWeb, ArcWorld, ArcXML, Business Analyst Online, BusinessMAP, CommunityInfo,
                                                              EDN, Geography Network, GIS        Day, MapData, MapObjects, Maplex, MapStudio, ModelBuilder, MOLE,
                                                              NetEngine, RouteMAP, SDE, Sourcebook•America, StreetMap, Tapestry, @esri.com, esri.com, arcgis.com,
                                                              geographynetwork.com, gis.com, and gisday.com are trademarks, service marks, or registered marks of Esri
                                                              in the United States, the European Community, or certain other jurisdictions. CityEngine is a registered
                                                              trademark of Procedural AG and is distributed under license by Esri.
                                                              Other companies and products mentioned herein may be trademarks or registered trademarks of their
                                                              respective trademark owners.


2    Esri News for Facilities  Summer 2012
GIS and The City 2.0              continued from page 1


useful throughout our history. But traditional
maps have limited our ability to manage and
design in a holistic, comprehensive manner.
GIS technology has given us a powerful new
context for extending our traditional methods
of abstracting geography—a new canvas that
includes everything that lies below, on, above,
and around the city, including what exists
inside and outside buildings, as well as how
things connect to the city and how all these
things change through time.

Cities as Ecosystems
Cities are the places where most of us now
spend the vast majority of our lives. They have
in fact become man-made ecosystems—vast              Jack Dangermond at TED 2010 in Long Beach, California (Credit: TED/James Duncan Davidson)
assemblages of interdependent living and
nonliving components—the primary habitat            enhancing a variety of government-citizen          more open participation through visualization,
for the human species.                              interactions involving public information,         better evaluation of proposed scenarios, and
	 The recognition of cities as a habitat for        requests for service, public reporting, citizens   a deeper understanding of the implications
modern man is leading to new approaches to          as sensors, unsolicited public comment, and        of one design over another. Combining the
their management and design. GIS technology         even volunteerism.                                 strengths of data management and analysis
has long been used to map, study, analyze,          	 Geospatial technologies have already             with a strong design and automation compo-
and manage natural ecosystems. It only seems        proved to be effective tools in supporting         nent is fundamental to designing The City 2.0.
logical to manage, model, and design our new        citizen engagement. Intelligent web maps
man-made ecosystem with the same tried-and-         are acknowledged as a catalyst for solving         A New Direction
true tools used for traditional ecosystems.         key challenges in creating a dialog with           Cities are intricate collections of materials,
                                                    informed citizens. As web- and cloud-based         infrastructure, machinery, and people, with
Buildings as Microcities                            GIS continues to evolve and social media           countless spatial and temporal relationships
As our cities are growing in size and complex-      and mobile devices become more pervasive,          and dependencies, and require progressively
ity, so too are the buildings that compose          governments will continue to deliver innova-       more sophisticated tools to help us design
much of the fabric of the city. In effect, many     tive forums through interactive information        and manage them. They are complex systems
buildings and facilities are becoming small         and participatory citizen applications.            where we humans spend an increasing
cities themselves, and they need to be                                                                 amount of our lives.
designed and managed as such.                        Designing The City 2.0                            	 “This idea is capable of inspiring millions of
	 GIS tools, used successfully for many years in     Geography is constantly changing—from             people around the world to contribute to one
fields such as environmental analysis and land-      wind and water erosion, natural climate shifts,   of the biggest challenges and opportunities
scape planning, also support a broad range of        tectonic and volcanic activity, and the domi-     humanity faces,” the TED committee stated
applications inside and outside buildings and        nance and extinction of species and ecosys-       when announcing the award of the 2012 TED
facilities. In fact, GIS can be used throughout      tems. But recent changes to geography as a        Prize. “The City 2.0 is not a sterile utopian
the life cycle of a facility—from siting, design,    direct result of human activities are threaten-   dream but a real-world upgrade tapping into
and construction through ongoing use, main-          ing the survival of many species, including       humanity’s collective wisdom.”
tenance, and adaptation, ultimately through          our own. And while the actions causing these      	 Our challenge is to design our man-made
closing, repurposing, and reclamation.               monumental changes are often deliberate,          ecosystems to achieve the maximum benefit
                                                     much of the change to geography has been          to society while minimizing short- and long-
An Engaged Citizenry                                 an unintentional by-product of poor planning      term impacts on the natural environment. As
Smart cities of the future will be those where       and unsustainable actions—change that I call      an integrative platform for management and
the citizenry is engaged in city design and         “accidental geography.”                            analysis of all things spatial, I believe that GIS
evolution, where we fully leverage the col-          	 In my talk at TED 2010, I introduced the        technology can help meet this challenge.
lective intelligence of the masses and allow         idea of geodesign—a concept that enables          Cities are our new man-made ecosystems,
everyone to actively participate in shaping          architects, urban planners, and others, to har-   and it’s time we start to think about them,
our communities. Today, social media and             ness the power of GIS to design with nature       manage them, and design them as such.
mobile citizen engagement applications are           and geography in mind. Geodesign results in


                                                                                                                         Summer 2012  esri.com/fm       3
City of Las Vegas Implements ParkPAD
for Mobile Asset Management
Founded more than 100 years ago, Las Vegas,       Maintenance began the development and                that the necessary amounts of seed, fertilizers,
Nevada, began as a stopover on the pioneer        deployment of its Park Asset Data Collection         and herbicides can be accurately calculated
trails heading west. Soon it evolved into a       and Data Conversion Program (ParkPAD) to             and purchased. In a related project, the data
popular railroad town and staging point for       replace the legacy MMS. Based on ArcPad              from an earlier tree study was added to the
the many mining operations in the area. In        software, ParkPAD has greatly improved               database so that the parks maintenance staff
1911, the population was about 800 people.        the department’s capability to collect and           could determine water usage requirements
Las Vegas then began to grow in leaps and         manage park assets, because it is fully com-         for each tree based on species, size, location,
bounds, with construction of nearby Hoover        patible with the department’s existing ArcGIS        and so on.
Dam during the 1930s and the beginning of         enterprise system. Field crews can now view          	 In the next stage of the project, an irriga-
its now massive casino industry during the        a digitized image of a park or other venue           tion layer will be created for the database and
1940s and 1950s. Today, the greater Las Vegas     and immediately determine whether the data           will include the locations of irrigation clocks,
metropolitan area is home to nearly two mil-      has already been collected. Getting data in          stations, valves, and controls. This will allow
lion residents.                                   and out of the new system is a quick and easy        the irrigation system repair crews to quickly
	 Maintaining the infrastructure necessary        process, and updates can be performed in             locate equipment when there is a break in
to support a population of this size requires     near real time.                                      the water main or if a valve becomes inoper-
carefully coordinated efforts by the city’s       	 The Parks and Open Spaces Division                 able. In addition, these new base layers will
Department of Operations and Maintenance          is currently working with the Information            make it easier to collect and track the number,
to minimize redundant work and make the           Technologies Department to complete the              location, and condition of assets, such as play-
most of shrinking city coffers during difficult   digitization of the base layers for all the city’s   grounds, shade structures, drinking fountains,
economic times. While the department              parks, landscaped areas, trails, medians,            picnic areas, and benches.
has used ArcGIS software for many years, a        school landscaping, and sports fields. This          	 This new data will be included in the city’s
different vendor’s maintenance management         new parks inventory database has produced            enterprise GIS so that it is available to the
system (MMS) had been implemented to              some immediate cost benefits to the city.            other departments that rely on it. Currently,
collect and manage the assets within its parks    Since Las Vegas is in the Mojave Desert,             these departments maintain their own data-
and related facilities. Because the drawbacks     water conservation is very important. The            sets for park assets, and there are discrepan-
of that particular system were substantial, in    vegetation layers in the database are used to        cies between them. Using the same dataset
2009, the Department of Operations and            determine the square footage of each park so         is particularly useful for the Department of
                                                                                                       Operations and Maintenance, which main-
                                                                                                       tains the parks, and the Department of Parks,
                                                                                                       Recreation and Neighborhood Services,
                                                                                                       which schedules outdoor events, maintains
                                                                                                       sports fields, and manages the use of picnic
                                                                                                       and other recreation areas.
                                                                                                       	 “Our use of GIS continues to grow,” says
                                                                                                       Joel Hillhouse, GIS analyst at the City of
                                                                                                       Las Vegas. “In the near future, we will be
                                                                                                       posting our parks data on the city website
                                                                                                       for residents and visitors so that they can
                                                                                                       find information and make reservations for a
                                                                                                       specific site using an interactive park finder.”


                                                                                                       For more information,
                                                                                                       contact Joel Hillhouse,
                                                                                                       GIS analyst, City of Las
                                                                                                       Vegas (e-mail: jhillhouse@
                                                                                                       lasvegasnevada.gov).
  American Park showing the base layers and assets added over the aerial image, which
  All
helps those using the map understand what they are looking at.


4    Esri News for Facilities  Summer 2012
Case Study


Building a University
of the Future
The University of Calgary in Alberta is considered one of the top
research universities in Canada. It has more than 29,000 students and
more than 4,000 academic and support staff. The university began
using GIS for academic research 20 years ago and has now standard-
ized the management of its geographic information with Esri technol-
ogy. Realizing the value of geographic analysis for informed decision
making, it has expanded the use of GIS to manage not only academic
data but also institutional and administrative data.

Running a Smart Campus                                                                            Cornerstone
The main campus has more than 20 academic buildings occupying                                     Shelli Stockton
more than 200 hectares, which is larger than Calgary’s entire down-                               Global Facilities Industry Manager, Esri
town core. In 2008, the university embarked on a $1.5 billion campus
expansion, the largest in its history. Knowing that implementing a
project of this size and continuing to maintain so many buildings
would require a comprehensive understanding of every aspect of the
campus—its landscape, people, buildings, and infrastructure—univer-
sity planners relied heavily on ArcGIS and geodesign principles to help        As a reader of Esri News for Facilities, we hope you will
analyze and evaluate the impacts of design alternatives early in the
                                                                               come to this year’s Esri User Conference (Esri UC), where we
development process.
                                                                               will be addressing some of the biggest advances and trends
	 The university maintains institutional data used for facilities manage-
                                                                               that are changing the way facility professionals use geospa-
ment in a central data warehouse. Esri’s ArcGIS for Server serves as
                                                                               tial technology.
the front-end technology that pulls data from ARCHIBUS, Esri partner
(Boston, Massachusetts) and creator of a solution used to manage spa-          	 Of the 14,000 attendees at the Esri UC, you’ll find
tial data and real estate, infrastructure, and facilities information. These   representatives from nearly every industry. This is where
recently integrated systems enable users to visualize and analyze both         you learn about what your peers are doing and how you can
interior and exterior building data that’s important to understanding          apply those best practices to your own work. It’s where you
how the campus currently works. Defining how the landscape works               get technical training, contacts, and exposure to the best
and evaluating whether it is working well are key tenets of the geode-         geospatial products and services available. Esri even offers
sign framework for landscape change. Evaluation of current processes           personalized tech support, so you can discuss your biggest
allows proper “baselining” and the identification of key metrics against       challenges with our experts.
which design alternatives can be measured. The result is improved site
                                                                               	 Facilities-focused sessions will take place on July 24 and
planning and facilities design optimized for cost-efficient management
                                                                               25, 2012, at the Esri UC. Sessions include the following:
and sustainability well after the initial project work is complete.
	 Understanding the physical constraints of a property is equally
                                                                               •• Facilities Sustainability: Planning, Carbon Footprint, and
important. During site assessments, planners and landscape architects
                                                                                  LEED Compliance
alike need to know how water flows across a property. This question
                                                                               •• Enterprise Facilities GIS for Asset Management and Routing
came up early in the design phase, before construction, when the facili-
                                                                               •• Data for Facilities and Floor Plans: CAD, BIM, and Lidar
ties management team approached the university’s GIS team to create
                                                                               •• Interior Space Mapping and Assessment
a campus drainage basin model. While there are no drastic slopes on
                                                                               •• Interior Space Data Collection and Management for a
the campus, there are low spots. Coupled with Calgary’s high water
                                                                                  Facilities Basemap and Planning
tables, understanding these environmental issues was an important
design constraint. If a basement is built in a particular location, the
probability of flooding may be higher. Knowing where rainwater would           Don’t miss the technical workshop Implementing ArcGIS
drain allowed the team to see where flash floods might occur and then          for Facilities with Intelligent Maps & Apps or the lunchtime
mitigate any potential dangers.                                                Facilities/AEC Special Interest Group (SIG) meeting and the
	 Understanding the terrain—the physical lay of the land—and                   FM Evening SIG meeting on Wednesday, July 25.
how it affects drainage across this particular landscape has proved            	 You can’t get this combination of practical insight and
to be invaluable. The drainage basin model has been leveraged in               technological inspiration anywhere else. I hope you can join
planning new building sites and the expansion of the storm sewer              me this July in San Diego.
                                                                                                                             continued on page 6


                                                                                                                 Summer 2012  esri.com/fm     5
Building a University of the Future                   continued from page 5


system, including an innovative research pro-       models were used to track the sun’s effect
ject for filtering surface water before it enters   on a glass exterior compared to a solid wall
the sewer system.                                   structure. This method of optimizing the
                                                    heating mechanics of buildings is an impor-
3D Data to the Rescue                               tant consideration in an area as far north as
The team combined light detection and               Calgary, where sun angles change drastically
ranging (lidar) data with high-resolution,          depending on the season. In the summer, the
orthorectified aerial photographs to create         sun is high, creating narrower shadows; in
the drainage model data. ArcScene allowed           the winter, the reverse is true. Simulating 3D
decision makers to view and process the             shadow effects based on sun angle allowed
data in 3D while analyzing the effects of new       team members to calculate just how long a            campus and allows it to conserve water by
construction sites on the existing grounds.         building would sit in shade at any time of year,     reducing overlap and avoiding spraying water
	 Using lidar to map the campus allowed the         enabling decisions to be made on the heating         on roads and pedestrian walkways.
team members to look not only on the ground         needs and estimated costs to maintain the
but in the trees, as well. They recorded and        comfort level of that specific building.             Coordinating Solutions
processed the height of every tree on campus        	 As with many GIS projects, the develop-            The geodesign process opened many new
to provide even more information neces-             ment of one application often generates              avenues to explore to increase efficiency
sary for relandscaping after the expansion          additional benefits. With the surface models         around campus, even in areas where it wasn’t
project, as well as to understand the position      in place and the building sites located, there       expected. In a synergistic move with the new
of shadows on potential buildings. Armed            was an urgent need to model the campus               construction, the information technologies
with this information, the team was able to         irrigation system. An application was devel-         (IT) department also used ArcGIS to consoli-
optimize the planting of five trees for every       oped to help map the changes caused by               date several computer centers where remote
tree removed during construction, along with        the construction. The irrigation model also          computer systems were once maintained. The
native, low-water vegetation, helping the           provided the ability to monitor water usage          consolidation freed up new space for faculty
team achieve greenhouse gas and water use           and maintain asset inventories. This innovative      to use and has led to better communication
reduction goals.                                    application created a model for managing             and system coordination across campus. It
	 Once the surface models were completed,           8,500 sprinkler heads across campus and has          also allowed a reduction in utilities costs for
the team generated 3D building models               helped grounds personnel better understand           electrical and cooling systems.
to use for shadow simulations during the            and manage the system. Knowing the flow              	 “Using GIS as a decision-making tool is
next construction phase. Traditionally, the         rate and tilt angle of each sprinkler, the           a smart way of gathering all the things you
models have been leveraged to ensure that           university is now able to calculate the volume       already know and placing them in a single
new buildings do not obstruct the views of          of water it sprays, as well as the area it covers.   spot so you can see the entire picture,” says
existing buildings. In this case, the shadow        The application can be used for the life of the      Tom McCaffrey, GIS coordinator, University of

      The interactive
room finder provides
         the ability to
determine the user’s
 current location and
 find the best path to
    a new destination.


6     Esri News for Facilities  Summer 2012
Case Study


                                                                                                        The University of Calgary uses ArcGIS to
                                                                                                       manage a $1.5 billion expansion and maintain
                                                                                                       the facilities on its 200-hectare campus.


Calgary. “Understanding each layer of data as a     virtually eliminated the need for manual roof       and helps them save time.
separate entity is one thing; combining several     measurements that cost both time and money,         	 The interactive room finder will soon
layers together to get a coordinated solution       as well as pose a potential safety risk.            become available on mobile devices. Users
to a complex problem is a completely different      	 From a risk management perspective, the           will be able to take a picture of a wall marker
scenario. It’s the difference between thinking in   university has also used ArcGIS to enhance          to determine their current location and then
two dimensions versus thinking in three or four.”   public safety. Using a current model of the         enter their new destination. The map will show
	 This understanding of how ArcGIS can              campus and incorporating up-to-date floor           several route options—shortest path, indoor
be applied to different problems led the IT         plans, emergency preparedness and evacu-            or outdoor routing, elevator access for the
telecom group to reach out to the GIS team          ation plans were developed. Models and              handicapped, or stair access for those who
for help creating an application that would         processes were discussed with local authori-        want more exercise.
track telecom network lines, utility corridors,     ties and emergency responders to generate           	 Another future project will use adminis-
wiring closets, and utility shafts throughout       a map standard that was distributed to              trative data to help students select classes
the campus. While general maintenance for           these stakeholders. The safety team created         based on spatial proximity. An application is
utilities and computer networking systems           different scenarios and determined several          being developed that will allow students to
can be overwhelming if left unchecked, the          possible routes for building evacuations.           enter their ID numbers and generate maps
ArcGIS for Server web-based application,            These plans were posted on a central website        that show their classroom locations, as well
when completed, will serve up 3D diagrams of        to help fire wardens understand the proper          as the proximity to the next class, based on a
the networks that administrators can edit and       evacuation protocols. Future plans to inte-         specific time and day. This will help students
analyze at any time. Service technicians will       grate live security camera feeds into a secure      familiarize themselves with the campus and
also be able to trace, track, and repair faulty     campus web dashboard would allow the crea-          select a schedule that offers reasonable travel
wires and equipment as these tasks are neces-       tion of a mobile command and control center.        times between classes.
sary. The system will enable them to monitor        ArcGIS was even used to design external             	 “GIS technology offers endless oppor-
real-time data, plan networks, and prevent          lighting models for the university’s safety walk    tunities for our processes to grow,” says
costly technical problems.                          programs. These models estimated ground             McCaffrey. “Processes that used to take
                                                    illumination based on the type of light fixtures    weeks can now be done in minutes. Being
Improving Asset Management                          and any interference caused by vegetation or        able to see the entire picture at once is an
and Reducing Risk                                   building shadows. Maps were then generated          option we’ve never had before. GIS allows us
The university currently needs to renew and         and given to grounds personnel to take cor-         to plan at a much higher level than we could
maintain the exterior roofs of more than            rective measures in illuminating unsafe areas.      have ever imagined. Now, we look for new
90 buildings on several different campus sites.                                                         ways to view scenarios and come up with
To make this process more efficient, the GIS        Enhancing the Campus                                better ideas to manage them.”
team created a web mapping application              Experience                                          	 With all the efficiencies gained in their
that allows editing, updating, measuring, and       To help students and visitors easily find their     research, institutional, and administrative
reporting on government funding spent on            way around campus, the university developed         processes using Esri technology, the University
reroofing the campus. Using ArcGIS, the team        an interactive room-finder application using        of Calgary earns an A for geodesign and is well
is now able to more effectively track life cycles   institutional data. Users can input the building    on its way to becoming a university of the future.
and warranties of the roofing materials, which      name and room number they wish to find, and         	 For more information, contact Tom
can potentially lead to thousands of dollars        the application generates a detailed map            McCaffrey, GIS coordinator, University of
in savings on roofing jobs. Data on structures      showing the floor plan with the desired room        Calgary (e-mail: tmmccaff@ucalgary.ca).
reported to the government is now docu-             highlighted. Visitors can look up their destina-    For more information on how you can put
mented using an accurate spatial and tempo-         tion using the online tool and determine            geodesign into practice, contact Mr. Shannon
ral method that provides strong accountability      the nearest parking area before arriving on         McElvaney, Esri (e-mail: smcelvaney@esri
for how government money is spent. GIS has          campus. This enhances visitors’ experience         .com), or visit esri.com/geodesign.


                                                                                                                         Summer 2012  esri.com/fm       7
Smartphone Application Aids District’s
Facilities Maintenance
By Jim Baumann, Esri Writer

Students and faculty in the Los Angeles              technology and provide our community with
Unified School District (LAUSD) can report           an intuitive tool that allows them to easily
graffiti, broken benches, or other repair            document maintenance issues and send those
issues using a smartphone application that is        reports directly to us so that we can resolve
integrated with the district’s GIS.                  them,” said Lu. “As an added benefit, by
	 LAUSD is responsible for educating more            using the application, students and faculty
than 675,000 K–12 students annually and is the       members of LAUSD are provided with a sense
second-largest public school district in the         of ownership while building community pride.”
United States. The district manages facilities       	 CitySourced uses Esri’s ArcGIS application
that include 1,065 K–12 schools; more than           programming interface (API) for smartphones
200 education centers, adult schools, and            in the LAUSD Service Calls application so that
occupational skill and learning centers; and         the school district can integrate the volunteered
dozens of warehouses and storage yards               data from the incident reports with its authorita-
within the district’s 710 square miles.              tive ArcGIS database. This helps the school
	 The district has used Esri’s GIS software          district keep the GIS database up-to-date for its
since 1990 for administrative tasks including        IBM Maximo asset management system.
student enrollment forecasting and analysis,         	 Kurt Daradics, director of business devel-
school boundary maintenance, student safety,         opment at CitySourced, said, “The LAUSD
disaster planning, and facilities operations         Service Calls implementation at LAUSD
and management. As additional applications           is an end-to-end solution. Incidents are
were added, the GIS gradually evolved into an        recorded on the mobile devices and sent to
enterprise system.                                   the CitySourced servers hosted by Microsoft
	 “GIS has played a big role on the administra-      Azure. Our servers route the issues directly
tive side of our operations,” said Danny Lu, busi-   into LAUSD’s IBM Maximo asset management
ness analyst for LAUSD. “As we continued to          system as service requests, where they are
expand our use of the technology, we realized        reviewed and subsequently resolved by the
that there were some commercial applications         district’s maintenance department.”
that could be easily integrated with ArcGIS and      	 Daradics indicated that the LAUSD Service
would fit into our existing workflow.”               Calls application will eventually be able to au-
                                                                                                            smartphone application integrated with
                                                                                                            A
	 Upkeep of the numerous LAUSD facilities            tomatically query the operational asset layers       the Los Angeles Unified School District GIS
requires an army of administrative, mainte-          in the ArcGIS database so that the asset ID can      lets students and faculty members report
nance, and technical staff members, who are          be determined. The ID will then be attached to       graffiti or other repair issues.
continually evaluating and processing the            the asset specified in the incident report sub-      is required, a work order will be generated,
many service requests submitted each day.            mitted by the LAUSD community member. This           prioritized, and routed to the appropriate
The district implemented a data collection           will allow all information related to the asset      department for action.
system that allows campus staff to easily            (maintenance history, age, and replacement           	 According to Lu, the system also provides
report nonemergency issues. This relieves the        costs) in the GIS database to be automatically       feedback to the person or persons report-
operations department from some inspec-              retrieved so the school district can use its GIS     ing the complaint. When a work order is
tion and reporting responsibilities and lets it      to better manage and maintain its assets.            generated as a result of a service call, the
concentrate on the repair and maintenance of         	 The LAUSD Service Calls application can be         asset management system automatically
the school district’s assets.                        downloaded for free to the user’s smart-             sends a response to the sender, indicating
	 In 2010, the district contracted with Esri         phone. When reporting an incident, the user          the incident report has been received and
partner CitySourced to implement LAUSD               is prompted through a series of drop-down            assigned. Students and faculty can use the
Service Calls, a smartphone application per-         lists to specify the incident location, type,        CitySourced application to search for the calls
mitting LAUSD students and faculty to report         required maintenance, and description. This          they have placed. Under My Reports, they can
issues related to the repair and maintenance         report and accompanying photograph is sent           view the status of an incident. This feedback
of school facilities, such as graffiti, broken       to LAUSD’s asset management system, where            loop demonstrates to the community that
benches, or damaged sprinkler systems.               it is reviewed by a moderator to determine           LAUSD is aware of and is working to resolve
	 “We wanted to take advantage of today’s            the required course of action. If maintenance        its concerns.


8     Esri News for Facilities  Summer 2012
Software


What’s Ahead for Mobile GIS
in 2012 and Beyond?
A Conversation with David Cardella,
Product Manager for Mobile Technologies at Esri

                      Esri’s ArcGIS for             Roundy: Was that unexpected?                      would have thought we’d be where we are
                      smartphones and                                                                 now. Over the next several years, I see a
                      tablets, including the        Cardella: In a sense, it was. I expected some     few pervasive platforms emerging. In North
                      new Android application,      non-GIS professionals to download the ap-         America, I see Android and iOS gaining trac-
                      are proving popular with      plication because it’s in the Android Market,     tion among consumers and in the enterprise. I
                      both GIS and non-GIS          but not in the numbers that we’ve seen.           believe Windows Phone 7 will start to increase
                      professionals. Esri writer    Our primary focus was to allow our existing       in usage as well, especially in European
                      Leslie Roundy spent a         customers to get their data on the device. But    markets. There might be one or two emerging
few minutes talking with David Cardella, prod-      non-GIS professionals are using it to discover    mobile platforms that share the limelight with
uct manager for mobile technologies, about          all the maps we host on ArcGIS Online. Our        iOS and Android. I certainly see the move-
how mobile applications, including ArcGIS           customers like that they can get their data on    ment to tablet devices replacing desktops in
for Android, will be used by Esri customers         their devices. And the application’s users like   homes. I don’t think we’re there yet, but we’re
and what lies ahead for mobile development          both the data and maps that Esri hosts plus       moving in that direction. With smartphones
at Esri.                                            the authoritative maps and data our custom-       being so conducive to browsing the web,
                                                    ers provide. They like to be able to get at       there are some households that already use
Roundy: What does the ArcGIS for Android            different types of data. The application allows   their smartphone as their primary means
application mean to Esri software users?            them to access the ecosystem of maps that         to connect to the Internet. As a company,
                                                    we have online, as well as any data that our      we’re going to closely track mobile technol-
Cardella: All our mobile solutions, not just        customers want to share.                          ogy trends, study what this means to our
those specific to Android, are essentially a                                                          users, and determine where they’re going to
window into our users’ GIS. This allows them        Roundy: What’s in store for mobile develop-       demand their GIS be in the next few years.
to extend the reach of their GIS out into the       ment at Esri?                                     Our job will then be to develop the best tech-
field or even down the hall, outside their office                                                     nology to suit their organization’s needs.
space. Having ArcGIS on mobile devices              Cardella: We’re finding that these mobile
means it’s much easier to do this, especially       platforms, iOS and Android especially, are be-
on smartphones and tablets. These devices           coming much more pervasive in enterprises as
are pervasive and prevalent in the consumer         well as with consumers. Consumers are using
industry, but we’re seeing organizations            these devices to access maps and location-
implement and integrate them as well.               based services. In terms of how Esri wants to
                                                    move forward, we want to support ArcGIS and
Roundy: Is there a typical user for these           GIS capabilities on the most popular mobile
applications?                                       platforms. So as new platforms appear and
                                                    become popular, we’ll build on them as well.
Cardella: Since ArcGIS for smartphones              Until then, we’ll continue to build more and
and tablets was launched, we’re finding that        more functionality into existing platforms.
non-GIS professionals are downloading it.
While we intended it for GIS users as a more        Roundy: Where do you think mobile technol-
convenient way to get their data on these           ogy will be five years from now?
devices, we’re finding that because of the
accessibility of the various marketplaces and       Cardella: When I look back five years ago,
application stores, it’s really reaching a large    where we were with mobile, both within the
number of people outside our traditional            consumer market and within GIS, I never
customer base.


                                                                                                                      Summer 2012  esri.com/fm      9
Lidar Speeds Up Mapping of Bustling Center City
The City Uses a Blend of Robotics and GIS for an Innovative Project below Market Street

Center City in Philadelphia is a confluence
of transportation, shopping, business, and
government agency activity, with several
multilevel spaces (including underground)
within a few blocks. The fifth biggest city
in the nation, Philadelphia also boasts the
third-largest downtown population. The City
of Philadelphia is committed to encourag-
ing business and real estate development
and has embarked on an innovative project
to build up the area while at the same time
making certain the downtown remains ready
for business every day.


                                                                          expand the city ef-          	 A site assessment and requirements
                                                                          fectively, staff need a      validation was conducted at the client site
                                                                          complete view of the         to plan for collecting the data necessary to
                                                                          infrastructure—both          help the city. The goals of this activity were to
                                                                          inside and out—of            validate deliverable requirements and define
                                                                          buildings, railways,         data collection specifications; identify project
                                                                          and surrounding areas        logistical support requirements; discuss and
	 PenBay Solutions, an Esri partner headquar-                             for their facilities man-    validate project staging, access, and schedul-
tered in Brunswick, Maine, was contracted         agement, public transit, public safety, space        ing dependencies; and visually inspect project
by the city to provide facility management        planning, and real property departments.             areas of interest.
mapping services for a pilot project aimed                                                              	 Upon completion of the site assessment,
at testing the effectiveness of a total 3D GIS    Understanding from                                   a detailed list was generated of priorities,
solution. This service included interior data     the Inside Out                                       points of contact, access dependencies, and
collection using an innovative robotic plat-      The city wanted to understand its building infra-    geographic proximity that allowed the crea-
form employing 3D lidar. The robotic platform     structure better. It was interested in seeing the    tion of a project plan and schedule to capture
collected thousands of data samples as it was     relationship between pedestrian concourses           the data. Center City facilities are complex
guided by a surveyor through the buildings.       with platforms, corridors, stair locations, and      and have a high volume of pedestrian traffic.
The data was precisely geolocated to a point      ramps; ingress and egress points; emergency          Minimal survey time and disruption were of
on a high-resolution map of the interior space.   access and air vent facilities; and connections      high importance to the city. The decision was
This allowed PenBay staff to develop spatially    between levels. To effectively analyze and           made to operate a two-person crew on-site
accurate floor map data of the underground        manage this critical public infrastructure, it       under the control of a project manager. This
infrastructure that connects several notable      needed access to accurate and comprehensive          plan optimized the use of PenBay and client
buildings along Market Street in Philadelphia.    spatial data information. This included data         staff so that there would be minimal impact
	 To effectively serve the city, including this   about space, like rooms and how they are being       on building occupants and client resources.
bustling area, municipal government staff rely    used, as well as data about assets, such as fire
on their GIS, which is based on ArcGIS. Like      extinguishers and other components found             Open during Construction
most traditional GIS installations, however,      within the rooms. Images had to be collected         Once the dates for the survey visit were
theirs did not include data for the insides of    to guide anyone who needs to access a space,         determined (the survey itself took place in
the Center City buildings or the vast infra-      such as public safety officials, so they can get a   fall 2010), PenBay started the logistics neces-
structure under the streets. To maintain and      real sense of what the space looks like.             sary to mobilize the equipment and staff


10   Esri News for Facilities  Summer 2012
Partner Spotlight


needed to execute the data collection phase                                                        building information system data model
of the project. Upon arrival at the site, the                                                      (BISDM)-compliant dataset that included CAD
survey team closely coordinated its collection                                                     (AutoCAD) and 3D BIM (Revit) files of the area
activities with the client.                                                                        of interest and a primary deliverable of an
	 The robot PenBay surveyors used was                                                              ArcGIS geodatabase. Using ArcGIS for Server
pushed through each hall and room at a                                                             and the geodatabase, city staff have access to
normal walking pace. Lidar was used by the                                                         the data files easily over the web.
robot to measure the distance to each object                                                       	 A 3D video dataset was also collected for
by illuminating the target with light from a                                                       the entire captured area. This is of particular
pulsating laser. Data points were collected                                                        interest to public transit and the public safety
illustrating where every object in the space                                                       community for planning and preparedness
is located, from walls and doors to desks and                                                      workflows, which provide assistance to facili-
chairs. The robot also took spherical images                                                       ties managers in condition assessment and
with a camera that takes 360-degree pictures     square feet of designated infrastructure. The     asset inventory.
inside the building and then georeferences       survey provided the city with a clear and         	 Through this pilot, PenBay was able to
them. This provides a continuous image of the    accurate view of how underground infrastruc-      demonstrate how critical deliverables can be
space that can give a more accurate represen-    ture links to the aboveground buildings and       created to support the city facilities manage-
tation of the real buildings.                    roads. The combination of GIS and robotics        ment initiative using GIS and lidar. Space
	 Since data collection happened mostly          provided the ability to measure pertinent         definitions were defined, including where
at night to keep with Center City’s mission      space in a fraction of the time it takes with     boundaries such as hallways and rooms begin
of not impacting the community, security         traditional collection methods. Staff took        and end, accurately on maps; floor plan data
escorts were provided by the city’s public       only 20 hours to collect all the data necessary   was captured to represent interior space and
transit agency, SEPTA, for safety as well        for the pilot project.                            structure accurately; and facility surveys were
as to provide unencumbered access to all                                                           performed quickly, safely, and cost-effectively.
areas, such as the subway system and secure      One Cloud—Many Datasets                           For more information, contact Stu Rich at
buildings. In total, PenBay collected 340,000    PenBay provided this data to the city in a        SRich@penbaysolutions.com.


New E-book for
Facilities Managers
The Role of GIS Technology in Sustaining the Built
Environment
A new e-book is available for anyone responsible for the form
and condition of the built environment—regulators, policy
makers, facility designers, owners, and managers. The e-book
was produced to help connect the dots between the number
of reports published over the past 14 years on the state of the
capital and residential facilities industry in the United States, as
well as between everyone’s experiences working for and with
the industry. The e-book also provides a cogent and compel-
ling argument for using GIS as the enabling technology for
better communication and data interoperability. Trends over
the past 30 years have not been favorable for the long-term
sustainability of the built and natural environments. This book              LEED AP), as well as a certified planner (AICP) and GIS
proposes the use of GIS as a means to achieve required stew-                 Professional (GISP), with nearly 14 years’ project experience
ardship, sustainability, and savings for the built environment.              shaping and managing the built and natural environments.
	 The e-book is authored by Patrick Wallis, a project man-                   His technical expertise is in facilities acquisition, real estate
ager with Esri who provides technical expertise in support of                management, municipal and master planning, economic
facilities management, master planning, ports, and maritime                  analysis, and GIS.
projects. He is an architect and designer by training (M.Arch,               	 Read an excerpt of the e-book, which is available on the
                                                                             Esri Facilities industry page at esri.com/facilities.

                                                                                                                    Summer 2012  esri.com/fm    11
Solutions


ArcGIS for Facilities
By Shelli Stockton, Esri Global Facilities Industry Manager


Do you know what you don’t know about your        the convergence and interoperability of BIM,     •• Facilitate better planning and analysis
building, campus, or base? If you’re looking      these specific FM technologies, and GIS.         •• Allow efficient sharing of information in
at your building or campus as a group of          	 The key to developing true insight into           and out of the field, providing a com-
disparate objects as opposed to seeing it as      our complex and dynamic world is creating           prehensive view of operations
an integrated, functional system of interde-      a framework of understanding. We need to         	 Smarter facilities will result from the
pendent parts, you don’t.                         take many different pieces of past, present,     convergence of BIM, GIS, and the additional
	 BIM and specific facilities technologies like   and future data from a variety of sources        FM system technologies mentioned above.
enterprise asset management (EAM), build-         and merge them into a single system. GIS is      These tools and technologies will help pri-
ing automation systems, computer-aided            uniquely positioned to do this. Already widely   mary facility stakeholders and users improve
facility management (CAFM), and integrated        used by planners, engineers, and facility man-   decision-making capabilities, the time it takes
workspace management systems (IWMS)               agers, GIS helps you capture, store, analyze,    to make these decisions, and the reliability of
provide great amounts of detailed data on a       and use all forms of location-referenced data    the results. These benefits will translate into
myriad of items, from the smallest screw to       about where people live and work.                recognizable and, in many cases, dramatic
the largest HVAC system, yet have no ability      	 GIS enables a framework for smart design       increases in cost efficiencies, reductions of
to tell you if they are located within the same   and management. Users can inventory and          risk, and increased facility sustainability and
proximity so that it would make sense to have     display large, complex spatial datasets and      longevity.
the maintenance worker you send out handle        use them to analyze and manage issues.           	 To make this even easier, the ArcGIS for
the reported problems with both. Or that inci-    Whether at a single campus or base or across     Facilities system includes a series of tem-
dences of crime have spiked in an area where      an entire organization, the effect of various    plates for facilities and a data model so facility
outdoor lighting fixtures are old and blocked     factors on each other can be studied, moni-      managers can integrate their facilities data
by overgrown bushes. Or that, over time, your     tored, and measured.                             into one standard format, apply cartographic
CPR-certified employees have all ended up on                                                       rules to the data so it is easy to view and
one floor, leaving three others without access    With GIS, you can do the following:              understand, and make the data easily acces-
to that resource. Smarter facilities—those                                                         sible to others in their organizations. For more
that are safe, secure, energy efficient, and      •• Streamline asset information: collection,     information on these concepts and how GIS
optimally operated and utilized—result from          dissemination, maintenance, and use           helps facility managers, visit esri.com/fm.


12   Esri News for Facilities  Summer 2012
Technology


Private Clouds: Moving from
Hype to Reality (Really!)
by Victoria Kouyoumjian, Esri Business and Technologies Strategist

 Back in 2008, the term cloud computing was
 barely a glint in the eye of most technology
 companies. Perhaps they used SalesForce
.com and Gmail, but tossing around the cloud
 terminology wasn’t really de rigueur. Now
 it’s hard to imagine tech discussions without
 some reference to it at least once in the
 conversation. Seems like it’s everywhere—or
 at least the terminology is.
 	 In 2009, Esri hitched its geowagon to
 Amazon Web Services (AWS) as its primary
 cloud provider. But the general consumer
 audience was much more familiar with
 shopping experiences through Amazon.com
                                                        The Cloud Adoption Trend
 rather than cloud hosted services off of AWS.
 Fast-forward less than three years, and things
 certainly have changed. AWS has established            the private cloud may be the only choice          coalition of EMC, Cisco, and VMware—to
 itself as separate and different from Amazon.          when attempting to leverage at least some         successfully test and certify ArcGIS on its
 com, with a brand synonymous with cloud as             of the benefits of the cloud computing            private cloud infrastructure appliance. Vblock,
 a globally known public cloud infrastructure          “skyscape.” Hosting data and applications          as it is known, provides the storage, network
 service provider. And in 2010, Esri announced          off premises in a cloud provider’s data center,   switches, virtualization layer, and compute
 the availability of ArcGIS Online, initially           potentially out of the country or in a seem-      capacity that many organizations will find
 supported by AWS infrastructure under the              ingly unknown location, might be legally          attractive as a bundled private cloud platform,
 hood, to bring the ubiquity of a public cloud          prohibited or verboten by organization re-        in a nearly plug-and-play capacity.
 platform to the geospatial community.                  quirements and politics. This growing interest    	 Esri is dedicating significant investment,
 	 At the same time that public clouds were             in leveraging the private cloud has not gone      research, and development into public and
 moving into mainstream business, a paral-              unnoticed by Esri, and it’s moving quickly to     private cloud offerings and providers and
 lel current of a cloud trend was emerging:             provide solutions for this demand.                will continue to do so, going forward. It is
 private clouds. Initially, there was (and still is)    	 Portal for ArcGIS allows any organization to    without question that cloud computing has
 a lot of back-and-forthing on the definition           stand up its own customized ArcGIS Online,        the potential to be a disrupting trend, upset-
 of private cloud, and arguments around the             to create a unique geographic content             ting traditional technology models, and yet
 private cloud notion as simply a rebranding            system; the system may be on premises,            simultaneously demonstrating the potential
 of an organization’s existing data center—             within privately owned data centers, or man-      for a promising boon. And what about you?
 infrastructure hosted on premises behind               aged by Esri, behind configured firewalls, to     Where do you and your organization stand “in
 the firewall. But with the advent of cloud             provide more control over security or meet        the cloud”? Private, public, hybrid, or none of
 computing, organizations are now exposed               regulated restrictions.                           the above?
 to some of the technologies that enable the            	 Available in Q2 2012, ArcGIS Online for
 core characteristics and benefits of cloud             organizations carves out a private community
 computing: the idea of a self-service portal           cloud for any company, business, group,
 for their customers or staff and the virtualiza-       organization, or agency. Although hosted
 tion of servers—that is, the ability to create         in public off-premises infrastructure, the
 multiple “virtual machines” from one physical          services and data are specific, secure, and
 server—affording increased optimization of             isolated to only the members of the organi-
 underutilized infrastructure, ratcheting up            zational account, but with access to public
 server optimization to 75 percent or more,             services, hybridizing the public and private
 from an average of 25 percent.                         cloud seamlessly.
 	 In fact, for many businesses and agencies,           	 Most recently, Esri paired up with VCE—a


                                                                                                                          Summer 2012  esri.com/fm    13
Geodesign Gathers Momentum
Two-Day GeoDesign Summit Focuses on Geodesign Technologies and Practices
By Carla Wheeler, Esri Writer


The term geodesign, once hard to define, is
becoming part of the vernacular in the design
field. That astute observation opened this
year’s GeoDesign Summit, a gathering of
professionals interested in using geospatial
technologies to arrive at the best and most
sustainable design solutions.
	 The theme of the summit, Geodesign in
Practice, went to the heart of geodesign’s
ultimate goal: finding innovative solutions to
the most pressing challenges by fusing design
processes with geospatial technologies. In
other words, geospatial technologies will
provide the analytic capabilities necessary
to evaluate different options and the tools to
collaborate as these alternatives are weighed.
	 “This is not just the classic design field,”
Esri president Jack Dangermond said during a             The audience at the GeoDesign Summit heard from more than 30 speakers.
talk that welcomed to the summit geodesign
practitioners from a diverse range of fields            through map overlays and integration and                design and GIS professionals, and even
and industries including urban planning,                modeling to create knowledge of how things              marine scientists. Speakers delivered a
architecture, transportation, utilities, and            are working. One of the great contributions             wide range of Lightning Talks, includ-
telecommunications. “This mixing of science             that the web is making is the collaborative             ing Red Fields to Green Fields—Los
and design goes right across all of society.”           sharing environments that are allowing us to            Angeles, a project where geodesign
	 Dangermond underscored the importance of              bring our knowledge together over the web to            was used as part of the process to
putting geodesign to work on pressing issues            create better understanding. These trends are           create a plan to transform rundown,
such as climate change, energy needs, health,           half of the story. The thing we need to do is link      vacant land into parks and green, open
poverty, and biodiversity loss. In hearing former       all that information/knowledge with the design          space.
US president Bill Clinton speak at the recent           process [using] tools and methods that allow         •• The growing number of higher educa-
Eye on Earth Summit, Dangermond said that               us to create sustainable designs and environ-           tion institutions that are launching
he was struck by Clinton’s words about taking           ments in the future.”                                   geodesign programs or curriculums.
action. “He talked about all the policies and                                                                   These include Penn State University,
discussion about climate change and popula-             Geodesign Framework and                                 which is developing a master’s
tion, and he said, ‘I’m not really sure all these       Technologies                                            program in geodesign, and Northern
discussions are going to matter.’ There was             At this year’s summit, the conversation among           Arizona University, which has already
silence in the room. He said, ‘What I actually          the 200 attendees focused on the emerging               launched a bachelor’s degree in
have faith in are real projects. I’m dedicating my      technologies for geodesign, geodesign in                geographic science and community
life to doing projects in [places like] Africa, Latin   education, and geodesign case studies. Here             planning.
America, and India.’ He said where the rubber           are some highlights:                                 Speaking at this year’s conference was
hits the road is doing real project work. Isn’t         •• Technological advances that support               Carl Steinitz, Alexander and Victoria Wiley
that really what geodesign is about?”                      geodesign, including demonstrations               Professor of Landscape Architecture and
                                                           of new sketching, design, and scenario            Planning Emeritus, Graduate School of
Geospatial Systems Essential to                            management tools in ArcGIS 10, along              Design, Harvard University. He just finished
Understanding                                              with Esri CityEngine generation of 3D             writing the book A Framework for Geodesign,
Geospatial systems are critical to understand-             content, such as buildings, trees, and            which will be published by Esri Press this
ing the problems society and organizations                 roads, from GIS data.                             summer. Bill Miller, the director of GeoDesign
face, according to Dangermond. “They are                •• How elements of geodesign are being               Services at Esri, wrote a working paper in
converting data into maps [or] information,” he            put into practice by urban planners,              which he says that the book will likely become
said. ”They are integrating mapped datasets                architects, landscape architects,


14    Esri News for Facilities  Summer 2012
Technology


 an important resource for geodesign practi-           	 After studying the workflows of several             incorporate geodesign in their work.
 tioners and academics.                                other design firms, Esri developed a set of           	 They included Stuart Rich from PenBay
 	 This complete framework includes the                tools that would facilitate sketching and             Solutions LLC, who spoke about how geode-
 following:                                            design. This new geodesign window for                 sign is helping Kuwait University plan con-
•• Representation models: How should                   ArcMap, which will be in the upcoming                 struction of a new, multibillion-dollar campus;
   the landscape be described?                         ArcGIS 10.1 release, lets people easily search        Lilian Pintea from the Jane Goodall Institute,
•• Process models: How does the land-                  for and download design templates from                who described how geodesign is being used
   scape operate?                                      ArcGIS Online that include tools for creating,        to protect chimpanzees through community-
•• Evaluation models: Is the landscape                 manipulating, and interacting with a design.          centered conservation; and Abby Jones from
   working well?                                       	 The window also brings together several             the Anthro/Ecological Design Collective,
•• Change models: How might the land-                  core tools into one centralized window, with          who talked about the role of geodesign in a
   scape be altered?                                   easy access to the tools that facilitate sketch-      project to turn distressed land into parks in
•• Impact models: What differences                     ing and design.                                       Los Angeles.
   might the changes cause?                            	 One key aspect of the window is sce-                	 Jones spoke about geodesign at a small
•• Decision models: Should the land-                   nario management. The ability to create and           scale—a neighborhood park or community
   scape be changed?                                   manage multiple scenarios is something that           garden, for example.
“In Carl’s book that’s forthcoming, we now             has not previously existed in a GIS. With the         	 Keynote speaker Braden Allenby stressed
 begin to realize that geodesign is not just           design in place, said Baker, the next step is to      the importance of thinking about geodesign
 a concept,” said Dangermond. “It can be               visualize what a design might look like if built.     at a greater, global scale to deal with complex
 thought of as a systematic process of measur-         This can be done with Esri CityEngine                 issues such as climate change, water resourc-
 ing and modeling and interpreting and de-             software. CityEngine allows an urban form             es, biodiversity, and the economy. Allenby,
 signing and evaluating and making decisions.          to be rapidly created on top of GIS data by           Lincoln Professor of Engineering and Ethics
 And articulating that well and embedding that         procedurally creating features such as streets,       and professor of civil and environmental
 into the workflows of how we create the future        parcels, blocks, buildings, houses, open              engineering at Arizona State University, also
 is the real plot of discussion here.”                 spaces, and vegetation based on sets of rules.        talked about designing for complex adaptive
 	 Years from now, Dangermond said, people             In the case of O2 Planning + Design, the rules        systems such as the Florida Everglades. “You
 will look back at geodesign as “an evolution-         looked at the underlying data to visualize            never go backwards in a complex adaptive
 ary step for humans. It’s going to be, ‘Ah,           the density and arrangement of buildings as           system. You may go to someplace new, but
 finally we connected the dots. Finally we             described in the foundational land-use and            you are not going to get the world that you
 began to realize the implications or the conse-       intensity plans.                                      had. You want to restore the Everglades?
 quences of our actions.’”                             	 High-intensity areas, with mixed-use zoning,        It will never happen,” he said. “What you
 	 During the summit, product engi-                    drove denser street network creation, smaller         will get is something that is new and maybe
 neer Matthew Baker from the Software                  lot sizes, with taller buildings. Likewise, resi-     pristine and maybe very biodiverse, but you
 Development team and solutions engineer               dential zoning in low-intensity areas automati-       will not get the old Everglades back. . . . What
 Eric Wittner from GeoDesign Services at Esri          cally creates less dense streets, larger lot sizes,   we need to do is learn how to design in the
 demonstrated some work the company is                 and houses rather than multistory buildings.          context of complex adaptive systems.”
 doing to develop GIS software that supports           The buildings and houses can be rendered              	 The GeoDesign Summit ended with a
 geodesign. Steinitz’s geodesign framework             as simple massing models; color coded by              thought-provoking talk on the future of
 remains the key model for the workflows and           zoning type; or developed into geometrically          geodesign by Stephen Ervin, assistant dean
 tools developed by Esri to support geode-             complex, fully textured buildings with step           for information technology at the Harvard
 sign with ArcGIS, Baker said. “We know that           backs, balconies, windows, and terraces.              University Graduate School of Design and
 geodesign is software independent, so our             Wittner demonstrated how spatial analysis             a lecturer in the department of landscape
 challenge is, how does our software fit in with       inside Esri’s 3D City template can be used to         architecture. He looked ahead to what’s pos-
 this framework?” he asked.                            drive site analysis and selection; CityEngine         sible, probable, certain, likely, unlikely, and
 	 With the framework from Steinitz in mind,           is then used to do advanced plan visualiza-           inevitable in a world with geodesign.
 tool development efforts focused on studying          tion, and the results are pulled back into the        	 While Ervin said he thinks that it’s highly
 the workflows of several design firms that            template for use in analysis. CityEngine, when        unlikely any agreed-upon definition of
 have geodesign projects in the works. One             paired with ArcGIS, provides a powerful tool          geodesign will ever emerge, one certainty will
 such firm is O2 Planning + Design, based in           for understanding and visualizing what could          be a planet of 10 billion people. “It is for these
 Calgary, Alberta, which is working on a transit-      be, in the context of what is.                        people that we do geodesign,” he said. “It’s
 oriented development north of the city.                                                                     not for the trees or the hydrological systems
 	 Geodesign workflows involve creating                Geodesign in Action                                   or the atmosphere. It’s for the 10 billion
 suitability and sensitivity layers that will inform   Besides watching technology demonstra-                people that are our inheritors of what we do.”
 design, such as a layer that depicts the vulner-      tions, which included a presentation about            	 The next GeoDesign Summit will be held
 able habitats in a proposed development               ArcGIS Online, the audience also heard talks          January 24–25, 2013, at Esri in Redlands. For
 study area.                                           from more than a dozen professionals who              more information, visit geodesignsummit.com.


                                                                                                                              Summer 2012  esri.com/fm      15
Presorted
                          380 New York Street                               Standard
                          Redlands, California 92373-8100  usa             US Postage
                                                                              Paid
                                                                               Esri


  130752    11.3M8/12sp


Where ideas are born
ArcGIS Online… cloud GIS… mobile GIS… They all
            SM


add up to one conclusion: this is not the year to miss the
Esri International User Conference (Esri UC). This is where
your ideas come together to shape the future of GIS.
Join us in San Diego, California, to discover the next
generation of geospatial technology for your organization.
Register online at esri.com/uc.


Esri International User Conference
July 23–27, 2012 | San Diego Convention Center

Get in-depth, hands-on training at preconference
seminars July 21–22.


                                                                 Copyright © 2012 Esri. All rights reserved.

Contenu connexe

Similaire à Esri News for Facilities -- Summer 2012

FlightlineGeo_ESRI_Newsletter_winter2014
FlightlineGeo_ESRI_Newsletter_winter2014FlightlineGeo_ESRI_Newsletter_winter2014
FlightlineGeo_ESRI_Newsletter_winter2014
Devon Humphrey
 

Similaire à Esri News for Facilities -- Summer 2012 (20)

Esri News for Electric & Gas Utillities—Spring 2012
Esri News for Electric & Gas Utillities—Spring 2012Esri News for Electric & Gas Utillities—Spring 2012
Esri News for Electric & Gas Utillities—Spring 2012
 
Esri News for State and Local Government -- Summer 2012
Esri News for State and Local Government -- Summer 2012Esri News for State and Local Government -- Summer 2012
Esri News for State and Local Government -- Summer 2012
 
Esri News for Federal Government -- Summer 2012
Esri News for Federal Government -- Summer 2012Esri News for Federal Government -- Summer 2012
Esri News for Federal Government -- Summer 2012
 
GIS for Smart Grid
GIS for Smart GridGIS for Smart Grid
GIS for Smart Grid
 
GIS for Electric Transmission
GIS for Electric TransmissionGIS for Electric Transmission
GIS for Electric Transmission
 
Esri News for Petroleum Winter 2013/2014 newsletter
Esri News for Petroleum Winter 2013/2014 newsletterEsri News for Petroleum Winter 2013/2014 newsletter
Esri News for Petroleum Winter 2013/2014 newsletter
 
Gis for Electric Distribution
Gis for Electric DistributionGis for Electric Distribution
Gis for Electric Distribution
 
ArcGIS: Better Aeronautical Data Management
ArcGIS: Better Aeronautical Data ManagementArcGIS: Better Aeronautical Data Management
ArcGIS: Better Aeronautical Data Management
 
Spring 2013
Spring 2013Spring 2013
Spring 2013
 
Esri News for Telecommunications 2013 newsletter
Esri News for Telecommunications 2013 newsletterEsri News for Telecommunications 2013 newsletter
Esri News for Telecommunications 2013 newsletter
 
winter-2014-2015
winter-2014-2015winter-2014-2015
winter-2014-2015
 
ArcGIS: A Platform for Intelligent 3D Imagery
ArcGIS: A Platform for Intelligent 3D ImageryArcGIS: A Platform for Intelligent 3D Imagery
ArcGIS: A Platform for Intelligent 3D Imagery
 
Improving Citizen Engagement: Gov 2.0
Improving Citizen Engagement: Gov 2.0Improving Citizen Engagement: Gov 2.0
Improving Citizen Engagement: Gov 2.0
 
FlightlineGeo_ESRI_Newsletter_winter2014
FlightlineGeo_ESRI_Newsletter_winter2014FlightlineGeo_ESRI_Newsletter_winter2014
FlightlineGeo_ESRI_Newsletter_winter2014
 
Summer 2013
Summer 2013Summer 2013
Summer 2013
 
Summer 2013
Summer 2013Summer 2013
Summer 2013
 
Spring 2013
Spring 2013Spring 2013
Spring 2013
 
Electric gas-summer-2013
Electric gas-summer-2013Electric gas-summer-2013
Electric gas-summer-2013
 
LinkedIn-Presentations
LinkedIn-PresentationsLinkedIn-Presentations
LinkedIn-Presentations
 
ArcGIS
ArcGISArcGIS
ArcGIS
 

Plus de Esri

Aena Aeropuerto Adolfo Suárez-Barajas crea potentes aplicaciones para sus cli...
Aena Aeropuerto Adolfo Suárez-Barajas crea potentes aplicaciones para sus cli...Aena Aeropuerto Adolfo Suárez-Barajas crea potentes aplicaciones para sus cli...
Aena Aeropuerto Adolfo Suárez-Barajas crea potentes aplicaciones para sus cli...
Esri
 

Plus de Esri (20)

INIA- CISA: Análisis de las amenazas en la fauna silvestre
INIA- CISA: Análisis de las amenazas en la fauna silvestreINIA- CISA: Análisis de las amenazas en la fauna silvestre
INIA- CISA: Análisis de las amenazas en la fauna silvestre
 
Aena Aeropuerto Adolfo Suárez-Barajas crea potentes aplicaciones para sus cli...
Aena Aeropuerto Adolfo Suárez-Barajas crea potentes aplicaciones para sus cli...Aena Aeropuerto Adolfo Suárez-Barajas crea potentes aplicaciones para sus cli...
Aena Aeropuerto Adolfo Suárez-Barajas crea potentes aplicaciones para sus cli...
 
Plataforma Smart City de Móstoles
Plataforma Smart City de MóstolesPlataforma Smart City de Móstoles
Plataforma Smart City de Móstoles
 
ArcGIS Online para Organizaciones
ArcGIS Online para OrganizacionesArcGIS Online para Organizaciones
ArcGIS Online para Organizaciones
 
Molina de Segura se convierte en una smart city
Molina de Segura se convierte en una smart cityMolina de Segura se convierte en una smart city
Molina de Segura se convierte en una smart city
 
Portal for ArcGIS
Portal for ArcGISPortal for ArcGIS
Portal for ArcGIS
 
GIS-Based Web Services Provide Rapid Analysis and Dissemination of Maritime Data
GIS-Based Web Services Provide Rapid Analysis and Dissemination of Maritime DataGIS-Based Web Services Provide Rapid Analysis and Dissemination of Maritime Data
GIS-Based Web Services Provide Rapid Analysis and Dissemination of Maritime Data
 
An Effective Tool for Drinking Water Protection
An Effective Tool for Drinking Water ProtectionAn Effective Tool for Drinking Water Protection
An Effective Tool for Drinking Water Protection
 
GeoCollector for ArcPad
GeoCollector for ArcPadGeoCollector for ArcPad
GeoCollector for ArcPad
 
GeoCollector for ArcGIS for Windows Mobile
GeoCollector for ArcGIS for Windows MobileGeoCollector for ArcGIS for Windows Mobile
GeoCollector for ArcGIS for Windows Mobile
 
Data Appliance for ArcGIS
Data Appliance for ArcGISData Appliance for ArcGIS
Data Appliance for ArcGIS
 
Esri and BlackBridge
Esri and BlackBridgeEsri and BlackBridge
Esri and BlackBridge
 
GeoPlanner for ArcGIS
GeoPlanner for ArcGISGeoPlanner for ArcGIS
GeoPlanner for ArcGIS
 
Esri and AccuWeather
Esri and AccuWeatherEsri and AccuWeather
Esri and AccuWeather
 
Esri and Airbus Defense & Space
Esri and Airbus Defense & SpaceEsri and Airbus Defense & Space
Esri and Airbus Defense & Space
 
Esri US Data Fact Sheet
Esri US Data Fact SheetEsri US Data Fact Sheet
Esri US Data Fact Sheet
 
ArcGIS for Server on Microsoft Azure Jumpstart
ArcGIS for Server on Microsoft Azure JumpstartArcGIS for Server on Microsoft Azure Jumpstart
ArcGIS for Server on Microsoft Azure Jumpstart
 
ArcGIS for the Military--Maritime Operations
ArcGIS for the Military--Maritime OperationsArcGIS for the Military--Maritime Operations
ArcGIS for the Military--Maritime Operations
 
Esri Geoportal Server
Esri Geoportal ServerEsri Geoportal Server
Esri Geoportal Server
 
ArcGIS GeoEvent Extension for Server
ArcGIS GeoEvent Extension for ServerArcGIS GeoEvent Extension for Server
ArcGIS GeoEvent Extension for Server
 

Esri News for Facilities -- Summer 2012

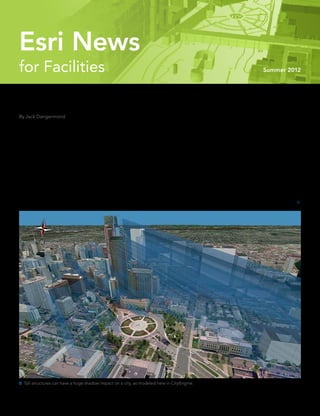
  • 1. Esri News for Facilities Summer 2012 GIS and The City 2.0 By Jack Dangermond Seven billion. That number has received a lot This growing recognition of cities as more efficient consumers of limited resources. of attention recently as the global popula- the center of the human world was further But as our cities become more populated and tion has grown past this mark. But lost in the highlighted when The City 2.0 was awarded more numerous, how do we best manage this media coverage of this milestone was another, the 2012 TED Prize. “For the first time in the complexity? perhaps even more fascinating, global sta- history of the prize, it is being awarded not to We need to start thinking about cities in a tistic: more than 50 percent of those 7 billion an individual but to an idea,” the Technology/ different way. people now live in cities, a number projected Entertainment/Design (TED) committee to grow to more than 75 percent during this stated. “It is an idea upon which our planet’s Reimagining the Canvas century. In fact, there will be at least 19 cities future depends.” Fundamental to changing the way we think in the world with a population greater than Clearly, cities will play an increasingly im- about cities is a reimagining of the way we 20 million people by the end of the twenty- portant role in our survival. Cities offer easier abstract them. Maps are abstractions of ge- first century. Cities are human destiny. access to services, and urban dwellers are ography and have proved to be particularly   Tall structures can have a huge shadow impact on a city, as modeled here in CityEngine.
  • 2. Contents Summer 2012 Cover 1 GIS and The City 2.0 Case Study 4 City of Las Vegas Implements ParkPAD for Mobile Asset Management 5 Building a University of the Future Esri News for Facilities is a publication of the 5 Cornerstone Facilities Management Group of Esri. 8 Smartphone Application Aids District’s Facilities To contact the Esri Desktop Order Center, call 1-800-447-9778 Maintenance within the United States or 909-793-2853, ext. 1-1235, outside the United States. Software Visit the Esri website at esri.com. 9 What’s Ahead for Mobile GIS in 2012 and Beyond? View Facilities Management online at esri.com/fm or scan the code below with your smartphone. Partner Spotlight 10 Lidar Speeds Up Mapping of Bustling Center City Advertise with Us E-mail ads@esri.com. Solutions Submit Content 12 ArcGIS for Facilities To submit articles for publication in Esri News for Facilities, Technology contact Karen Richardson at krichardson@esri.com. 13 Private Clouds: Moving from Hype to Reality (Really!) Manage Your Subscription 14 Geodesign Gathers Momentum To update your mailing address or subscribe or unsubscribe to Esri publications, visit esri.com/manageyoursubscription. International customers should contact an Esri distributor to manage their subscriptions. For a directory of distributors, visit esri.com/distributors. Circulation Services For back issues, missed issues, and other circulation services, e-mail requests@esri.com; call 909-793-2853, extension 2778; or fax 909-798-0560. Copyright © 2012 Esri. All rights reserved. Printed in the United States of America. The information contained in this work is the exclusive property of Esri or its licensors. This work is protected under United States copyright law and other international copyright treaties and conventions. No part of this work may be reproduced or transmitted in any form or by any means, electronic or mechanical, including photocopying and recording, or by any information storage or retrieval system, except as expressly permitted in writing by Esri. All requests should be sent to Attention: Contracts and Legal Services Manager, Esri, 380 New York Street, Redlands, CA 92373-8100  usa. The information contained in this work is subject to change without notice. Esri, the Esri globe logo, 3D Analyst, ArcAtlas, ArcCatalog, ArcData, ArcDoc, ArcEditor, ArcExplorer, ArcGIS, the ArcGIS logo, ArcGlobe, ArcIMS, ARC/INFO, ArcInfo, ArcLogistics, ArcMap, ArcNetwork, ArcNews, ArcObjects, ArcPad, ArcPress, ArcReader, ArcSDE, ArcSurvey, ArcToolbox, ArcTools, ArcUser, ArcView, ArcVoyager, ArcWatch, ArcWeb, ArcWorld, ArcXML, Business Analyst Online, BusinessMAP, CommunityInfo, EDN, Geography Network, GIS  Day, MapData, MapObjects, Maplex, MapStudio, ModelBuilder, MOLE, NetEngine, RouteMAP, SDE, Sourcebook•America, StreetMap, Tapestry, @esri.com, esri.com, arcgis.com, geographynetwork.com, gis.com, and gisday.com are trademarks, service marks, or registered marks of Esri in the United States, the European Community, or certain other jurisdictions. CityEngine is a registered trademark of Procedural AG and is distributed under license by Esri. Other companies and products mentioned herein may be trademarks or registered trademarks of their respective trademark owners. 2 Esri News for Facilities  Summer 2012
  • 3. GIS and The City 2.0  continued from page 1 useful throughout our history. But traditional maps have limited our ability to manage and design in a holistic, comprehensive manner. GIS technology has given us a powerful new context for extending our traditional methods of abstracting geography—a new canvas that includes everything that lies below, on, above, and around the city, including what exists inside and outside buildings, as well as how things connect to the city and how all these things change through time. Cities as Ecosystems Cities are the places where most of us now spend the vast majority of our lives. They have in fact become man-made ecosystems—vast  Jack Dangermond at TED 2010 in Long Beach, California (Credit: TED/James Duncan Davidson) assemblages of interdependent living and nonliving components—the primary habitat enhancing a variety of government-citizen more open participation through visualization, for the human species. interactions involving public information, better evaluation of proposed scenarios, and The recognition of cities as a habitat for requests for service, public reporting, citizens a deeper understanding of the implications modern man is leading to new approaches to as sensors, unsolicited public comment, and of one design over another. Combining the their management and design. GIS technology even volunteerism. strengths of data management and analysis has long been used to map, study, analyze, Geospatial technologies have already with a strong design and automation compo- and manage natural ecosystems. It only seems proved to be effective tools in supporting nent is fundamental to designing The City 2.0. logical to manage, model, and design our new citizen engagement. Intelligent web maps man-made ecosystem with the same tried-and- are acknowledged as a catalyst for solving A New Direction true tools used for traditional ecosystems. key challenges in creating a dialog with Cities are intricate collections of materials, informed citizens. As web- and cloud-based infrastructure, machinery, and people, with Buildings as Microcities GIS continues to evolve and social media countless spatial and temporal relationships As our cities are growing in size and complex- and mobile devices become more pervasive, and dependencies, and require progressively ity, so too are the buildings that compose governments will continue to deliver innova- more sophisticated tools to help us design much of the fabric of the city. In effect, many tive forums through interactive information and manage them. They are complex systems buildings and facilities are becoming small and participatory citizen applications. where we humans spend an increasing cities themselves, and they need to be amount of our lives. designed and managed as such. Designing The City 2.0 “This idea is capable of inspiring millions of GIS tools, used successfully for many years in Geography is constantly changing—from people around the world to contribute to one fields such as environmental analysis and land- wind and water erosion, natural climate shifts, of the biggest challenges and opportunities scape planning, also support a broad range of tectonic and volcanic activity, and the domi- humanity faces,” the TED committee stated applications inside and outside buildings and nance and extinction of species and ecosys- when announcing the award of the 2012 TED facilities. In fact, GIS can be used throughout tems. But recent changes to geography as a Prize. “The City 2.0 is not a sterile utopian the life cycle of a facility—from siting, design, direct result of human activities are threaten- dream but a real-world upgrade tapping into and construction through ongoing use, main- ing the survival of many species, including humanity’s collective wisdom.” tenance, and adaptation, ultimately through our own. And while the actions causing these Our challenge is to design our man-made closing, repurposing, and reclamation. monumental changes are often deliberate, ecosystems to achieve the maximum benefit much of the change to geography has been to society while minimizing short- and long- An Engaged Citizenry an unintentional by-product of poor planning term impacts on the natural environment. As Smart cities of the future will be those where and unsustainable actions—change that I call an integrative platform for management and the citizenry is engaged in city design and “accidental geography.” analysis of all things spatial, I believe that GIS evolution, where we fully leverage the col- In my talk at TED 2010, I introduced the technology can help meet this challenge. lective intelligence of the masses and allow idea of geodesign—a concept that enables Cities are our new man-made ecosystems, everyone to actively participate in shaping architects, urban planners, and others, to har- and it’s time we start to think about them, our communities. Today, social media and ness the power of GIS to design with nature manage them, and design them as such. mobile citizen engagement applications are and geography in mind. Geodesign results in Summer 2012  esri.com/fm 3
  • 4. City of Las Vegas Implements ParkPAD for Mobile Asset Management Founded more than 100 years ago, Las Vegas, Maintenance began the development and that the necessary amounts of seed, fertilizers, Nevada, began as a stopover on the pioneer deployment of its Park Asset Data Collection and herbicides can be accurately calculated trails heading west. Soon it evolved into a and Data Conversion Program (ParkPAD) to and purchased. In a related project, the data popular railroad town and staging point for replace the legacy MMS. Based on ArcPad from an earlier tree study was added to the the many mining operations in the area. In software, ParkPAD has greatly improved database so that the parks maintenance staff 1911, the population was about 800 people. the department’s capability to collect and could determine water usage requirements Las Vegas then began to grow in leaps and manage park assets, because it is fully com- for each tree based on species, size, location, bounds, with construction of nearby Hoover patible with the department’s existing ArcGIS and so on. Dam during the 1930s and the beginning of enterprise system. Field crews can now view In the next stage of the project, an irriga- its now massive casino industry during the a digitized image of a park or other venue tion layer will be created for the database and 1940s and 1950s. Today, the greater Las Vegas and immediately determine whether the data will include the locations of irrigation clocks, metropolitan area is home to nearly two mil- has already been collected. Getting data in stations, valves, and controls. This will allow lion residents. and out of the new system is a quick and easy the irrigation system repair crews to quickly Maintaining the infrastructure necessary process, and updates can be performed in locate equipment when there is a break in to support a population of this size requires near real time. the water main or if a valve becomes inoper- carefully coordinated efforts by the city’s The Parks and Open Spaces Division able. In addition, these new base layers will Department of Operations and Maintenance is currently working with the Information make it easier to collect and track the number, to minimize redundant work and make the Technologies Department to complete the location, and condition of assets, such as play- most of shrinking city coffers during difficult digitization of the base layers for all the city’s grounds, shade structures, drinking fountains, economic times. While the department parks, landscaped areas, trails, medians, picnic areas, and benches. has used ArcGIS software for many years, a school landscaping, and sports fields. This This new data will be included in the city’s different vendor’s maintenance management new parks inventory database has produced enterprise GIS so that it is available to the system (MMS) had been implemented to some immediate cost benefits to the city. other departments that rely on it. Currently, collect and manage the assets within its parks Since Las Vegas is in the Mojave Desert, these departments maintain their own data- and related facilities. Because the drawbacks water conservation is very important. The sets for park assets, and there are discrepan- of that particular system were substantial, in vegetation layers in the database are used to cies between them. Using the same dataset 2009, the Department of Operations and determine the square footage of each park so is particularly useful for the Department of Operations and Maintenance, which main- tains the parks, and the Department of Parks, Recreation and Neighborhood Services, which schedules outdoor events, maintains sports fields, and manages the use of picnic and other recreation areas. “Our use of GIS continues to grow,” says Joel Hillhouse, GIS analyst at the City of Las Vegas. “In the near future, we will be posting our parks data on the city website for residents and visitors so that they can find information and make reservations for a specific site using an interactive park finder.” For more information, contact Joel Hillhouse, GIS analyst, City of Las Vegas (e-mail: jhillhouse@ lasvegasnevada.gov).   American Park showing the base layers and assets added over the aerial image, which All helps those using the map understand what they are looking at. 4 Esri News for Facilities  Summer 2012
  • 5. Case Study Building a University of the Future The University of Calgary in Alberta is considered one of the top research universities in Canada. It has more than 29,000 students and more than 4,000 academic and support staff. The university began using GIS for academic research 20 years ago and has now standard- ized the management of its geographic information with Esri technol- ogy. Realizing the value of geographic analysis for informed decision making, it has expanded the use of GIS to manage not only academic data but also institutional and administrative data. Running a Smart Campus Cornerstone The main campus has more than 20 academic buildings occupying Shelli Stockton more than 200 hectares, which is larger than Calgary’s entire down- Global Facilities Industry Manager, Esri town core. In 2008, the university embarked on a $1.5 billion campus expansion, the largest in its history. Knowing that implementing a project of this size and continuing to maintain so many buildings would require a comprehensive understanding of every aspect of the campus—its landscape, people, buildings, and infrastructure—univer- sity planners relied heavily on ArcGIS and geodesign principles to help As a reader of Esri News for Facilities, we hope you will analyze and evaluate the impacts of design alternatives early in the come to this year’s Esri User Conference (Esri UC), where we development process. will be addressing some of the biggest advances and trends The university maintains institutional data used for facilities manage- that are changing the way facility professionals use geospa- ment in a central data warehouse. Esri’s ArcGIS for Server serves as tial technology. the front-end technology that pulls data from ARCHIBUS, Esri partner (Boston, Massachusetts) and creator of a solution used to manage spa- Of the 14,000 attendees at the Esri UC, you’ll find tial data and real estate, infrastructure, and facilities information. These representatives from nearly every industry. This is where recently integrated systems enable users to visualize and analyze both you learn about what your peers are doing and how you can interior and exterior building data that’s important to understanding apply those best practices to your own work. It’s where you how the campus currently works. Defining how the landscape works get technical training, contacts, and exposure to the best and evaluating whether it is working well are key tenets of the geode- geospatial products and services available. Esri even offers sign framework for landscape change. Evaluation of current processes personalized tech support, so you can discuss your biggest allows proper “baselining” and the identification of key metrics against challenges with our experts. which design alternatives can be measured. The result is improved site Facilities-focused sessions will take place on July 24 and planning and facilities design optimized for cost-efficient management 25, 2012, at the Esri UC. Sessions include the following: and sustainability well after the initial project work is complete. Understanding the physical constraints of a property is equally •• Facilities Sustainability: Planning, Carbon Footprint, and important. During site assessments, planners and landscape architects LEED Compliance alike need to know how water flows across a property. This question •• Enterprise Facilities GIS for Asset Management and Routing came up early in the design phase, before construction, when the facili- •• Data for Facilities and Floor Plans: CAD, BIM, and Lidar ties management team approached the university’s GIS team to create •• Interior Space Mapping and Assessment a campus drainage basin model. While there are no drastic slopes on •• Interior Space Data Collection and Management for a the campus, there are low spots. Coupled with Calgary’s high water Facilities Basemap and Planning tables, understanding these environmental issues was an important design constraint. If a basement is built in a particular location, the probability of flooding may be higher. Knowing where rainwater would Don’t miss the technical workshop Implementing ArcGIS drain allowed the team to see where flash floods might occur and then for Facilities with Intelligent Maps & Apps or the lunchtime mitigate any potential dangers. Facilities/AEC Special Interest Group (SIG) meeting and the Understanding the terrain—the physical lay of the land—and FM Evening SIG meeting on Wednesday, July 25. how it affects drainage across this particular landscape has proved You can’t get this combination of practical insight and to be invaluable. The drainage basin model has been leveraged in technological inspiration anywhere else. I hope you can join planning new building sites and the expansion of the storm sewer  me this July in San Diego. continued on page 6 Summer 2012  esri.com/fm 5
  • 6. Building a University of the Future  continued from page 5 system, including an innovative research pro- models were used to track the sun’s effect ject for filtering surface water before it enters on a glass exterior compared to a solid wall the sewer system. structure. This method of optimizing the heating mechanics of buildings is an impor- 3D Data to the Rescue tant consideration in an area as far north as The team combined light detection and Calgary, where sun angles change drastically ranging (lidar) data with high-resolution, depending on the season. In the summer, the orthorectified aerial photographs to create sun is high, creating narrower shadows; in the drainage model data. ArcScene allowed the winter, the reverse is true. Simulating 3D decision makers to view and process the shadow effects based on sun angle allowed data in 3D while analyzing the effects of new team members to calculate just how long a campus and allows it to conserve water by construction sites on the existing grounds. building would sit in shade at any time of year, reducing overlap and avoiding spraying water Using lidar to map the campus allowed the enabling decisions to be made on the heating on roads and pedestrian walkways. team members to look not only on the ground needs and estimated costs to maintain the but in the trees, as well. They recorded and comfort level of that specific building. Coordinating Solutions processed the height of every tree on campus As with many GIS projects, the develop- The geodesign process opened many new to provide even more information neces- ment of one application often generates avenues to explore to increase efficiency sary for relandscaping after the expansion additional benefits. With the surface models around campus, even in areas where it wasn’t project, as well as to understand the position in place and the building sites located, there expected. In a synergistic move with the new of shadows on potential buildings. Armed was an urgent need to model the campus construction, the information technologies with this information, the team was able to irrigation system. An application was devel- (IT) department also used ArcGIS to consoli- optimize the planting of five trees for every oped to help map the changes caused by date several computer centers where remote tree removed during construction, along with the construction. The irrigation model also computer systems were once maintained. The native, low-water vegetation, helping the provided the ability to monitor water usage consolidation freed up new space for faculty team achieve greenhouse gas and water use and maintain asset inventories. This innovative to use and has led to better communication reduction goals. application created a model for managing and system coordination across campus. It Once the surface models were completed, 8,500 sprinkler heads across campus and has also allowed a reduction in utilities costs for the team generated 3D building models helped grounds personnel better understand electrical and cooling systems. to use for shadow simulations during the and manage the system. Knowing the flow “Using GIS as a decision-making tool is next construction phase. Traditionally, the rate and tilt angle of each sprinkler, the a smart way of gathering all the things you models have been leveraged to ensure that university is now able to calculate the volume already know and placing them in a single new buildings do not obstruct the views of of water it sprays, as well as the area it covers. spot so you can see the entire picture,” says existing buildings. In this case, the shadow The application can be used for the life of the Tom McCaffrey, GIS coordinator, University of   The interactive room finder provides the ability to determine the user’s current location and find the best path to a new destination. 6 Esri News for Facilities  Summer 2012
  • 7. Case Study  The University of Calgary uses ArcGIS to manage a $1.5 billion expansion and maintain the facilities on its 200-hectare campus. Calgary. “Understanding each layer of data as a virtually eliminated the need for manual roof and helps them save time. separate entity is one thing; combining several measurements that cost both time and money, The interactive room finder will soon layers together to get a coordinated solution as well as pose a potential safety risk. become available on mobile devices. Users to a complex problem is a completely different From a risk management perspective, the will be able to take a picture of a wall marker scenario. It’s the difference between thinking in university has also used ArcGIS to enhance to determine their current location and then two dimensions versus thinking in three or four.” public safety. Using a current model of the enter their new destination. The map will show This understanding of how ArcGIS can campus and incorporating up-to-date floor several route options—shortest path, indoor be applied to different problems led the IT plans, emergency preparedness and evacu- or outdoor routing, elevator access for the telecom group to reach out to the GIS team ation plans were developed. Models and handicapped, or stair access for those who for help creating an application that would processes were discussed with local authori- want more exercise. track telecom network lines, utility corridors, ties and emergency responders to generate Another future project will use adminis- wiring closets, and utility shafts throughout a map standard that was distributed to trative data to help students select classes the campus. While general maintenance for these stakeholders. The safety team created based on spatial proximity. An application is utilities and computer networking systems different scenarios and determined several being developed that will allow students to can be overwhelming if left unchecked, the possible routes for building evacuations. enter their ID numbers and generate maps ArcGIS for Server web-based application, These plans were posted on a central website that show their classroom locations, as well when completed, will serve up 3D diagrams of to help fire wardens understand the proper as the proximity to the next class, based on a the networks that administrators can edit and evacuation protocols. Future plans to inte- specific time and day. This will help students analyze at any time. Service technicians will grate live security camera feeds into a secure familiarize themselves with the campus and also be able to trace, track, and repair faulty campus web dashboard would allow the crea- select a schedule that offers reasonable travel wires and equipment as these tasks are neces- tion of a mobile command and control center. times between classes. sary. The system will enable them to monitor ArcGIS was even used to design external “GIS technology offers endless oppor- real-time data, plan networks, and prevent lighting models for the university’s safety walk tunities for our processes to grow,” says costly technical problems. programs. These models estimated ground McCaffrey. “Processes that used to take illumination based on the type of light fixtures weeks can now be done in minutes. Being Improving Asset Management and any interference caused by vegetation or able to see the entire picture at once is an and Reducing Risk building shadows. Maps were then generated option we’ve never had before. GIS allows us The university currently needs to renew and and given to grounds personnel to take cor- to plan at a much higher level than we could maintain the exterior roofs of more than rective measures in illuminating unsafe areas. have ever imagined. Now, we look for new 90 buildings on several different campus sites. ways to view scenarios and come up with To make this process more efficient, the GIS Enhancing the Campus better ideas to manage them.” team created a web mapping application Experience With all the efficiencies gained in their that allows editing, updating, measuring, and To help students and visitors easily find their research, institutional, and administrative reporting on government funding spent on way around campus, the university developed processes using Esri technology, the University reroofing the campus. Using ArcGIS, the team an interactive room-finder application using of Calgary earns an A for geodesign and is well is now able to more effectively track life cycles institutional data. Users can input the building on its way to becoming a university of the future. and warranties of the roofing materials, which name and room number they wish to find, and For more information, contact Tom can potentially lead to thousands of dollars the application generates a detailed map McCaffrey, GIS coordinator, University of in savings on roofing jobs. Data on structures showing the floor plan with the desired room Calgary (e-mail: tmmccaff@ucalgary.ca). reported to the government is now docu- highlighted. Visitors can look up their destina- For more information on how you can put mented using an accurate spatial and tempo- tion using the online tool and determine geodesign into practice, contact Mr. Shannon ral method that provides strong accountability the nearest parking area before arriving on McElvaney, Esri (e-mail: smcelvaney@esri for how government money is spent. GIS has campus. This enhances visitors’ experience .com), or visit esri.com/geodesign. Summer 2012  esri.com/fm 7
  • 8. Smartphone Application Aids District’s Facilities Maintenance By Jim Baumann, Esri Writer Students and faculty in the Los Angeles technology and provide our community with Unified School District (LAUSD) can report an intuitive tool that allows them to easily graffiti, broken benches, or other repair document maintenance issues and send those issues using a smartphone application that is reports directly to us so that we can resolve integrated with the district’s GIS. them,” said Lu. “As an added benefit, by LAUSD is responsible for educating more using the application, students and faculty than 675,000 K–12 students annually and is the members of LAUSD are provided with a sense second-largest public school district in the of ownership while building community pride.” United States. The district manages facilities CitySourced uses Esri’s ArcGIS application that include 1,065 K–12 schools; more than programming interface (API) for smartphones 200 education centers, adult schools, and in the LAUSD Service Calls application so that occupational skill and learning centers; and the school district can integrate the volunteered dozens of warehouses and storage yards data from the incident reports with its authorita- within the district’s 710 square miles. tive ArcGIS database. This helps the school The district has used Esri’s GIS software district keep the GIS database up-to-date for its since 1990 for administrative tasks including IBM Maximo asset management system. student enrollment forecasting and analysis, Kurt Daradics, director of business devel- school boundary maintenance, student safety, opment at CitySourced, said, “The LAUSD disaster planning, and facilities operations Service Calls implementation at LAUSD and management. As additional applications is an end-to-end solution. Incidents are were added, the GIS gradually evolved into an recorded on the mobile devices and sent to enterprise system. the CitySourced servers hosted by Microsoft “GIS has played a big role on the administra- Azure. Our servers route the issues directly tive side of our operations,” said Danny Lu, busi- into LAUSD’s IBM Maximo asset management ness analyst for LAUSD. “As we continued to system as service requests, where they are expand our use of the technology, we realized reviewed and subsequently resolved by the that there were some commercial applications district’s maintenance department.” that could be easily integrated with ArcGIS and Daradics indicated that the LAUSD Service would fit into our existing workflow.” Calls application will eventually be able to au-   smartphone application integrated with A Upkeep of the numerous LAUSD facilities tomatically query the operational asset layers the Los Angeles Unified School District GIS requires an army of administrative, mainte- in the ArcGIS database so that the asset ID can lets students and faculty members report nance, and technical staff members, who are be determined. The ID will then be attached to graffiti or other repair issues. continually evaluating and processing the the asset specified in the incident report sub- is required, a work order will be generated, many service requests submitted each day. mitted by the LAUSD community member. This prioritized, and routed to the appropriate The district implemented a data collection will allow all information related to the asset department for action. system that allows campus staff to easily (maintenance history, age, and replacement According to Lu, the system also provides report nonemergency issues. This relieves the costs) in the GIS database to be automatically feedback to the person or persons report- operations department from some inspec- retrieved so the school district can use its GIS ing the complaint. When a work order is tion and reporting responsibilities and lets it to better manage and maintain its assets. generated as a result of a service call, the concentrate on the repair and maintenance of The LAUSD Service Calls application can be asset management system automatically the school district’s assets. downloaded for free to the user’s smart- sends a response to the sender, indicating In 2010, the district contracted with Esri phone. When reporting an incident, the user the incident report has been received and partner CitySourced to implement LAUSD is prompted through a series of drop-down assigned. Students and faculty can use the Service Calls, a smartphone application per- lists to specify the incident location, type, CitySourced application to search for the calls mitting LAUSD students and faculty to report required maintenance, and description. This they have placed. Under My Reports, they can issues related to the repair and maintenance report and accompanying photograph is sent view the status of an incident. This feedback of school facilities, such as graffiti, broken to LAUSD’s asset management system, where loop demonstrates to the community that benches, or damaged sprinkler systems. it is reviewed by a moderator to determine LAUSD is aware of and is working to resolve “We wanted to take advantage of today’s the required course of action. If maintenance its concerns. 8 Esri News for Facilities  Summer 2012
  • 9. Software What’s Ahead for Mobile GIS in 2012 and Beyond? A Conversation with David Cardella, Product Manager for Mobile Technologies at Esri Esri’s ArcGIS for Roundy: Was that unexpected? would have thought we’d be where we are smartphones and now. Over the next several years, I see a tablets, including the Cardella: In a sense, it was. I expected some few pervasive platforms emerging. In North new Android application, non-GIS professionals to download the ap- America, I see Android and iOS gaining trac- are proving popular with plication because it’s in the Android Market, tion among consumers and in the enterprise. I both GIS and non-GIS but not in the numbers that we’ve seen. believe Windows Phone 7 will start to increase professionals. Esri writer Our primary focus was to allow our existing in usage as well, especially in European Leslie Roundy spent a customers to get their data on the device. But markets. There might be one or two emerging few minutes talking with David Cardella, prod- non-GIS professionals are using it to discover mobile platforms that share the limelight with uct manager for mobile technologies, about all the maps we host on ArcGIS Online. Our iOS and Android. I certainly see the move- how mobile applications, including ArcGIS customers like that they can get their data on ment to tablet devices replacing desktops in for Android, will be used by Esri customers their devices. And the application’s users like homes. I don’t think we’re there yet, but we’re and what lies ahead for mobile development both the data and maps that Esri hosts plus moving in that direction. With smartphones at Esri. the authoritative maps and data our custom- being so conducive to browsing the web, ers provide. They like to be able to get at there are some households that already use Roundy: What does the ArcGIS for Android different types of data. The application allows their smartphone as their primary means application mean to Esri software users? them to access the ecosystem of maps that to connect to the Internet. As a company, we have online, as well as any data that our we’re going to closely track mobile technol- Cardella: All our mobile solutions, not just customers want to share. ogy trends, study what this means to our those specific to Android, are essentially a users, and determine where they’re going to window into our users’ GIS. This allows them Roundy: What’s in store for mobile develop- demand their GIS be in the next few years. to extend the reach of their GIS out into the ment at Esri? Our job will then be to develop the best tech- field or even down the hall, outside their office nology to suit their organization’s needs. space. Having ArcGIS on mobile devices Cardella: We’re finding that these mobile means it’s much easier to do this, especially platforms, iOS and Android especially, are be- on smartphones and tablets. These devices coming much more pervasive in enterprises as are pervasive and prevalent in the consumer well as with consumers. Consumers are using industry, but we’re seeing organizations these devices to access maps and location- implement and integrate them as well. based services. In terms of how Esri wants to move forward, we want to support ArcGIS and Roundy: Is there a typical user for these GIS capabilities on the most popular mobile applications? platforms. So as new platforms appear and become popular, we’ll build on them as well. Cardella: Since ArcGIS for smartphones Until then, we’ll continue to build more and and tablets was launched, we’re finding that more functionality into existing platforms. non-GIS professionals are downloading it. While we intended it for GIS users as a more Roundy: Where do you think mobile technol- convenient way to get their data on these ogy will be five years from now? devices, we’re finding that because of the accessibility of the various marketplaces and Cardella: When I look back five years ago, application stores, it’s really reaching a large where we were with mobile, both within the number of people outside our traditional consumer market and within GIS, I never customer base. Summer 2012  esri.com/fm 9
  • 10. Lidar Speeds Up Mapping of Bustling Center City The City Uses a Blend of Robotics and GIS for an Innovative Project below Market Street Center City in Philadelphia is a confluence of transportation, shopping, business, and government agency activity, with several multilevel spaces (including underground) within a few blocks. The fifth biggest city in the nation, Philadelphia also boasts the third-largest downtown population. The City of Philadelphia is committed to encourag- ing business and real estate development and has embarked on an innovative project to build up the area while at the same time making certain the downtown remains ready for business every day. expand the city ef- A site assessment and requirements fectively, staff need a validation was conducted at the client site complete view of the to plan for collecting the data necessary to infrastructure—both help the city. The goals of this activity were to inside and out—of validate deliverable requirements and define buildings, railways, data collection specifications; identify project and surrounding areas logistical support requirements; discuss and PenBay Solutions, an Esri partner headquar- for their facilities man- validate project staging, access, and schedul- tered in Brunswick, Maine, was contracted agement, public transit, public safety, space ing dependencies; and visually inspect project by the city to provide facility management planning, and real property departments. areas of interest. mapping services for a pilot project aimed Upon completion of the site assessment, at testing the effectiveness of a total 3D GIS Understanding from a detailed list was generated of priorities, solution. This service included interior data the Inside Out points of contact, access dependencies, and collection using an innovative robotic plat- The city wanted to understand its building infra- geographic proximity that allowed the crea- form employing 3D lidar. The robotic platform structure better. It was interested in seeing the tion of a project plan and schedule to capture collected thousands of data samples as it was relationship between pedestrian concourses the data. Center City facilities are complex guided by a surveyor through the buildings. with platforms, corridors, stair locations, and and have a high volume of pedestrian traffic. The data was precisely geolocated to a point ramps; ingress and egress points; emergency Minimal survey time and disruption were of on a high-resolution map of the interior space. access and air vent facilities; and connections high importance to the city. The decision was This allowed PenBay staff to develop spatially between levels. To effectively analyze and made to operate a two-person crew on-site accurate floor map data of the underground manage this critical public infrastructure, it under the control of a project manager. This infrastructure that connects several notable needed access to accurate and comprehensive plan optimized the use of PenBay and client buildings along Market Street in Philadelphia. spatial data information. This included data staff so that there would be minimal impact To effectively serve the city, including this about space, like rooms and how they are being on building occupants and client resources. bustling area, municipal government staff rely used, as well as data about assets, such as fire on their GIS, which is based on ArcGIS. Like extinguishers and other components found Open during Construction most traditional GIS installations, however, within the rooms. Images had to be collected Once the dates for the survey visit were theirs did not include data for the insides of to guide anyone who needs to access a space, determined (the survey itself took place in the Center City buildings or the vast infra- such as public safety officials, so they can get a fall 2010), PenBay started the logistics neces- structure under the streets. To maintain and real sense of what the space looks like. sary to mobilize the equipment and staff 10 Esri News for Facilities  Summer 2012
  • 11. Partner Spotlight needed to execute the data collection phase building information system data model of the project. Upon arrival at the site, the (BISDM)-compliant dataset that included CAD survey team closely coordinated its collection (AutoCAD) and 3D BIM (Revit) files of the area activities with the client. of interest and a primary deliverable of an The robot PenBay surveyors used was ArcGIS geodatabase. Using ArcGIS for Server pushed through each hall and room at a and the geodatabase, city staff have access to normal walking pace. Lidar was used by the the data files easily over the web. robot to measure the distance to each object A 3D video dataset was also collected for by illuminating the target with light from a the entire captured area. This is of particular pulsating laser. Data points were collected interest to public transit and the public safety illustrating where every object in the space community for planning and preparedness is located, from walls and doors to desks and workflows, which provide assistance to facili- chairs. The robot also took spherical images ties managers in condition assessment and with a camera that takes 360-degree pictures square feet of designated infrastructure. The asset inventory. inside the building and then georeferences survey provided the city with a clear and Through this pilot, PenBay was able to them. This provides a continuous image of the accurate view of how underground infrastruc- demonstrate how critical deliverables can be space that can give a more accurate represen- ture links to the aboveground buildings and created to support the city facilities manage- tation of the real buildings. roads. The combination of GIS and robotics ment initiative using GIS and lidar. Space Since data collection happened mostly provided the ability to measure pertinent definitions were defined, including where at night to keep with Center City’s mission space in a fraction of the time it takes with boundaries such as hallways and rooms begin of not impacting the community, security traditional collection methods. Staff took and end, accurately on maps; floor plan data escorts were provided by the city’s public only 20 hours to collect all the data necessary was captured to represent interior space and transit agency, SEPTA, for safety as well for the pilot project. structure accurately; and facility surveys were as to provide unencumbered access to all performed quickly, safely, and cost-effectively. areas, such as the subway system and secure One Cloud—Many Datasets For more information, contact Stu Rich at buildings. In total, PenBay collected 340,000 PenBay provided this data to the city in a SRich@penbaysolutions.com. New E-book for Facilities Managers The Role of GIS Technology in Sustaining the Built Environment A new e-book is available for anyone responsible for the form and condition of the built environment—regulators, policy makers, facility designers, owners, and managers. The e-book was produced to help connect the dots between the number of reports published over the past 14 years on the state of the capital and residential facilities industry in the United States, as well as between everyone’s experiences working for and with the industry. The e-book also provides a cogent and compel- ling argument for using GIS as the enabling technology for better communication and data interoperability. Trends over the past 30 years have not been favorable for the long-term sustainability of the built and natural environments. This book LEED AP), as well as a certified planner (AICP) and GIS proposes the use of GIS as a means to achieve required stew- Professional (GISP), with nearly 14 years’ project experience ardship, sustainability, and savings for the built environment. shaping and managing the built and natural environments. The e-book is authored by Patrick Wallis, a project man- His technical expertise is in facilities acquisition, real estate ager with Esri who provides technical expertise in support of management, municipal and master planning, economic facilities management, master planning, ports, and maritime analysis, and GIS. projects. He is an architect and designer by training (M.Arch, Read an excerpt of the e-book, which is available on the Esri Facilities industry page at esri.com/facilities. Summer 2012  esri.com/fm 11
  • 12. Solutions ArcGIS for Facilities By Shelli Stockton, Esri Global Facilities Industry Manager Do you know what you don’t know about your the convergence and interoperability of BIM, •• Facilitate better planning and analysis building, campus, or base? If you’re looking these specific FM technologies, and GIS. •• Allow efficient sharing of information in at your building or campus as a group of The key to developing true insight into and out of the field, providing a com- disparate objects as opposed to seeing it as our complex and dynamic world is creating prehensive view of operations an integrated, functional system of interde- a framework of understanding. We need to Smarter facilities will result from the pendent parts, you don’t. take many different pieces of past, present, convergence of BIM, GIS, and the additional BIM and specific facilities technologies like and future data from a variety of sources FM system technologies mentioned above. enterprise asset management (EAM), build- and merge them into a single system. GIS is These tools and technologies will help pri- ing automation systems, computer-aided uniquely positioned to do this. Already widely mary facility stakeholders and users improve facility management (CAFM), and integrated used by planners, engineers, and facility man- decision-making capabilities, the time it takes workspace management systems (IWMS) agers, GIS helps you capture, store, analyze, to make these decisions, and the reliability of provide great amounts of detailed data on a and use all forms of location-referenced data the results. These benefits will translate into myriad of items, from the smallest screw to about where people live and work. recognizable and, in many cases, dramatic the largest HVAC system, yet have no ability GIS enables a framework for smart design increases in cost efficiencies, reductions of to tell you if they are located within the same and management. Users can inventory and risk, and increased facility sustainability and proximity so that it would make sense to have display large, complex spatial datasets and longevity. the maintenance worker you send out handle use them to analyze and manage issues. To make this even easier, the ArcGIS for the reported problems with both. Or that inci- Whether at a single campus or base or across Facilities system includes a series of tem- dences of crime have spiked in an area where an entire organization, the effect of various plates for facilities and a data model so facility outdoor lighting fixtures are old and blocked factors on each other can be studied, moni- managers can integrate their facilities data by overgrown bushes. Or that, over time, your tored, and measured. into one standard format, apply cartographic CPR-certified employees have all ended up on rules to the data so it is easy to view and one floor, leaving three others without access With GIS, you can do the following: understand, and make the data easily acces- to that resource. Smarter facilities—those sible to others in their organizations. For more that are safe, secure, energy efficient, and •• Streamline asset information: collection, information on these concepts and how GIS optimally operated and utilized—result from dissemination, maintenance, and use helps facility managers, visit esri.com/fm. 12 Esri News for Facilities  Summer 2012
  • 13. Technology Private Clouds: Moving from Hype to Reality (Really!) by Victoria Kouyoumjian, Esri Business and Technologies Strategist Back in 2008, the term cloud computing was barely a glint in the eye of most technology companies. Perhaps they used SalesForce .com and Gmail, but tossing around the cloud terminology wasn’t really de rigueur. Now it’s hard to imagine tech discussions without some reference to it at least once in the conversation. Seems like it’s everywhere—or at least the terminology is. In 2009, Esri hitched its geowagon to Amazon Web Services (AWS) as its primary cloud provider. But the general consumer audience was much more familiar with shopping experiences through Amazon.com  The Cloud Adoption Trend rather than cloud hosted services off of AWS. Fast-forward less than three years, and things certainly have changed. AWS has established the private cloud may be the only choice coalition of EMC, Cisco, and VMware—to itself as separate and different from Amazon. when attempting to leverage at least some successfully test and certify ArcGIS on its com, with a brand synonymous with cloud as of the benefits of the cloud computing private cloud infrastructure appliance. Vblock, a globally known public cloud infrastructure “skyscape.” Hosting data and applications as it is known, provides the storage, network service provider. And in 2010, Esri announced off premises in a cloud provider’s data center, switches, virtualization layer, and compute the availability of ArcGIS Online, initially potentially out of the country or in a seem- capacity that many organizations will find supported by AWS infrastructure under the ingly unknown location, might be legally attractive as a bundled private cloud platform, hood, to bring the ubiquity of a public cloud prohibited or verboten by organization re- in a nearly plug-and-play capacity. platform to the geospatial community. quirements and politics. This growing interest Esri is dedicating significant investment, At the same time that public clouds were in leveraging the private cloud has not gone research, and development into public and moving into mainstream business, a paral- unnoticed by Esri, and it’s moving quickly to private cloud offerings and providers and lel current of a cloud trend was emerging: provide solutions for this demand. will continue to do so, going forward. It is private clouds. Initially, there was (and still is) Portal for ArcGIS allows any organization to without question that cloud computing has a lot of back-and-forthing on the definition stand up its own customized ArcGIS Online, the potential to be a disrupting trend, upset- of private cloud, and arguments around the to create a unique geographic content ting traditional technology models, and yet private cloud notion as simply a rebranding system; the system may be on premises, simultaneously demonstrating the potential of an organization’s existing data center— within privately owned data centers, or man- for a promising boon. And what about you? infrastructure hosted on premises behind aged by Esri, behind configured firewalls, to Where do you and your organization stand “in the firewall. But with the advent of cloud provide more control over security or meet the cloud”? Private, public, hybrid, or none of computing, organizations are now exposed regulated restrictions. the above? to some of the technologies that enable the Available in Q2 2012, ArcGIS Online for core characteristics and benefits of cloud organizations carves out a private community computing: the idea of a self-service portal cloud for any company, business, group, for their customers or staff and the virtualiza- organization, or agency. Although hosted tion of servers—that is, the ability to create in public off-premises infrastructure, the multiple “virtual machines” from one physical services and data are specific, secure, and server—affording increased optimization of isolated to only the members of the organi- underutilized infrastructure, ratcheting up zational account, but with access to public server optimization to 75 percent or more, services, hybridizing the public and private from an average of 25 percent. cloud seamlessly. In fact, for many businesses and agencies, Most recently, Esri paired up with VCE—a Summer 2012  esri.com/fm 13
  • 14. Geodesign Gathers Momentum Two-Day GeoDesign Summit Focuses on Geodesign Technologies and Practices By Carla Wheeler, Esri Writer The term geodesign, once hard to define, is becoming part of the vernacular in the design field. That astute observation opened this year’s GeoDesign Summit, a gathering of professionals interested in using geospatial technologies to arrive at the best and most sustainable design solutions. The theme of the summit, Geodesign in Practice, went to the heart of geodesign’s ultimate goal: finding innovative solutions to the most pressing challenges by fusing design processes with geospatial technologies. In other words, geospatial technologies will provide the analytic capabilities necessary to evaluate different options and the tools to collaborate as these alternatives are weighed. “This is not just the classic design field,” Esri president Jack Dangermond said during a  The audience at the GeoDesign Summit heard from more than 30 speakers. talk that welcomed to the summit geodesign practitioners from a diverse range of fields through map overlays and integration and design and GIS professionals, and even and industries including urban planning, modeling to create knowledge of how things marine scientists. Speakers delivered a architecture, transportation, utilities, and are working. One of the great contributions wide range of Lightning Talks, includ- telecommunications. “This mixing of science that the web is making is the collaborative ing Red Fields to Green Fields—Los and design goes right across all of society.” sharing environments that are allowing us to Angeles, a project where geodesign Dangermond underscored the importance of bring our knowledge together over the web to was used as part of the process to putting geodesign to work on pressing issues create better understanding. These trends are create a plan to transform rundown, such as climate change, energy needs, health, half of the story. The thing we need to do is link vacant land into parks and green, open poverty, and biodiversity loss. In hearing former all that information/knowledge with the design space. US president Bill Clinton speak at the recent process [using] tools and methods that allow •• The growing number of higher educa- Eye on Earth Summit, Dangermond said that us to create sustainable designs and environ- tion institutions that are launching he was struck by Clinton’s words about taking ments in the future.” geodesign programs or curriculums. action. “He talked about all the policies and These include Penn State University, discussion about climate change and popula- Geodesign Framework and which is developing a master’s tion, and he said, ‘I’m not really sure all these Technologies program in geodesign, and Northern discussions are going to matter.’ There was At this year’s summit, the conversation among Arizona University, which has already silence in the room. He said, ‘What I actually the 200 attendees focused on the emerging launched a bachelor’s degree in have faith in are real projects. I’m dedicating my technologies for geodesign, geodesign in geographic science and community life to doing projects in [places like] Africa, Latin education, and geodesign case studies. Here planning. America, and India.’ He said where the rubber are some highlights: Speaking at this year’s conference was hits the road is doing real project work. Isn’t •• Technological advances that support Carl Steinitz, Alexander and Victoria Wiley that really what geodesign is about?” geodesign, including demonstrations Professor of Landscape Architecture and of new sketching, design, and scenario Planning Emeritus, Graduate School of Geospatial Systems Essential to management tools in ArcGIS 10, along Design, Harvard University. He just finished Understanding with Esri CityEngine generation of 3D writing the book A Framework for Geodesign, Geospatial systems are critical to understand- content, such as buildings, trees, and which will be published by Esri Press this ing the problems society and organizations roads, from GIS data. summer. Bill Miller, the director of GeoDesign face, according to Dangermond. “They are •• How elements of geodesign are being Services at Esri, wrote a working paper in converting data into maps [or] information,” he put into practice by urban planners, which he says that the book will likely become said. ”They are integrating mapped datasets architects, landscape architects, 14 Esri News for Facilities  Summer 2012
  • 15. Technology an important resource for geodesign practi- After studying the workflows of several incorporate geodesign in their work. tioners and academics. other design firms, Esri developed a set of They included Stuart Rich from PenBay This complete framework includes the tools that would facilitate sketching and Solutions LLC, who spoke about how geode- following: design. This new geodesign window for sign is helping Kuwait University plan con- •• Representation models: How should ArcMap, which will be in the upcoming struction of a new, multibillion-dollar campus; the landscape be described? ArcGIS 10.1 release, lets people easily search Lilian Pintea from the Jane Goodall Institute, •• Process models: How does the land- for and download design templates from who described how geodesign is being used scape operate? ArcGIS Online that include tools for creating, to protect chimpanzees through community- •• Evaluation models: Is the landscape manipulating, and interacting with a design. centered conservation; and Abby Jones from working well? The window also brings together several the Anthro/Ecological Design Collective, •• Change models: How might the land- core tools into one centralized window, with who talked about the role of geodesign in a scape be altered? easy access to the tools that facilitate sketch- project to turn distressed land into parks in •• Impact models: What differences ing and design. Los Angeles. might the changes cause? One key aspect of the window is sce- Jones spoke about geodesign at a small •• Decision models: Should the land- nario management. The ability to create and scale—a neighborhood park or community scape be changed? manage multiple scenarios is something that garden, for example. “In Carl’s book that’s forthcoming, we now has not previously existed in a GIS. With the Keynote speaker Braden Allenby stressed begin to realize that geodesign is not just design in place, said Baker, the next step is to the importance of thinking about geodesign a concept,” said Dangermond. “It can be visualize what a design might look like if built. at a greater, global scale to deal with complex thought of as a systematic process of measur- This can be done with Esri CityEngine issues such as climate change, water resourc- ing and modeling and interpreting and de- software. CityEngine allows an urban form es, biodiversity, and the economy. Allenby, signing and evaluating and making decisions. to be rapidly created on top of GIS data by Lincoln Professor of Engineering and Ethics And articulating that well and embedding that procedurally creating features such as streets, and professor of civil and environmental into the workflows of how we create the future parcels, blocks, buildings, houses, open engineering at Arizona State University, also is the real plot of discussion here.” spaces, and vegetation based on sets of rules. talked about designing for complex adaptive Years from now, Dangermond said, people In the case of O2 Planning + Design, the rules systems such as the Florida Everglades. “You will look back at geodesign as “an evolution- looked at the underlying data to visualize never go backwards in a complex adaptive ary step for humans. It’s going to be, ‘Ah, the density and arrangement of buildings as system. You may go to someplace new, but finally we connected the dots. Finally we described in the foundational land-use and you are not going to get the world that you began to realize the implications or the conse- intensity plans. had. You want to restore the Everglades? quences of our actions.’” High-intensity areas, with mixed-use zoning, It will never happen,” he said. “What you During the summit, product engi- drove denser street network creation, smaller will get is something that is new and maybe neer Matthew Baker from the Software lot sizes, with taller buildings. Likewise, resi- pristine and maybe very biodiverse, but you Development team and solutions engineer dential zoning in low-intensity areas automati- will not get the old Everglades back. . . . What Eric Wittner from GeoDesign Services at Esri cally creates less dense streets, larger lot sizes, we need to do is learn how to design in the demonstrated some work the company is and houses rather than multistory buildings. context of complex adaptive systems.” doing to develop GIS software that supports The buildings and houses can be rendered The GeoDesign Summit ended with a geodesign. Steinitz’s geodesign framework as simple massing models; color coded by thought-provoking talk on the future of remains the key model for the workflows and zoning type; or developed into geometrically geodesign by Stephen Ervin, assistant dean tools developed by Esri to support geode- complex, fully textured buildings with step for information technology at the Harvard sign with ArcGIS, Baker said. “We know that backs, balconies, windows, and terraces. University Graduate School of Design and geodesign is software independent, so our Wittner demonstrated how spatial analysis a lecturer in the department of landscape challenge is, how does our software fit in with inside Esri’s 3D City template can be used to architecture. He looked ahead to what’s pos- this framework?” he asked. drive site analysis and selection; CityEngine sible, probable, certain, likely, unlikely, and With the framework from Steinitz in mind, is then used to do advanced plan visualiza- inevitable in a world with geodesign. tool development efforts focused on studying tion, and the results are pulled back into the While Ervin said he thinks that it’s highly the workflows of several design firms that template for use in analysis. CityEngine, when unlikely any agreed-upon definition of have geodesign projects in the works. One paired with ArcGIS, provides a powerful tool geodesign will ever emerge, one certainty will such firm is O2 Planning + Design, based in for understanding and visualizing what could be a planet of 10 billion people. “It is for these Calgary, Alberta, which is working on a transit- be, in the context of what is. people that we do geodesign,” he said. “It’s oriented development north of the city. not for the trees or the hydrological systems Geodesign workflows involve creating Geodesign in Action or the atmosphere. It’s for the 10 billion suitability and sensitivity layers that will inform Besides watching technology demonstra- people that are our inheritors of what we do.” design, such as a layer that depicts the vulner- tions, which included a presentation about The next GeoDesign Summit will be held able habitats in a proposed development ArcGIS Online, the audience also heard talks January 24–25, 2013, at Esri in Redlands. For study area. from more than a dozen professionals who more information, visit geodesignsummit.com. Summer 2012  esri.com/fm 15
  • 16. Presorted 380 New York Street Standard Redlands, California 92373-8100  usa US Postage Paid Esri 130752  11.3M8/12sp Where ideas are born ArcGIS Online… cloud GIS… mobile GIS… They all SM add up to one conclusion: this is not the year to miss the Esri International User Conference (Esri UC). This is where your ideas come together to shape the future of GIS. Join us in San Diego, California, to discover the next generation of geospatial technology for your organization. Register online at esri.com/uc. Esri International User Conference July 23–27, 2012 | San Diego Convention Center Get in-depth, hands-on training at preconference seminars July 21–22. Copyright © 2012 Esri. All rights reserved.