Gas market scenario in 2011 (.ppt)
•Download as PPT, PDF•
0 likes•870 views

Overview of gas market scenario in Italy 2011.
Recommended

Recommended
More Related Content
More from Edison S.p.A.
More from Edison S.p.A. (20)
Recently uploaded
Recently uploaded (20)
Gas market scenario in 2011 (.ppt)
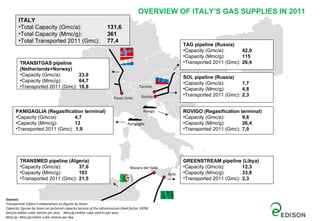
- 1. OVERVIEW OF ITALY’S GAS SUPPLIES IN 2011 ITALY •Total Capacity (Gmc/a): 131,6 •Total Capacity (Mmc/g): 361 •Total Transported 2011 (Gmc): 77,4 TAG pipeline (Russia) •Capacity (Gmc/a): 42,0 •Capacity (Mmc/g): 115 TRANSITGAS pipeline •Transported 2011 (Gmc): 26,4 (Netherlands+Norway) •Capacity (Gmc/a): 23,6 SOL pipeline (Russia) •Capacity (Mmc/g): 64,7 •Capacity (Gmc/a): 1,7 •Transported 2011 (Gmc): 10,8 Tarvisio •Capacity (Mmc/g): 4,8 Gorizia •Transported 2011 (Gmc): 2,3 Passo Gries PANIGAGLIA (Regasification terminal) Rovigo ROVIGO (Regasification terminal) •Capacity (Gmc/a): 4,7 •Capacity (Gmc/a): 9,6 •Capacity (Mmc/g): 13 Panigaglia •Capacity (Mmc/g): 26,4 •Transported 2011 (Gmc): 1,9 •Transported 2011 (Gmc): 7,0 TRANSMED pipeline (Algeria) GREENSTREAM pipeline (Libya) •Capacity (Gmc/a): 37,6 Mazara del Vallo •Capacity (Gmc/a): 12,3 •Capacity (Mmc/g): 103 Gela •Capacity (Mmc/g): 33,8 •Transported 2011 (Gmc): 21,5 •Transported 2011 (Gmc): 2,3 Sources: Transported: Edison’s elaborations on figures by Snam Capacity: figures by Snam on technical capacity tecnica of the infrastructure (load factor 100%) Gmc/a=billion cubic metres per year Mmc/g=milion cubic metres per year Mmc/g= Mmc/g=milion cubic metres per day