We investigated mandibular dental arch form at the levels of both the clinically relevant application points of the orthodontic bracket and the underlying anatomic structure of the apical base. The correlation of both forms was evaluated and examined to determine whether the basal arch could be used to derive a standardized clinical arch form.
2. during the 1930s. He established his diagnostic analysis in
favor of extraction and refined the mechanics for extrac-
tion treatment. Simultaneously, another Angle student,
Begg,10
also changed to the extraction technique and
sought anthropologic evidence for extraction treatment
because of less mastication required in modern diets.
Since then, this theory was confirmed by case reports, and
most orthodontists are now convinced of the validity of
this theory.11,12
However, an objective limit for buccal or
labial tooth movement in any patient, especially those
with mild crowding, is still not available today.2
As the frequency of extraction orthodontic treatment
has decreased over the last 30 years, a new bone-growing
theory has emerged. Esthetic preference for fuller profiles,
temporomandibular disorder problems,2
and the emer-
gence of functional appliance therapy13
were contributing
factors, but, most significantly, it was found that extrac-
tion did not insure stability.14
With stability not guaran-
teed, extraction treatment lost much of its perceived
advantage. Recently, the clinical results of a new orth-
odontic appliance were reported.15
Its developer claimed
that buccal tooth movements without tipping could be
achieved with his biocompatible appliance with extremely
light forces. Computed tomography images of expanded
teeth from severely crowded dental arches were shown,
and apparently healthy alveolar bone was demonstrated as
evidence for this bone-growing theory. Most clinicians,
however, still explain to their patients that there might be
a limit for expansion of the dental arch with any appliance.
Furthermore, we still do not know exactly the limit for
each patient.
The purpose of this study was to investigate the
relationship between the dental arch form and the
supporting bone. We hypothesized that there is a
quantifiable relationship between basal and dental arch
forms, and that basal-bone landmarks can be used as
reliable references for determining biologic arch form
in clinical orthodontics.
MATERIAL AND METHODS
The mandibular dental casts of 35 patients (13
male, 22 female) were randomly selected from a
sample of 750. The mandible was studied because
therapeutic possibilities are more limited than in the
maxilla, and the maxillary arch form is strongly asso-
ciated with the mandibular form.2,16
The subjects’
pretreatment casts were identified as skeletal Class I
(ANB angle, 0°-4°) and dental Class I (canine and
molar relationship according to Angle classification)
with fully developed permanent dentitions from first
molar to first molar. The second molars were excluded
from analysis because the age of most patients pre-
cluded ascertainment of complete eruption of this tooth.
The patients had only minimal restorations with no
prosthetic crowns and were excluded if they had
occlusal wear or gingival defects, or if the mucogingi-
val junction was not identifiable on the model. Mild
crowding or spacing (Ͻ2 mm) was acceptable, but no
subjects requiring extractions for arch-length defi-
ciency were included in the sample. The average age of
these patients was 17 years 11 months.
The dental casts were laser scanned with a computer-
assisted noncontact high-definition 3-dimensional (3D)
scanning system. This system consisted of a laser-
scanning unit (Dental Plaster Model Shape Scanning
System,17
Surflacer model VMS-100F, UNISN, Osaka,
Japan), a computer-aided-design software program
(Dent-Merge, version 5.0; UNISN), and dental cast
analyzing software (Surfacer, version 9.0, Imageware,
Ann Arbor, Mich). This setup was used for image
production and refinement, and landmark identification.
A detailed description of the performance characteris-
tics, including measurement accuracy of this data-
recording system, was reported elsewhere.18
The mea-
suring device of the laser-scanning unit consisted of a
slit-ray laser projector and 2 sets of charged-coupled
device video cameras to capture the reflected images.
X, y, and z coordinate data and data to measure the
circumference of the object was produced as a result.
The scanner was connected to the computer for image
processing. The dental casts were projected and
scanned by a revolving polygon mirror with a slit-ray
laser beam of 670 nm wavelength at 3 mW output.
Triangulation was used to determine the location of
each point with a measurement error of less than 0.05
mm.The generation of 3D graphics of each dental cast
took approximately 80 minutes. About 90,000 sets of
coordinates (x, y, z) per model were stored in the
computer.
Each mandibular dental cast was scanned at 3
angles in the frontal and sagittal planes (Fig 1, a). The
image processor converted the raster coordinates and
brightness data of the analog video signals’ input from
the video cameras into digital data. The computer
imported the digital data and converted the picture
coordinates to 3D spatial coordinates. The data was
synthesized, manually corrected for scanning errors, and
merged into a single data set for each model with the
Dent-Merge software. With cast analyzing software, a 3D
model of the entire mandibular dentition and its adjacent
structures was constructed (Fig 1, b and c).
By using the cast analyzing software, 2 reference
points (1 on the crown, and 1 at the mucogingival
junction) were selected for each tooth from the right to the
left first molar for a total of 24 points for each model.
The FA point is defined as the midpoint of the facial
American Journal of Orthodontics and Dentofacial Orthopedics
Volume 134, Number 3
Ronay et al 431
3. axis of the clinical crown, which is the most prominent
part of the central lobe on each crown’s facial surface
except for the molars.19
For the first molars, the facial
axis of the clinical crown is represented by the mesio-
buccal groove that separates the 2 large facial cusps.
The WALA ridge is defined as the most prominent
point on the soft-tissue ridge immediately occlusal to the
mucogingival junction. It is located at or nearly at the
same vertical level as the horizontal center of rotation of
each tooth.20
WALA was measured directly below FA of
each tooth perpendicular to the occlusal plane. This point
varied in its occlusogingival position from tooth to tooth.
Both points were digitized as coordinates (x, y, z)
and exported in an ASCII format from the Surfacer
software into Excel 2002 software (Microsoft, Red-
mond, Wash). A standard graph format was created to
enable comparisons of the patients. The data was first
translated, shifting the midpoint between the WALA
and FA points of the central incisors to the origin of the
graph (x-y intersection). Then it was rotated, relocating
the midpoint of the first molars to the y-axis. The
positions of the rotated reference points and the curve
were confirmed on the graphic display of the software
program. This method was applied to the data of each
set of FA and WALA points, and average FA and
WALA curves were created (Fig 2).
Statistical analysis
Descriptive statistics including the average and
standard deviation of the relative distances between FA
and WALA points of corresponding teeth were com-
puted and shown graphically. The average values and
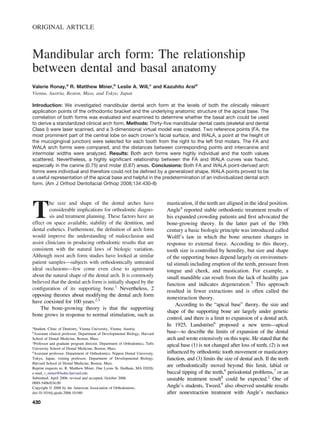
Fig 1. a, Original model scanning; b, polygon wire-frame image; c, Gouraud-shaded image.
Fig 2. Sample FA and WALA curves superimposed.
American Journal of Orthodontics and Dentofacial Orthopedics
September 2008
432 Ronay et al
4. standard deviations of the intercanine and intermolar
widths at FA and WALA including their ratios were
calculated. The Pearson correlation coefficients be-
tween the width at the bilateral FA points and the
WALA points at the canine and molar levels were
calculated and statistically analyzed at the 0.01 and
0.05 levels of significance. Furthermore, the Pearson
correlation coefficients between the ratios at the FA and
WALA point widths were calculated and also statisti-
cally analyzed at the 0.01 and 0.05 levels. These
evaluations were made to investigate the relationship
between points representing the dental arch and those
constituting the basal arch.
RESULTS
A data table was created for each patient (Fig 3).
All 3 coordinates (x, y, z) of the FA and the WALA
points were described for each tooth, starting at the
right first molar and ending with the left first molar. The
third dimension (z, vertical) was omitted in further
analysis to facilitate comparison in arch width and
length. To compare patients, the data was standardized
as described above. The patient tables also show the
absolute distance between FA and WALA of the
corresponding teeth in millimeters. The FA and WALA
curves were superimposed to evaluate their relationship
Fig 3. Digitized FA and WALA points were imported into Excel 2002 (Microsoft, Redmond, Wash).
First, the distances between the 12 pairs were digitally calculated to create the “original” data. Then
the data was “translated” with the midline at the origin of the x-y axis. Finally, the data was “rotated”
to relocate the first molars as bilateral reference points for standardized y-axis positioning that
would permit comparison between subjects. Canine and molar widths and depths, and canine to
molar ratios, were determined. This method was applied to each FA-WALA data set. FDI
tooth-numbering system; R, right; L, left.
American Journal of Orthodontics and Dentofacial Orthopedics
Volume 134, Number 3
Ronay et al 433
5. (Fig 2). Male and female data were combined because
initial analysis showed them to be indistinguishable.
The distribution of FA and WALA points on the
mandibular cast is shown in Figures 4 and 5, respec-
tively, with the FA and WALA curves produced
through connection of their single values by linear
interpolation. Those curves are individual and the
values describing the same teeth are scattered, espe-
cially in the premolar and molar areas.
The average relative distances between correspond-
ing FA and WALA points were created by summing the
values of the right and left sides. This data (Table I) is
shown in Figure 6, illustrating which FA points are
located more lingually (positive values) and which are
located more labially (negative values) in relation to
corresponding WALA points.
Table II gives the intercanine and intermolar widths
for the FA and WALA points in millimeters and the FA
Fig 4. FA curves created through linear interpolation of the individual FA values.
Fig 5. WALA curves created through linear interpolation of the individual WALA values.
American Journal of Orthodontics and Dentofacial Orthopedics
September 2008
434 Ronay et al
6. and WALA ratios of the canines and molars to each
other, including averages and standard deviations. In
the canine area, increasing distances between FA points
were accompanied by increasing distances between
WALA points. However, the corresponding increase in
distances between FA points was always larger. With a
canine correlation coefficient of 0.75, this data was
highly statistically significant (Table III). Similarly, in
the molar region where the proportional increase in
distances between the WALA points was even larger,
the correlation was also highly significant (0.87). A
comparison of the x- and y-coordinates shows that in
the canine area there was greater variation in FA than in
WALA distances. To a lesser degree, this tendency was
also observed in the molar region.
DISCUSSION
Retention is still a major issue in orthodontics.
Theories have been proposed to minimize posttreat-
ment relapse, such as creating a proper occlusion4
and
muscular balance,21
uprighting mandibular incisors,22
and maintaining the pretreatment apical base6
and
intercanine and intermolar widths.14
The purpose of our
analysis was to estimate arch dimensions that permit
stable treatment goals.2
Orthodontists generally accept
the importance of respecting basal bone when planning
treatment. Treatment decisions regarding arch form in
particular should be related to the patient’s underlying
basal anatomy.
The definition of apical base is not completely clear
in the literature. These words—apical base, basal bone,
basal arch, and supporting bone—are not anatomic
terminology and are used only in orthodontics. Defini-
tions of the vertical position of the basal area of the
alveolar process vary. For example, in 1925, Lund-
ström6
defined it as follows: “in normal cases the apical
base will in the horizontal plane coincide with the
region in which the apices of the roots are located.”
Howes23
stated that the basal arch refers to the apical
third of the alveolus and the bone that supports the
alveolar processes below the mandibular teeth. He also
explained that it is the most constricted area of the
alveolus and is generally about 8 mm below the
gingival margin.
Clinicians generally assess basal anatomy by either
subjective palpation or analyzing lateral cephalograms.
The latter uses Points A and B to define the anterior
limit of the apical bases, but it obviously does not take
into account actual width and overall size. With dental
casts, the method of recording the most concave con-
tour of the sulci in relation to the apices of the teeth has
been reported.24
Various studies have looked at the position of the
teeth in the basal bone, and several methods for
determining this relationship have been used. In 1945,
Tweed25
described a method of sectioning dental casts
in the midline to determine the relationship of the
incisors to the alveolar and basal bone. Sergl et al24
measured the maxillary and mandibular apical base
area using a gnathograph specially designed for this
purpose. Oda et al26
presented a technique to record and
evaluate mandibular apical base form and tooth posi-
tion with computed tomography scans.
The use of 3D scanning devices has been reported
recently.27
The area of interest is most likely between
the bottom of a periodontal pocket and the apex of a
tooth. A reason for this variation in definition is the
difficulty in estimating the height of the root apex of
tooth without x-ray evaluation. However, there is not
enough data about the limit of buccal or labial tooth
movements, and it is not clear how much the bones can
be changed. In 2000, Andrews and Andrews20
pro-
posed a new term, WALA ridge, to indicate a surface
structure at the same level as basal bone. The WALA
ridge is the ridge of tissue at the mucogingival junction,
and they suggested that the horizontal arch shape of this
ridge of an initial mandibular basal arch in an orthodon-
tic patient is similar to the archwire form of the dental
arch. The WALA ridge is easy to identify and might be
more clinically reliable than estimation of the root
apex. However, that hypothesis has not been widely
discussed and confirmed. This is the first report that
examines the usefulness of WALA points to represent
the basal arch and their relevance in determining dental
arch form, but further research is required.
The use of different points in different reports could
have caused confusion regarding arch form. Some
studies used the arch form based on points where the
orthodontic bracket is placed, and others used the arch
form connecting the incisal edges and cusp tips of the
teeth. Different results are obtained with these measure-
ment methods on the same dental cast.28
This is the first
study to investigate the mandibular dental arch form
while considering both the clinically relevant working
point of the orthodontic bracket and wire and the
underlying anatomic-biologic structure of the basal
bone to correlate these structures. Most other arch-form
Table I. Average distances (mm) of WALA points
relative to corresponding FA points and their standard
deviations (n ϭ 70) (FDI tooth-numbering system)
Tooth 1 2 3 4 5 6
Average Ϫ1.21 Ϫ0.88 Ϫ0.32 0.59 1.78 2.77
SD 1.24 1.07 1.63 1.28 1.10 0.89
American Journal of Orthodontics and Dentofacial Orthopedics
Volume 134, Number 3
Ronay et al 435
7. studies attempted to fit generalized mathematic or
geometric functions to the dentition but did not look for
an anatomic reference for deriving an “ideal” form for
each patient.
Arch form has been analyzed on plaster reproduc-
tions of the dentition for years. By using digital models
(3D virtual images), point identification takes on new
meaning, particularly for basal arch form. Each identi-
fied point has 3 known Cartesian coordinates that
permit precise analysis of its position. Relationships
between some points can be determined on digital
models regardless of interfering structures. Virtual
points within the model can also be created and
comparisons made between internal and external or
surface landmarks.
Relatively large individual variations of dental arch
form were found with both FA and WALA points as
shown in Figures 4 and 5, in spite of excluding dental
casts with significant crowding or irregularities. This
can be seen as a naturally occurring variation of tooth
position and bone anatomy in Class I occlusion. These
wide variations in dental and basal arches can be
explained by genetic background and environmental
factors influencing the patient’s growth and develop-
ment. These observations suggest that the quantified
arch forms are highly individual and should not be
viewed as variations of a general arch form as had been
done in the past.
On the other hand, a statistically significant positive
correlation was found between the dental and basal
arches in untreated patients. Comparisons of canine and
molar values in Tables II and III show a constant
relationship between dental and basal arch forms. A
statistically significant positive correlation of canine
and molar widths to corresponding FA and WALA
points was found. This suggests that the dental arch
form is affiliated with the basal arch form (defined by
the WALA points) in each patient, supporting the
above-mentioned apical base theory. If the dental arch
form is altered without considering the basal arch form,
it might result in unhealthy periodontal conditions or
unstable treatment results. Additionally, by determin-
ing WALA values, one can estimate their correspond-
ing FA values and then determine clinical arch form,
which can produce an archwire form. A statistically
significant positive correlation also was found for the
WALA and FA canine-to-molar width ratio. This rela-
tionship was observed for both dental arch size and
shape.
These findings have considerable relevance for
treatment outcomes. An implant study in the 1980s
reported significant lateral expansion of the maxillary
basal bone by a functional appliance.13
A recent article
reported thinned or dehisced buccal plates after maxil-
lary palatal expansion therapy with computed tomog-
raphy.29
Ultimately, the new bone-growing theory is
still at odds the apical base theory.15
The new bone-
growing theorists claim that crowded posterior teeth
can be moved laterally, and buccal bones can be
developed without tipping and bone loss with ex-
tremely light forces. However, most orthodontists be-
lieve that the dental arch cannot usually be expanded in
a short time without a heavier force, such as with
palatal expansion. Thus, a classic controversy in orth-
Fig 6. Average distances (mm) of WALA points relative to corresponding FA points and their
standard deviations (n ϭ 70).
American Journal of Orthodontics and Dentofacial Orthopedics
September 2008
436 Ronay et al
8. odontics has been reignited. Research on the morphol-
ogy of the supporting bone after conventional and
newly developed orthodontic mechanics and stability
of the treatment results is therefore critical, and the
WALA and FA points used in this study might be
useful references for this purpose.
Our results demonstrate the ability to look at the
apical base and predict a patient’s dental arch form. It
will be of future interest to study whether other ana-
tomic landmarks could serve as an even more accurate
representations of basal bone. Additionally, it should be
determined whether the buccolingual relationships be-
tween the FA and WALA points are related to archwire
torque. Further research should also include the third
dimension when assessing patient data to give clini-
cians more information about the curve of Spee. How-
ever, the vertical distribution of WALA points might
depend on not only tooth inclination but also periodon-
tal conditions, such as the attachment level or the root
length of the patient. We expect that the WALA-FA
relationships will be different in patients with Class II
and Class III dental and skeletal relationships, as well
as in adults relative to growing patients. These are the
subjects of continuing investigations.
This study shows that distal to the mandibular
canines, the average distance between FA and WALA
points describing the same tooth changes buccolin-
gually. In this posterior area, the FA points are more
lingually located than the WALA points. This fact
might be linked to the clinically observed gradient of
crown torque along the dental arch but also to the
differences in basal vs dental arch shape. Andrews and
Andrews20
obtained different results. They reported
only positive values between FA and WALA points and
projected that the points at the mucogingival junction
were always more buccally positioned than the most
prominent part of the tooth crown. The difference in
results can be explained by their method or sample
selection. Nonetheless, our findings support their hy-
pothesis that WALA points can be used to describe the
basal arch and to draw conclusions regarding the
dimensions of the dental arch form. Additionally,
individual variations of the distance between the
WALA and FA points for each tooth were observed.
This might reflect the buccolingual inclination of the
teeth.
As a result of our research, we cannot confirm past
research postulating the existence of an ideal arch form
template. On the contrary, this study suggests that all
basal and dental arches should be individually derived.
Furthermore, the basal arch, represented by WALA
points, can be used as a clinical guide in fabricating
Table III. Correlation coefficients between FA and
WALA points at 3-3 width, 6-6 width, and (3-3/6-6)
ratio
3-3
width
6-6
width
(3-3/6-6)
ratio (%)
Correlation coefficient 0.750 0.869 0.750
t value (degree of freedom n-2 ϭ 33) 6.520 10.105 6.516
5% significance level 1.69 1.69 1.69
1% significance level 2.45 2.45 2.45
3-3, Canine to canine; 6-6, first molar to first molar.
Table II. FA and WALA point distances between ca-
nines and molars and their ratios
Patient
Distances (mm)
Ratios (%)
FA points WALA points
FA
ratio
(3-3/6-6)
WALA
ratio
(3-3/6-6)
3-3
width
6-6
width
3-3
width
6-6
width
1 28.00 54.50 29.27 60.27 51.37 48.57
2 27.05 50.26 26.50 54.54 53.81 48.59
3 29.80 52.50 28.50 57.76 56.77 49.33
4 28.29 55.28 30.85 59.25 51.17 52.07
5 26.81 48.34 29.37 56.10 55.45 52.34
6 28.26 53.35 30.82 58.15 52.97 53.00
7 30.01 48.77 31.50 54.75 61.53 57.53
8 27.07 52.29 28.01 55.78 51.77 50.23
9 26.00 50.29 28.26 56.33 51.70 50.17
10 26.50 50.75 28.00 53.78 52.21 52.05
11 28.95 56.48 29.42 57.58 51.25 51.10
12 27.02 53.11 27.01 59.26 50.86 45.57
13 26.05 50.10 28.29 56.78 52.00 49.82
14 26.36 48.93 26.53 53.41 53.87 49.67
15 26.05 53.14 24.34 57.35 49.02 42.45
16 28.53 51.59 30.76 59.55 55.31 51.65
17 28.00 48.75 30.75 53.25 57.43 57.76
18 29.54 51.05 30.04 54.06 57.87 55.58
19 24.27 45.50 23.75 49.75 53.35 47.73
20 30.25 59.30 29.75 66.51 51.02 44.73
21 26.50 49.00 27.75 53.75 54.08 51.62
22 29.50 50.74 31.75 57.00 58.12 55.71
23 25.76 47.83 27.81 52.80 53.87 52.68
24 23.52 51.00 24.50 55.50 46.11 44.14
25 27.54 50.01 27.00 52.76 55.06 51.17
26 27.01 49.77 30.00 55.01 54.26 54.53
27 25.67 46.34 27.25 53.05 55.40 51.37
28 28.75 50.50 31.01 58.50 56.92 53.01
29 29.95 54.35 30.29 60.59 55.11 49.99
30 27.00 50.99 30.50 54.75 52.94 55.71
31 27.50 53.00 29.75 58.75 51.88 50.63
32 27.25 54.00 29.99 59.77 50.46 50.18
33 27.07 46.40 29.55 52.81 58.35 55.96
34 29.26 49.31 29.51 55.79 59.34 52.90
35 27.77 50.33 30.04 56.30 55.17 53.36
Average 27.51 51.08 28.81 56.32 53.94 51.22
SD 1.60 2.92 2.02 3.14 0.03 0.04
3-3, Canine to canine; 6-6, first molar to first molar.
American Journal of Orthodontics and Dentofacial Orthopedics
Volume 134, Number 3
Ronay et al 437
9. individualized archwire templates. Consideration of the
anatomy of each mandibular base also ensures that
optimal function of the occlusion, periodontal health,
desired esthetic appearance, and, of course, stability of
the dental arch form can be achieved. With increasing
access to 3D patient data, this important information
will be available to practitioners and must be consid-
ered in orthodontic treatment planning and archwire
design.
CONCLUSIONS
1. Arch forms derived from both FA and WALA are
individual and cannot be defined by 1 generalized
shape. These results show that form, degree of
curvature, and other parameters of the alveolar
ridge and dental arch are subject to much variation.
2. WALA points can be useful in the predetermination
of a dental arch form. The highly significant corre-
lation of WALA and FA point width in the canine
and molar areas proves that assessments of WALA
points enable prediction of corresponding FA val-
ues and the clinical arch form.
We thank Mutsuji Muramoto, UNISN, Osaka, Ja-
pan, for generously providing the VMS Dental Plaster
Model Shape Scanning System for this study.
REFERENCES
1. Brash JC. The etiology of irregularity and malocclusion of the
teeth. 2nd ed. London: Dental Board of the United Kingdom;
1956.
2. Proffit WR, Fields HW. Contemporary orthodontics. 3rd ed. St
Louis: Mosby Yearbook; 2000. p. 240-93.
3. Peck S. The state of our specialty. Angle Orthod 2004;74:iv.
4. Angle EH. Bone-growing. Dent Cosmos 1910;52:261-7.
5. Corruccini RS. How anthropology informs the orthodontic diag-
nosis of malocclusion’s causes. Mellen studies in anthropology.
Vol. 1. Lewiston, NY: Edward Mellen Press; 1999.
6. Lundström AF. Malocclusion of the teeth regarded as a problem
in connection with the apical base. Int J Orthod Oral Surg
Radiogr 1925;9:591-602, 724-31, 793-812, 933-40, 1022-42,
1109-33.
7. Betts NJ, Vanarsdall RL, Barber HD, Higgins-Barber K, Fonseca
RJ. Diagnosis and treatment of transverse maxillary deficiency.
Int J Adult Orthod Orthognath Surg 1995;10:75-96.
8. Strang RHW. The fallacy of denture expansion as a treatment
procedure. Angle Orthod 1949;19:12-22.
9. Tweed CH. Clinical orthodontics. Vol. 1. St Louis: Mosby; 1966.
10. Begg PR. Begg orthodontic theory and technique. Philadelphia:
Saunders; 1965.
11. Buchner HJ. An answer to some criticisms of treatment follow-
ing bicuspid extractions. Angle Orthod 1949;19:23-47.
12. Rees DJ. A method for assessing the proportional relation of
apical bases and contact diameters of the teeth. Am J Orthod
1953;39:695-707.
13. Brieden CM, Pangrazio-Kulbersh V, Kulbersh P. Maxillary
skeletal and dental changes with Fränkel appliance therapy—an
implant study. Angle Orthod 1984;54:226-32.
14. Little RM. Stability and relapse of dental arch alignment. Br J
Orthod 1990;17:235-41.
15. Damon DH. Treatment of the face with biocompatible orthodon-
tics. 4th ed. In: Graber TM, Vanarsdall RL, Vig KW, editors.
Orthodontics: current principles and techniques. St Louis:
Elsevier-Mosby; 2005. p. 753-832.
16. Ricketts RM. Design of arch form and details for bracket
placement. Denver: Rocky Mountain Orthodontics; 1979.
17. Arai K, Ishikawa H. Application of non-contact three-dimen-
sional shape measuring system to dental cast. Reduction of blind
region. Orthod Waves 1999;58:148-53.
18. Hayama K, Arai K, Ishikawa H. Correlation between upper and
lower dental arch forms by fitting of fourth-order polynomials.
Orthod Waves 2000;59:303-11.
19. Andrews LF. Composites. I: straight-wire, the concept and
appliance. San Diego: L. A. Wells; 1989. p. 13-33.
20. Andrews LF, Andrews WA. The six elements of orofacial
harmony. Andrews J 2000;1:13-22.
21. Proffit WR. Muscle pressure and tooth position: North American
white and Australian aborigines. Angle Orthod 1975;45:1-11.
22. Tweed DH. Frankfort-mandibular plane angle in orthodontic
diagnosis, classification, treatment planning and prognosis. Am J
Orthod Oral Surg 1946;32:175-230.
23. Howes JH. A polygon portrayal of coronal and basal arch
dimensions in the horizontal plane. Am J Orthod 1954;40:
811-31.
24. Sergl HG, Kerr WJS, McColl JH. A method of measuring the
apical base. Eur J Orthod 1996;18:479-83.
25. Tweed CH. A philosophy of orthodontic treatment. Am J Orthod
Oral Surg 1945;31:74-103.
26. Oda Y, Takada K, Sakuda M. Description of mandibular apical
base form and tooth arrangement by means of spline functions.
Nippon Kyosei Shika Gakkai Zasshi 1987;46:751-8.
27. Fujita K, Takada K, QianRong G, Shibata T. Patterning of
human dental arch wire blanks using a vector quantization
algorithm. Angle Orthod 2002;72:285-94.
28. Bennett JC, McLaughlin RP. Arch form considerations for
stability and esthetics. Rev Esp Ortod 1999;29:46-63.
29. Garib DG, Henriques JFC, Janson G, de Freitas MR, Fernades
AY. Periodontal effects of rapid maxillary expansion with
tooth-tissue-borne and tooth-borne expanders: a computed to-
mography evaluation. Am J Orthod Dentofacial Orthop 2006;
129:749-58.
American Journal of Orthodontics and Dentofacial Orthopedics
September 2008
438 Ronay et al