SlideShare une entreprise Scribd logo
1  sur  13
Télécharger pour lire hors ligne
Monthly Indicators
A RESEARCH TOOL PROVIDED BY THE GREATER BOSTON ASSOCIATION OF REALTORS®

January 2014

Quick Facts

The same factors that catalyzed widespread market recovery in 2012 and 2013
are likely to continue in 2014, though perhaps at a more moderate pace. That's
not a bad thing, since the market is returning to a stable, healthy state. Potential
trends to watch for in 2014 include increased seller activity, more new
construction and fewer foreclosures on the market. Inventory is another metric
to watch this year.
New Listings in the Greater Boston region were down 15.7 percent for detached
homes and 18.2 percent for condominiums. Closed Sales decreased 6.0
percent for detached homes but increased 0.8 percent for condominiums.
The Median Sales Price was up 12.8 percent to $485,100 for single-family
properties and 13.9 percent to $420,500 for condominiums. Months Supply of
Inventory decreased 24.9 percent for single-family units and 30.9 percent for
townhouse-condo units.
Given how far the market has come, it's a good time for folks to reassess their
situation. Many who were hesitant to sell in recent years may find themselves in
a completely different position. Getting a fresh comparative market analysis
might be a good idea. Interest rates remain attractive and should remain below
their long-term average, but they are expected to creep higher in 2014.
Politicians are gearing up for midterm elections, so pay close attention to
campaign messaging as relates to real estate or mortgage financing. Job
growth is still fundamental and is likely to dominate this election cycle.

- 2.9%

- 6.0%

+ 0.8%

Year-Over-Year
(YoY) Change in
Closed Sales
All Properties

Year-Over-Year
(YoY) Change in
Closed Sales
Single-Family Only

Year-Over-Year
(YoY) Change in
Closed Sales
Condominium Only

Single-Family Market Overview
Condominium Market Overview
Closed Sales
Median Sales Price
Housing Affordability Index
Inventory of Homes for Sale
Months Supply of Inventory
Days On Market Until Sale
Percent of Original List Price Received
Pending Sales
New Listings
City of Boston Overview

2
3
4
5
6
7
8
9
10
11
12
13

Click on desired metric to jump to that page.

Data is refreshed regularly to capture changes in market activity so figures shown may be different than previously reported. Current as of February 18, 2014. All data from MLS Property
Information Network, Inc. Provided by Greater Boston Association of REALTORS® and the Massachusetts Association of REALTORS®. Powered by 10K Research and Marketing.
Single-Family Market Overview
Key market metrics for the current month and year-to-date figures for Single-Family Homes Only.

Key Metrics

Historical Sparklines

Jan-2013 Jan-2014

Closed Sales

+/–

YTD 2013 YTD 2014

+/–

597

1-2013
1 2013

1-2012

1-2013

1-2012

1-2013

1-2012

1-2013

1-2012

1-2013

1-2012

1-2013

- 29.4%

--

--

--

2.9

- 24.9%

--

--

--

79

- 27.0%

108

79

- 27.0%

95.6%

+ 1.9%

93.9%

95.6%

+ 1.9%

549

- 11.7%

622

549

- 11.7%

733

- 15.7%

870

733

- 15.7%

1-2014

New Listings
1-2011

1,617

1-2014

Pending Sales
1-2011

- 22.4%

1-2014

Percent of Original
List Price Received
1-2011

97

1-2014

Days on Market Until Sale
1-2011

125

1-2014
1 2014

Months Supply of Inventory
1-2011

- 22.4%

870

1-2012
1 2012

97

1-2014

Inventory of Homes for Sale
1-2011
1 2011

+ 12.8%

622

1-2013

$485,100

93.9%

1-2012

$430,000

1-2014

Housing Affordability Index
1-2011

+ 12.8%

108

1-2013

$485,100

3.8

1-2012

- 6.0%

1-2014

Median Sales Price
1-2011

561

2,291

1-2013

597

125

1-2012

- 6.0%

$430,000

1-2011

561

1-2014

All data from MLS Property Information Network, Inc. Provided by the Greater Boston Association of REALTORS® and the Massachusetts Association of REALTORS®. Powered by 10K Research and Marketing. | Click for Cover Page | 2
Condominium Market Overview
Key market metrics for the current month and year-to-date figures for Condominium Properties Only.

Key Metrics

Historical Sparklines

Jan-2013 Jan-2014

Closed Sales

+/–

YTD 2013 YTD 2014

+/–

514

1-2013
1 2013

1-2012

1-2013

1-2012

1-2013

1-2012

1-2013

1-2012

1-2013

1-2012

1-2013

- 30.4%

--

--

--

2.1

- 30.9%

--

--

--

63

- 28.9%

88

63

- 28.9%

97.4%

+ 1.7%

95.8%

97.4%

+ 1.7%

636

- 3.0%

656

636

- 3.0%

738

- 18.2%

902

738

- 18.2%

1-2014

New Listings
1-2011

1,101

1-2014

Pending Sales
1-2011

- 22.9%

1-2014

Percent of Original
List Price Received
1-2011

110

1-2014

Days on Market Until Sale
1-2011

143

1-2014
1 2014

Months Supply of Inventory
1-2011

- 22.9%

902

1-2012
1 2012

110

1-2014

Inventory of Homes for Sale
1-2011
1 2011

+ 13.9%

656

1-2013

$420,500

95.8%

1-2012

$369,250

1-2014

Housing Affordability Index
1-2011

+ 13.9%

88

1-2013

$420,500

3.1

1-2012

+ 0.8%

1-2014

Median Sales Price
1-2011

518

1,582

1-2013

514

143

1-2012

+ 0.8%

$369,250

1-2011

518

1-2014

All data from MLS Property Information Network, Inc. Provided by the Greater Boston Association of REALTORS® and the Massachusetts Association of REALTORS®. Powered by 10K Research and Marketing. | Click for Cover Page | 3
Closed Sales
A count of the actual sales that have closed in a given month.

January

Year to Date

YoY
Change

Single-Family

Condominium

YoY
Change

Feb-2013

597

597

561

561

518

514

518

- 8.0%

435

+ 13.3%

616

- 3.8%

628

+ 3.6%

Apr-2013

518

518

410

767

+ 4.4%

805

+ 6.5%

May-2013

1,096

+ 10.0%

1,068

+ 6.4%

Jun-2013

514

410

425

Mar-2013

1,480

- 1.1%

1,246

- 1.0%

Jul-2013

+15.3%

-6.0%

Single-Family

2013

2014

+25.4%

+0.8%

Condominium

2012

2013

2014

+15.3%

-6.0%

Single-Family

2012

2013
+25.4%

+0.8%

919

+ 22.4%

888

+ 18.9%

855

+ 10.5%

764

+ 7.5%

791

- 11.4%

710

- 6.0%

897

+ 10.2%

788

+ 2.9%

Jan-2014

2014

+ 6.1%

Dec-2013
2012

+ 20.7%

1,275

Nov-2013

2014

1,252

+ 11.6%

Oct-2013

2013

+ 18.0%

1,428

Sep-2013

2012

1,488

Aug-2013

561

- 6.0%

518

+ 0.8%

11,323

+ 5.8%

10,377

+ 6.5%

Total

Condominium

Historical Closed Sales Activity

Single-Family

Condominium

1,800
1,600
1,400
1,200
1,000
800
600
400
200
Jan-2003

Jan-2004

Jan-2005

Jan-2006

Jan-2007

Jan-2008

Jan-2009

Jan-2010

Jan-2011

Jan-2012

Jan-2013

Jan-2014

All data from MLS Property Information Network, Inc. Provided by the Greater Boston Association of REALTORS® and the Massachusetts Association of REALTORS®. Powered by 10K Research and Marketing. | Click for Cover Page | 4
Median Sales Price
Median price point for all closed sales, not accounting for seller concessions, in a given month.

January

Year to Date

$480,000

+ 14.3%

$387,500

+ 4.3%

May-2013

$500,000

+ 7.2%

$410,000

+ 7.5%

Jun-2013

$545,000

+ 8.1%

$420,000

+ 5.0%

$533,000

+ 4.1%

$400,500

+ 3.5%

$521,000

+ 5.5%

$416,000

+ 9.5%

$502,500

+ 15.5%

$410,000

+ 9.3%

$474,000

+ 9.0%

$416,750

+ 13.8%

Nov-2013

$369,250

+ 19.1%

Oct-2013

$355,000

- 5.4%

$405,000

Sep-2013

$369,250

$350,000

+ 3.6%

Aug-2013

$355,000

$420,500

$406,500

+ 8.3%

$430,101

Jul-2013

$420,500

$406,500

$430,000

Apr-2013

$485,100
$430,000

Condominium

Mar-2013

$430,000

YoY
Change

Feb-2013

$485,100

Single-Family

YoY
Change

$480,000

+ 6.7%

$410,750

+ 8.1%

Dec-2013
2012

2013

2014

+5.8%

+12.8%

Single-Family

2012

2013

2014

+4.0%

+13.9%

Condominium

2012

2013

2014

+5.8%

+12.8%

Single-Family

2012

2013
+4.0%

+ 6.4%

$420,400

+ 10.5%

$485,100

+ 12.8%

$420,500

+ 13.9%

Median

+13.9%

$499,950

Jan-2014

2014

$500,000

+ 8.0%

$409,000

+ 7.6%

Condominium

Historical Median Sales Price

Single-Family

Condominium

$550,000

$500,000

$450,000

$400,000

$350,000

$300,000

$250,000
Jan-2003

Jan-2004

Jan-2005

Jan-2006

Jan-2007

Jan-2008

Jan-2009

Jan-2010

Jan-2011

Jan-2012

Jan-2013

Jan-2014

All data from MLS Property Information Network, Inc. Provided by the Greater Boston Association of REALTORS® and the Massachusetts Association of REALTORS®. Powered by 10K Research and Marketing. | Click for Cover Page | 5
Housing Affordability Index
This index measures housing affordability for the region. An index of 120 means the median household income was 120% of what is necessary
to qualify for the median-priced home under prevailing interest rates. A higher number means greater affordability.

January

Year to Date

Single-Family

120

YoY
Change

Feb-2013

110

110

97

97

- 1.6%

146

+ 11.2%

121

+ 3.4%

128

- 8.8%

112

- 5.3%

136

+ 2.9%

May-2013

104

- 4.8%

124

- 4.9%

Jun-2013

125

122

Mar-2013

143
135

125

Condominium

Apr-2013

143
135
120

YoY
Change

90

- 11.8%

114

- 9.2%

Jul-2013

92

- 9.2%

120

- 8.5%

Aug-2013

93

- 11.2%

115

- 13.9%

Sep-2013

98

- 18.5%

118

- 14.0%

Oct-2013

103

- 13.4%

116

- 16.6%

Nov-2013

108

- 6.7%

125

- 7.7%

Dec-2013
2012

2013

2014

+4.1%

-22.4%

Single-Family

2012

2013

2014

+5.6%

2012

-22.9%

2014

+4.1%

Condominium

2013

99

- 11.8%

117

- 14.6%

2013

2014

Jan-2014

97

- 22.4%

110

- 22.9%

+5.6%

-22.4%

Single-Family

2012

-22.9%

Average

103

-9.4%

122

-8.9%

Condominium

Historical Housing Affordability Index

Single-Family

Condominium

160
150
140
130
120
110
100
90
80
70
60
Jan-2004

Jan-2005

Jan-2006

Jan-2007

Jan-2008

Jan-2009

Jan-2010

Jan-2011

Jan-2012

Jan-2013

Jan-2014

All data from MLS Property Information Network, Inc. Provided by the Greater Boston Association of REALTORS® and the Massachusetts Association of REALTORS®. Powered by 10K Research and Marketing. | Click for Cover Page | 6
Inventory of Homes for Sale
The number of properties available for sale in active status at the end of a given month.

January

Single-Family

- 41.5%

1,731

- 47.0%

2,766

- 34.9%

1,973

- 40.2%

3,034

- 30.8%

2,068

- 35.1%

3,024

- 26.8%

2,022

- 31.9%

Jul-2013

2,854

- 25.2%

1,854

- 32.3%

Aug-2013

2,747

- 23.7%

1,731

- 28.6%

Sep-2013

2,978

- 20.8%

1,940

- 23.3%

Oct-2013

2,839

- 18.3%

1,860

- 19.9%

Nov-2013

1,101

1,699

- 40.7%

Jun-2013

1,582

- 32.5%

2,375

May-2013

1,617

2,399

Apr-2013

2,291

YoY
Change

Mar-2013

2,743

Condominium

Feb-2013

3,294

YoY
Change

2,342

- 21.5%

1,524

- 24.0%

Dec-2013

2012

2013

2014

-30.4%
Single-Family

-29.4%

1,715

- 25.2%

1,174

- 22.9%

2013

2014

Jan-2014

1,617

- 29.4%

1,101

- 30.4%

-42.3%
Condominium

2012

-30.4%

Average

2,558

- 27.9%

1,723

- 32.8%

Historical Inventory of Homes for Sale

Single-Family

Condominium

9,000
8,000
7,000
6,000
5,000
4,000
3,000
2,000
1,000
Jan-2003

Jan-2004

Jan-2005

Jan-2006

Jan-2007

Jan-2008

Jan-2009

Jan-2010

Jan-2011

Jan-2012

Jan-2013

Jan-2014

All data from MLS Property Information Network, Inc. Provided by the Greater Boston Association of REALTORS® and the Massachusetts Association of REALTORS®. Powered by 10K Research and Marketing. | Click for Cover Page | 7
Months Supply of Inventory
The inventory of homes for sale at the end of a given month, divided by the average monthly pending sales from the last 12 months.

January

Single-Family

- 48.4%

2.8

- 48.9%

3.6

- 37.6%

2.5

- 43.8%

2.8

- 37.1%

1.9

- 39.0%

2.0

- 26.0%

1.6

- 31.2%

Jul-2013

1.9

- 36.6%

1.5

- 44.0%

Aug-2013

1.9

- 31.6%

1.4

- 32.7%

Sep-2013

3.2

- 35.3%

2.2

- 35.4%

Oct-2013

3.3

- 26.0%

2.4

- 25.5%

Nov-2013

2.1

3.9

- 38.4%

Jun-2013

3.1

- 26.7%

3.9

May-2013

2.9

5.6

Mar-2013

3.8

YoY
Change

Apr-2013

6.4

Condominium

Feb-2013

6.7

YoY
Change

3.0

- 11.3%

2.1

- 19.1%

Dec-2013

2012

2013
-39.7%
Single-Family

2012

-24.9%

1.9

- 32.2%

1.5

- 25.1%

2013

2014

Jan-2014

2.9

- 24.9%

2.1

- 30.9%

-54.0%
Condominium

2014

-30.9%

Average

2.8

- 35.7%

2.0

- 42.2%

Historical Months Supply of Inventory

Single-Family

Condominium

16
14
12
10
8
6
4
2
0
Jan-2004

Jan-2005

Jan-2006

Jan-2007

Jan-2008

Jan-2009

Jan-2010

Jan-2011

Jan-2012

Jan-2013

Jan-2014

All data from MLS Property Information Network, Inc. Provided by the Greater Boston Association of REALTORS® and the Massachusetts Association of REALTORS®. Powered by 10K Research and Marketing. | Click for Cover Page | 8
Days on Market Until Sale
Average number of days between when a property is listed and when an offer is accepted in a given month.

January

Year to Date

2014

-17.2%

-27.0%

Single-Family

2012

2013

2014

-29.4%

-28.9%

Condominium

2012

2013

2014

-17.2%

-27.0%

Single-Family

2012

2014

-29.4%

-28.9%

- 35.1%

51

- 40.3%

56

- 37.9%

43

- 42.4%

47

- 41.6%

38

- 46.2%

48

- 45.1%

40

- 47.3%

57

- 36.1%

49

- 41.7%

59

- 33.7%

47

- 43.9%

65

- 27.2%

51

- 33.6%

70

- 28.0%

55

- 34.1%

Jan-2014

2013

63

- 22.3%

Dec-2013
2013

- 22.8%

75

Nov-2013

2012

93

Oct-2013

63

- 39.0%

Sep-2013

63

- 22.6%

71

Aug-2013

88
79

95

- 17.4%

Jul-2013

88
79

- 16.7%

107

Jun-2013

108

111

May-2013

108

YoY
Change

Mar-2013

125

Condominium

Apr-2013

131

125

YoY
Change

Feb-2013

131

Single-Family

79

- 27.0%

63

- 28.9%

Total

66

- 31.7%

49

- 37.5%

Condominium

Historical Days on Market Until Sale

Single-Family

Condominium

150

130

110

90

70

50

30
Jan-2003

Jan-2004

Jan-2005

Jan-2006

Jan-2007

Jan-2008

Jan-2009

Jan-2010

Jan-2011

Jan-2012

Jan-2013

Jan-2014

All data from MLS Property Information Network, Inc. Provided by the Greater Boston Association of REALTORS® and the Massachusetts Association of REALTORS®. Powered by 10K Research and Marketing. | Click for Cover Page | 9
Percent of Original List Price Received
Percentage found when dividing a property’s sales price by its original list price, then taking the average for all properties sold in a given month,
not accounting for seller concessions.

January

Year to Date

96.7%

+ 3.5%

+ 2.3%

97.6%

+ 3.8%

Apr-2013

96.7%

+ 3.5%

98.8%

+ 3.2%

May-2013

97.8%

+ 2.6%

99.5%

+ 3.5%

98.4%

+ 3.3%

99.7%

+ 3.5%

98.1%

+ 2.4%

99.9%

+ 3.5%

97.9%

+ 3.3%

99.7%

+ 3.6%

Sep-2013

97.3%

+ 3.0%

99.0%

+ 2.6%

Oct-2013

97.2%

+ 3.0%

98.8%

+ 3.1%

Nov-2013

93.9% 95.6%

+ 3.2%

95.2%

Aug-2013

90.4%

94.1%

Jul-2013

93.9% 95.6%

YoY
Change

Jun-2013

90.4%

Condominium

Mar-2013
97.4%
93.0% 95.8%

YoY
Change

Feb-2013

97.4%
93.0% 95.8%

Single-Family

96.3%

+ 1.7%

98.9%

+ 2.8%

Dec-2013
2012

2013
+3.8%

2014
+1.9%

Single-Family

2012

2013

2014

+3.0%

+1.7%

Condominium

2012

2013

2014

+3.8%

+1.9%

Single-Family

95.9%

+ 1.7%

98.0%

+ 1.9%

2013

2014

Jan-2014

95.6%

+ 1.9%

97.4%

+ 1.7%

+3.0%

2012

+1.7%

Average

97.1%

+ 2.8%

99.0%

+ 3.1%

Condominium

Historical Percent of Original List Price Received

Single-Family

Condominium

101%

99%

97%

95%

93%

91%

89%
Jan-2003

Jan-2004

Jan-2005

Jan-2006

Jan-2007

Jan-2008

Jan-2009

Jan-2010

Jan-2011

Jan-2012

Jan-2013

Jan-2014

All data from MLS Property Information Network, Inc. Provided by the Greater Boston Association of REALTORS® and the Massachusetts Association of REALTORS®. Powered by 10K Research and Marketing. | Click for Cover Page | 10
Pending Sales
A count of the properties in UAG status between the first and last day in a given month, regardless of current status (based on Off Market Date).

January

Year to Date

YoY
Change

Single-Family

Condominium

YoY
Change

605

553

549

636

553

702

- 6.8%

712

- 4.3%

1,164

+ 1.9%

1,164

+ 9.3%

Apr-2013

656

622

Mar-2013

1,380

+ 12.4%

1,270

+ 9.2%

1,479

+ 15.7%

1,259

+ 6.9%

Jun-2013

549

636

Feb-2013

May-2013

605

656

622

1,285

+ 9.5%

1,091

+ 10.1%

Jul-2013

979

+ 4.9%

953

+ 19.9%

Aug-2013

888

+ 15.2%

760

+ 4.3%

Sep-2013

836

- 1.9%

787

+ 7.5%

Oct-2013

946

+ 8.9%

816

+ 3.3%

Nov-2013

705

+ 3.7%

641

+ 7.9%

Dec-2013
2012

2013

2014

+2.8%

-11.7%

Single-Family

2012

2013

2014

+18.6%

-3.0%

Condominium

2012

2013

2014

+2.8%

-11.7%

Single-Family

2012

2013
+18.6%

-3.0%

483

- 3.6%

427

- 7.0%

Jan-2014

2014

549

- 11.7%

636

- 3.0%

11,396

+ 5.5%

10,516

+ 6.3%

Total

Condominium

Historical Pending Sales Activity

Single-Family

Condominium

2,200
2,000
1,800
1,600
1,400
1,200
1,000
800
600
400
200
Jan-2003

Jan-2004

Jan-2005

Jan-2006

Jan-2007

Jan-2008

Jan-2009

Jan-2010

Jan-2011

Jan-2012

Jan-2013

Jan-2014

All data from MLS Property Information Network, Inc. Provided by the Greater Boston Association of REALTORS® and the Massachusetts Association of REALTORS®. Powered by 10K Research and Marketing. | Click for Cover Page | 11
New Listings
A count of the properties that have been newly listed on the market in a given month.

January

Year to Date

870

926

923

902

870

984

Mar-2013

902

YoY
Change

Feb-2013

926

923

Single-Family

Condominium

YoY
Change

1,343

- 22.4%

950

- 14.6%

- 30.6%

1,342

- 21.1%

Apr-2013

738

733

1,994

+ 14.6%

1,661

+ 13.5%

May-2013

1,981

+ 14.4%

1,531

+ 12.6%

Jun-2013

738

733

1,505

+ 15.1%

1,223

+ 7.9%

Jul-2013

-5.7%

-15.7%

Single-Family

2013

2014

-2.6%

-18.2%

Condominium

2012

2013

2014

-5.7%

-15.7%

Single-Family

2012

2014

-2.6%

-18.2%

1,456

+ 6.4%

1,253

+ 11.0%

1,216

+ 18.4%

1,010

+ 17.3%

651

+ 4.5%

554

+ 0.4%

393

+ 12.3%

363

+ 18.2%

Jan-2014

2013

+ 11.6%

Dec-2013
2012

+ 12.3%

866

Oct-2013

2014

993

+ 6.1%

Nov-2013

2013

+ 12.4%

1,031

Sep-2013

2012

1,116

Aug-2013

733

- 15.7%

738

- 18.2%

14,403

+ 1.5%

12,484

+ 2.5%

Total

Condominium

Historical New Listing Activity

Single-Family

Condominium

2,750
2,500
2,250
2,000
1,750
1,500
1,250
1,000
750
500
250
0
Jan-2003

Jan-2004

Jan-2005

Jan-2006

Jan-2007

Jan-2008

Jan-2009

Jan-2010

Jan-2011

Jan-2012

Jan-2013

Jan-2014

All data from MLS Property Information Network, Inc. Provided by the Greater Boston Association of REALTORS® and the Massachusetts Association of REALTORS®. Powered by 10K Research and Marketing. | Click for Cover Page | 12
City of Boston – Market Overview
Key market metrics for the current month and year-to-date figures for the City of Boston.

Key Metrics

Historical Sparklines

Jan-2013 Jan-2014

Closed Sales

+/–

YTD 2013 YTD 2014

+/–

271

1-2013
1 2013

1-2012

1-2013

1-2012

1-2013

1-2012

1-2013

1-2012

1-2013

1-2012

1-2013

- 23.1%

--

--

--

2.0

- 26.9%

--

--

--

60

- 21.2%

77

60

- 21.2%

97.5%

+ 1.3%

96.3%

97.5%

+ 1.3%

334

+ 0.6%

332

334

+ 0.6%

392

- 17.3%

474

392

- 17.3%

1-2014

New Listings
1-2011

571

1-2014

Pending Sales
1-2011

- 22.4%

1-2014

Percent of Original
List Price Received
1-2011

97

1-2014

Days on Market Until Sale
1-2011

125

1-2014
1 2014

Months Supply of Inventory
1-2011

- 22.4%

474

1-2012
1 2012

97

1-2014

Inventory of Homes for Sale
1-2011
1 2011

+ 12.0%

332

1-2013

$465,000

96.3%

1-2012

$415,000

1-2014

Housing Affordability Index
1-2011

+ 12.0%

77

1-2013

$465,000

2.7

1-2012

+ 5.2%

1-2014

Median Sales Price
1-2011

285

743

1-2013

271

125

1-2012

+ 5.2%

$415,000

1-2011

285

1-2014

All data from MLS Property Information Network, Inc. Provided by the Greater Boston Association of REALTORS® and the Massachusetts Association of REALTORS®. Powered by 10K Research and Marketing. | Click for Cover Page | 13

Contenu connexe

Tendances

San Francisco Real Estate Housing Market December 2016
San Francisco Real Estate Housing Market December 2016San Francisco Real Estate Housing Market December 2016
San Francisco Real Estate Housing Market December 2016Ronny Budiutama
 
San Francisco Market Focus January 2016
San Francisco Market Focus January 2016San Francisco Market Focus January 2016
San Francisco Market Focus January 2016Ronny Budiutama
 
SRA Market Update - April 2020
SRA Market Update - April 2020SRA Market Update - April 2020
SRA Market Update - April 2020NoelGeremia
 
January 2018 San Francisco Market Update
January 2018 San Francisco Market UpdateJanuary 2018 San Francisco Market Update
January 2018 San Francisco Market UpdateRonny Budiutama
 
San Francisco Market Focus September 2014
San Francisco Market Focus September 2014San Francisco Market Focus September 2014
San Francisco Market Focus September 2014Ronny Budiutama
 
San Francisco Market Focus February 2018
San Francisco Market Focus February 2018San Francisco Market Focus February 2018
San Francisco Market Focus February 2018Ronny Budiutama
 
San Francisco Market Focus July 2014
San Francisco Market Focus July 2014San Francisco Market Focus July 2014
San Francisco Market Focus July 2014Ronny Budiutama
 
San Francisco Real Estate Housing Market January 2017
San Francisco Real Estate Housing Market January 2017San Francisco Real Estate Housing Market January 2017
San Francisco Real Estate Housing Market January 2017Ronny Budiutama
 
Greater Boston Association of Realtors January 2017 Monthly Indicators Report
Greater Boston Association of Realtors January 2017 Monthly Indicators ReportGreater Boston Association of Realtors January 2017 Monthly Indicators Report
Greater Boston Association of Realtors January 2017 Monthly Indicators ReportJoe Schutt
 
December 2016 Greater Boston Real Estate Market Trends
December 2016 Greater Boston Real Estate Market TrendsDecember 2016 Greater Boston Real Estate Market Trends
December 2016 Greater Boston Real Estate Market TrendsJoe Schutt
 
San Francisco Market Focus February 2015
San Francisco Market Focus February 2015San Francisco Market Focus February 2015
San Francisco Market Focus February 2015Ronny Budiutama
 
Building Products and Materials Industry Insights - Q3 2015
Building Products and Materials Industry Insights - Q3 2015Building Products and Materials Industry Insights - Q3 2015
Building Products and Materials Industry Insights - Q3 2015Duff & Phelps
 
Building Products and Materials Industry Insights - Q1 2016
Building Products and Materials Industry Insights - Q1 2016Building Products and Materials Industry Insights - Q1 2016
Building Products and Materials Industry Insights - Q1 2016Duff & Phelps
 
Market Report: MSA Market Detail - Single Family - 3rd Quarter 2017
Market Report: MSA Market Detail - Single Family - 3rd Quarter 2017Market Report: MSA Market Detail - Single Family - 3rd Quarter 2017
Market Report: MSA Market Detail - Single Family - 3rd Quarter 2017Al Graham
 
San Francisco Market Report November 2021
San Francisco Market Report November 2021San Francisco Market Report November 2021
San Francisco Market Report November 2021Ronny Budiutama
 
Building Products and Materials Industry Insights - Q3 2016
Building Products and Materials Industry Insights - Q3 2016Building Products and Materials Industry Insights - Q3 2016
Building Products and Materials Industry Insights - Q3 2016Duff & Phelps
 
San Francisco Market Report October 2021
San Francisco Market Report October 2021San Francisco Market Report October 2021
San Francisco Market Report October 2021Ronny Budiutama
 
San Francisco Market Focus March 2017
San Francisco Market Focus March 2017San Francisco Market Focus March 2017
San Francisco Market Focus March 2017Ronny Budiutama
 

Tendances (20)

San Francisco Real Estate Housing Market December 2016
San Francisco Real Estate Housing Market December 2016San Francisco Real Estate Housing Market December 2016
San Francisco Real Estate Housing Market December 2016
 
San Francisco Market Focus January 2016
San Francisco Market Focus January 2016San Francisco Market Focus January 2016
San Francisco Market Focus January 2016
 
SRA Market Update - April 2020
SRA Market Update - April 2020SRA Market Update - April 2020
SRA Market Update - April 2020
 
January 2018 San Francisco Market Update
January 2018 San Francisco Market UpdateJanuary 2018 San Francisco Market Update
January 2018 San Francisco Market Update
 
San Francisco Market Focus September 2014
San Francisco Market Focus September 2014San Francisco Market Focus September 2014
San Francisco Market Focus September 2014
 
San Francisco Market Focus February 2018
San Francisco Market Focus February 2018San Francisco Market Focus February 2018
San Francisco Market Focus February 2018
 
San Francisco Market Focus July 2014
San Francisco Market Focus July 2014San Francisco Market Focus July 2014
San Francisco Market Focus July 2014
 
San Francisco Real Estate Housing Market January 2017
San Francisco Real Estate Housing Market January 2017San Francisco Real Estate Housing Market January 2017
San Francisco Real Estate Housing Market January 2017
 
Greater Boston Association of Realtors January 2017 Monthly Indicators Report
Greater Boston Association of Realtors January 2017 Monthly Indicators ReportGreater Boston Association of Realtors January 2017 Monthly Indicators Report
Greater Boston Association of Realtors January 2017 Monthly Indicators Report
 
December 2016 Greater Boston Real Estate Market Trends
December 2016 Greater Boston Real Estate Market TrendsDecember 2016 Greater Boston Real Estate Market Trends
December 2016 Greater Boston Real Estate Market Trends
 
San Francisco Market Focus February 2015
San Francisco Market Focus February 2015San Francisco Market Focus February 2015
San Francisco Market Focus February 2015
 
Building Products and Materials Industry Insights - Q3 2015
Building Products and Materials Industry Insights - Q3 2015Building Products and Materials Industry Insights - Q3 2015
Building Products and Materials Industry Insights - Q3 2015
 
Building Products and Materials Industry Insights - Q1 2016
Building Products and Materials Industry Insights - Q1 2016Building Products and Materials Industry Insights - Q1 2016
Building Products and Materials Industry Insights - Q1 2016
 
Market Report: MSA Market Detail - Single Family - 3rd Quarter 2017
Market Report: MSA Market Detail - Single Family - 3rd Quarter 2017Market Report: MSA Market Detail - Single Family - 3rd Quarter 2017
Market Report: MSA Market Detail - Single Family - 3rd Quarter 2017
 
San Francisco Market Report November 2021
San Francisco Market Report November 2021San Francisco Market Report November 2021
San Francisco Market Report November 2021
 
Building Products and Materials Industry Insights - Q3 2016
Building Products and Materials Industry Insights - Q3 2016Building Products and Materials Industry Insights - Q3 2016
Building Products and Materials Industry Insights - Q3 2016
 
October 2014 Denver Metro Real Estate Report
October 2014 Denver Metro Real Estate ReportOctober 2014 Denver Metro Real Estate Report
October 2014 Denver Metro Real Estate Report
 
San Francisco Market Report October 2021
San Francisco Market Report October 2021San Francisco Market Report October 2021
San Francisco Market Report October 2021
 
San Francisco Market Focus March 2017
San Francisco Market Focus March 2017San Francisco Market Focus March 2017
San Francisco Market Focus March 2017
 
March 2020 Market Data
March 2020 Market DataMarch 2020 Market Data
March 2020 Market Data
 

Similaire à January 2014 Greater Boston Real Estate Market Trends Report

January 2015 Greater Boston Real Estate Market Trends Report
January 2015 Greater Boston Real Estate Market Trends ReportJanuary 2015 Greater Boston Real Estate Market Trends Report
January 2015 Greater Boston Real Estate Market Trends ReportUnit Realty Group
 
June 2013's Monthly Indicators report - Boston Real Estate Market Trends
June 2013's Monthly Indicators report - Boston Real Estate Market TrendsJune 2013's Monthly Indicators report - Boston Real Estate Market Trends
June 2013's Monthly Indicators report - Boston Real Estate Market TrendsUnit Realty Group
 
April 2013's Monthly Indicators report - Boston Real Estate Market Trends
April 2013's Monthly Indicators report - Boston Real Estate Market TrendsApril 2013's Monthly Indicators report - Boston Real Estate Market Trends
April 2013's Monthly Indicators report - Boston Real Estate Market TrendsUnit Realty Group
 
July 2013's Monthly Indicators report - Boston Real Estate Market Trends
July 2013's Monthly Indicators report - Boston Real Estate Market TrendsJuly 2013's Monthly Indicators report - Boston Real Estate Market Trends
July 2013's Monthly Indicators report - Boston Real Estate Market TrendsUnit Realty Group
 
August 2015 Greater Boston Real Estate Market Trends Report
August 2015 Greater Boston Real Estate Market Trends ReportAugust 2015 Greater Boston Real Estate Market Trends Report
August 2015 Greater Boston Real Estate Market Trends ReportUnit Realty Group
 
October 2014 Greater Boston Real Estate Market Trends Report
October 2014 Greater Boston Real Estate Market Trends ReportOctober 2014 Greater Boston Real Estate Market Trends Report
October 2014 Greater Boston Real Estate Market Trends ReportUnit Realty Group
 
The Georgia Association Of Realtors Monthly Indicators For April 2014
The Georgia Association Of Realtors Monthly Indicators For April 2014The Georgia Association Of Realtors Monthly Indicators For April 2014
The Georgia Association Of Realtors Monthly Indicators For April 2014Arthur Prescott
 
San Francisco Market Focus February 2014
San Francisco Market Focus February 2014San Francisco Market Focus February 2014
San Francisco Market Focus February 2014Ronny Budiutama
 
San Francisco Market Focus June 2014
San Francisco Market Focus June 2014San Francisco Market Focus June 2014
San Francisco Market Focus June 2014Ronny Budiutama
 
San Francisco Market Focus June 2013
San Francisco Market Focus June 2013San Francisco Market Focus June 2013
San Francisco Market Focus June 2013Ronny Budiutama
 
San Francisco Market Focus July 2015
San Francisco Market Focus July 2015San Francisco Market Focus July 2015
San Francisco Market Focus July 2015Ronny Budiutama
 
November 2014 Greater Boston Real Estate Market Trends Report
November 2014 Greater Boston Real Estate Market Trends ReportNovember 2014 Greater Boston Real Estate Market Trends Report
November 2014 Greater Boston Real Estate Market Trends ReportUnit Realty Group
 
December 2014 Greater Boston Real Estate Market Trends Report
December 2014 Greater Boston Real Estate Market Trends ReportDecember 2014 Greater Boston Real Estate Market Trends Report
December 2014 Greater Boston Real Estate Market Trends ReportUnit Realty Group
 
San Francisco Market Focus Report December 2018
San Francisco Market Focus Report December 2018San Francisco Market Focus Report December 2018
San Francisco Market Focus Report December 2018Ronny Budiutama
 
San Francisco Real Estate Market Report August 2014
San Francisco Real Estate Market Report August 2014San Francisco Real Estate Market Report August 2014
San Francisco Real Estate Market Report August 2014Ronny Budiutama
 
San Francisco Market Focus April 2015
San Francisco Market Focus April 2015San Francisco Market Focus April 2015
San Francisco Market Focus April 2015Ronny Budiutama
 
San Francisco Market Focus May 2013
San Francisco Market Focus May 2013San Francisco Market Focus May 2013
San Francisco Market Focus May 2013Ronny Budiutama
 
San Francisco Market Focus June 2017
San Francisco Market Focus June 2017San Francisco Market Focus June 2017
San Francisco Market Focus June 2017Ronny Budiutama
 
Apr13 abormarketreport
Apr13 abormarketreportApr13 abormarketreport
Apr13 abormarketreportaustinhometeam
 
San Francisco Market Data December 2014
San Francisco Market Data December 2014San Francisco Market Data December 2014
San Francisco Market Data December 2014Ronny Budiutama
 

Similaire à January 2014 Greater Boston Real Estate Market Trends Report (20)

January 2015 Greater Boston Real Estate Market Trends Report
January 2015 Greater Boston Real Estate Market Trends ReportJanuary 2015 Greater Boston Real Estate Market Trends Report
January 2015 Greater Boston Real Estate Market Trends Report
 
June 2013's Monthly Indicators report - Boston Real Estate Market Trends
June 2013's Monthly Indicators report - Boston Real Estate Market TrendsJune 2013's Monthly Indicators report - Boston Real Estate Market Trends
June 2013's Monthly Indicators report - Boston Real Estate Market Trends
 
April 2013's Monthly Indicators report - Boston Real Estate Market Trends
April 2013's Monthly Indicators report - Boston Real Estate Market TrendsApril 2013's Monthly Indicators report - Boston Real Estate Market Trends
April 2013's Monthly Indicators report - Boston Real Estate Market Trends
 
July 2013's Monthly Indicators report - Boston Real Estate Market Trends
July 2013's Monthly Indicators report - Boston Real Estate Market TrendsJuly 2013's Monthly Indicators report - Boston Real Estate Market Trends
July 2013's Monthly Indicators report - Boston Real Estate Market Trends
 
August 2015 Greater Boston Real Estate Market Trends Report
August 2015 Greater Boston Real Estate Market Trends ReportAugust 2015 Greater Boston Real Estate Market Trends Report
August 2015 Greater Boston Real Estate Market Trends Report
 
October 2014 Greater Boston Real Estate Market Trends Report
October 2014 Greater Boston Real Estate Market Trends ReportOctober 2014 Greater Boston Real Estate Market Trends Report
October 2014 Greater Boston Real Estate Market Trends Report
 
The Georgia Association Of Realtors Monthly Indicators For April 2014
The Georgia Association Of Realtors Monthly Indicators For April 2014The Georgia Association Of Realtors Monthly Indicators For April 2014
The Georgia Association Of Realtors Monthly Indicators For April 2014
 
San Francisco Market Focus February 2014
San Francisco Market Focus February 2014San Francisco Market Focus February 2014
San Francisco Market Focus February 2014
 
San Francisco Market Focus June 2014
San Francisco Market Focus June 2014San Francisco Market Focus June 2014
San Francisco Market Focus June 2014
 
San Francisco Market Focus June 2013
San Francisco Market Focus June 2013San Francisco Market Focus June 2013
San Francisco Market Focus June 2013
 
San Francisco Market Focus July 2015
San Francisco Market Focus July 2015San Francisco Market Focus July 2015
San Francisco Market Focus July 2015
 
November 2014 Greater Boston Real Estate Market Trends Report
November 2014 Greater Boston Real Estate Market Trends ReportNovember 2014 Greater Boston Real Estate Market Trends Report
November 2014 Greater Boston Real Estate Market Trends Report
 
December 2014 Greater Boston Real Estate Market Trends Report
December 2014 Greater Boston Real Estate Market Trends ReportDecember 2014 Greater Boston Real Estate Market Trends Report
December 2014 Greater Boston Real Estate Market Trends Report
 
San Francisco Market Focus Report December 2018
San Francisco Market Focus Report December 2018San Francisco Market Focus Report December 2018
San Francisco Market Focus Report December 2018
 
San Francisco Real Estate Market Report August 2014
San Francisco Real Estate Market Report August 2014San Francisco Real Estate Market Report August 2014
San Francisco Real Estate Market Report August 2014
 
San Francisco Market Focus April 2015
San Francisco Market Focus April 2015San Francisco Market Focus April 2015
San Francisco Market Focus April 2015
 
San Francisco Market Focus May 2013
San Francisco Market Focus May 2013San Francisco Market Focus May 2013
San Francisco Market Focus May 2013
 
San Francisco Market Focus June 2017
San Francisco Market Focus June 2017San Francisco Market Focus June 2017
San Francisco Market Focus June 2017
 
Apr13 abormarketreport
Apr13 abormarketreportApr13 abormarketreport
Apr13 abormarketreport
 
San Francisco Market Data December 2014
San Francisco Market Data December 2014San Francisco Market Data December 2014
San Francisco Market Data December 2014
 

Plus de Unit Realty Group

December 2015 multi family housing activity report – boston, ma real estate
December 2015 multi family housing activity report – boston, ma real estateDecember 2015 multi family housing activity report – boston, ma real estate
December 2015 multi family housing activity report – boston, ma real estateUnit Realty Group
 
October 2015 Greater Boston Real Estate Market Trends Report
October 2015 Greater Boston Real Estate Market Trends ReportOctober 2015 Greater Boston Real Estate Market Trends Report
October 2015 Greater Boston Real Estate Market Trends ReportUnit Realty Group
 
September 2015 Greater Boston Real Estate Market Trends Report
September 2015 Greater Boston Real Estate Market Trends ReportSeptember 2015 Greater Boston Real Estate Market Trends Report
September 2015 Greater Boston Real Estate Market Trends ReportUnit Realty Group
 
January 2015′s Monthly Multi-family Housing Activity Report
January 2015′s Monthly Multi-family Housing Activity ReportJanuary 2015′s Monthly Multi-family Housing Activity Report
January 2015′s Monthly Multi-family Housing Activity ReportUnit Realty Group
 
November 2014 Multi-family Housing Activity Report – Boston, MA Real Estate
November 2014 Multi-family Housing Activity Report – Boston, MA Real EstateNovember 2014 Multi-family Housing Activity Report – Boston, MA Real Estate
November 2014 Multi-family Housing Activity Report – Boston, MA Real EstateUnit Realty Group
 
September 2014 Multi-family Housing Activity Report – Boston, MA Real Estate
September 2014 Multi-family Housing Activity Report – Boston, MA Real EstateSeptember 2014 Multi-family Housing Activity Report – Boston, MA Real Estate
September 2014 Multi-family Housing Activity Report – Boston, MA Real EstateUnit Realty Group
 
Boston By The Numbers - Boston Housing Stock (Report)
Boston By The Numbers - Boston Housing Stock (Report)Boston By The Numbers - Boston Housing Stock (Report)
Boston By The Numbers - Boston Housing Stock (Report)Unit Realty Group
 
May 2014 Multi-family Housing Activity Report – Boston, MA Real Estate
May 2014 Multi-family Housing Activity Report – Boston, MA Real EstateMay 2014 Multi-family Housing Activity Report – Boston, MA Real Estate
May 2014 Multi-family Housing Activity Report – Boston, MA Real EstateUnit Realty Group
 
November 2013 Multi-family Housing Activity Report – Boston, MA Real Estate
November 2013 Multi-family Housing Activity Report – Boston, MA Real EstateNovember 2013 Multi-family Housing Activity Report – Boston, MA Real Estate
November 2013 Multi-family Housing Activity Report – Boston, MA Real EstateUnit Realty Group
 
October 2013 Multi-family Housing Activity Report – Boston, MA Real Estate
October 2013 Multi-family Housing Activity Report – Boston, MA Real EstateOctober 2013 Multi-family Housing Activity Report – Boston, MA Real Estate
October 2013 Multi-family Housing Activity Report – Boston, MA Real EstateUnit Realty Group
 
September 2013 Multifamily Housing Activity Report – Boston, MA Real Estate
September 2013 Multifamily Housing Activity Report – Boston, MA Real EstateSeptember 2013 Multifamily Housing Activity Report – Boston, MA Real Estate
September 2013 Multifamily Housing Activity Report – Boston, MA Real EstateUnit Realty Group
 
August 2013 Multifamily Housing Activity Report – Boston, MA Real Estate
August 2013 Multifamily Housing Activity Report – Boston, MA Real EstateAugust 2013 Multifamily Housing Activity Report – Boston, MA Real Estate
August 2013 Multifamily Housing Activity Report – Boston, MA Real EstateUnit Realty Group
 
July 2013 Multifamily Housing Activity Report – Boston, MA Real Estate
July 2013 Multifamily Housing Activity Report – Boston, MA Real EstateJuly 2013 Multifamily Housing Activity Report – Boston, MA Real Estate
July 2013 Multifamily Housing Activity Report – Boston, MA Real EstateUnit Realty Group
 
June 2013 Multifamily Housing Activity Report – Boston, MA Real Estate
June 2013 Multifamily Housing Activity Report – Boston, MA Real EstateJune 2013 Multifamily Housing Activity Report – Boston, MA Real Estate
June 2013 Multifamily Housing Activity Report – Boston, MA Real EstateUnit Realty Group
 
May 2013's Monthly Indicators report - Boston Real Estate Market Trends
May 2013's Monthly Indicators report - Boston Real Estate Market Trends May 2013's Monthly Indicators report - Boston Real Estate Market Trends
May 2013's Monthly Indicators report - Boston Real Estate Market Trends Unit Realty Group
 
April 2013 Monthly Multi-family Housing Activity Report – Boston Real Estate
April 2013 Monthly Multi-family Housing Activity Report – Boston Real Estate April 2013 Monthly Multi-family Housing Activity Report – Boston Real Estate
April 2013 Monthly Multi-family Housing Activity Report – Boston Real Estate Unit Realty Group
 
March 2013 Monthly Multi-family Housing Activity Report - Boston Real Estate
March 2013 Monthly Multi-family Housing Activity Report - Boston Real Estate March 2013 Monthly Multi-family Housing Activity Report - Boston Real Estate
March 2013 Monthly Multi-family Housing Activity Report - Boston Real Estate Unit Realty Group
 
February 2013 Monthly Multi-family Housing Activity Report - Boston Real Estate
February 2013 Monthly Multi-family Housing Activity Report - Boston Real EstateFebruary 2013 Monthly Multi-family Housing Activity Report - Boston Real Estate
February 2013 Monthly Multi-family Housing Activity Report - Boston Real EstateUnit Realty Group
 
February 2013's Monthly Indicators report - Boston Real Estate Market Trends
February 2013's Monthly Indicators report - Boston Real Estate Market TrendsFebruary 2013's Monthly Indicators report - Boston Real Estate Market Trends
February 2013's Monthly Indicators report - Boston Real Estate Market TrendsUnit Realty Group
 
January 2013's Monthly Indicators report
January 2013's Monthly Indicators reportJanuary 2013's Monthly Indicators report
January 2013's Monthly Indicators reportUnit Realty Group
 

Plus de Unit Realty Group (20)

December 2015 multi family housing activity report – boston, ma real estate
December 2015 multi family housing activity report – boston, ma real estateDecember 2015 multi family housing activity report – boston, ma real estate
December 2015 multi family housing activity report – boston, ma real estate
 
October 2015 Greater Boston Real Estate Market Trends Report
October 2015 Greater Boston Real Estate Market Trends ReportOctober 2015 Greater Boston Real Estate Market Trends Report
October 2015 Greater Boston Real Estate Market Trends Report
 
September 2015 Greater Boston Real Estate Market Trends Report
September 2015 Greater Boston Real Estate Market Trends ReportSeptember 2015 Greater Boston Real Estate Market Trends Report
September 2015 Greater Boston Real Estate Market Trends Report
 
January 2015′s Monthly Multi-family Housing Activity Report
January 2015′s Monthly Multi-family Housing Activity ReportJanuary 2015′s Monthly Multi-family Housing Activity Report
January 2015′s Monthly Multi-family Housing Activity Report
 
November 2014 Multi-family Housing Activity Report – Boston, MA Real Estate
November 2014 Multi-family Housing Activity Report – Boston, MA Real EstateNovember 2014 Multi-family Housing Activity Report – Boston, MA Real Estate
November 2014 Multi-family Housing Activity Report – Boston, MA Real Estate
 
September 2014 Multi-family Housing Activity Report – Boston, MA Real Estate
September 2014 Multi-family Housing Activity Report – Boston, MA Real EstateSeptember 2014 Multi-family Housing Activity Report – Boston, MA Real Estate
September 2014 Multi-family Housing Activity Report – Boston, MA Real Estate
 
Boston By The Numbers - Boston Housing Stock (Report)
Boston By The Numbers - Boston Housing Stock (Report)Boston By The Numbers - Boston Housing Stock (Report)
Boston By The Numbers - Boston Housing Stock (Report)
 
May 2014 Multi-family Housing Activity Report – Boston, MA Real Estate
May 2014 Multi-family Housing Activity Report – Boston, MA Real EstateMay 2014 Multi-family Housing Activity Report – Boston, MA Real Estate
May 2014 Multi-family Housing Activity Report – Boston, MA Real Estate
 
November 2013 Multi-family Housing Activity Report – Boston, MA Real Estate
November 2013 Multi-family Housing Activity Report – Boston, MA Real EstateNovember 2013 Multi-family Housing Activity Report – Boston, MA Real Estate
November 2013 Multi-family Housing Activity Report – Boston, MA Real Estate
 
October 2013 Multi-family Housing Activity Report – Boston, MA Real Estate
October 2013 Multi-family Housing Activity Report – Boston, MA Real EstateOctober 2013 Multi-family Housing Activity Report – Boston, MA Real Estate
October 2013 Multi-family Housing Activity Report – Boston, MA Real Estate
 
September 2013 Multifamily Housing Activity Report – Boston, MA Real Estate
September 2013 Multifamily Housing Activity Report – Boston, MA Real EstateSeptember 2013 Multifamily Housing Activity Report – Boston, MA Real Estate
September 2013 Multifamily Housing Activity Report – Boston, MA Real Estate
 
August 2013 Multifamily Housing Activity Report – Boston, MA Real Estate
August 2013 Multifamily Housing Activity Report – Boston, MA Real EstateAugust 2013 Multifamily Housing Activity Report – Boston, MA Real Estate
August 2013 Multifamily Housing Activity Report – Boston, MA Real Estate
 
July 2013 Multifamily Housing Activity Report – Boston, MA Real Estate
July 2013 Multifamily Housing Activity Report – Boston, MA Real EstateJuly 2013 Multifamily Housing Activity Report – Boston, MA Real Estate
July 2013 Multifamily Housing Activity Report – Boston, MA Real Estate
 
June 2013 Multifamily Housing Activity Report – Boston, MA Real Estate
June 2013 Multifamily Housing Activity Report – Boston, MA Real EstateJune 2013 Multifamily Housing Activity Report – Boston, MA Real Estate
June 2013 Multifamily Housing Activity Report – Boston, MA Real Estate
 
May 2013's Monthly Indicators report - Boston Real Estate Market Trends
May 2013's Monthly Indicators report - Boston Real Estate Market Trends May 2013's Monthly Indicators report - Boston Real Estate Market Trends
May 2013's Monthly Indicators report - Boston Real Estate Market Trends
 
April 2013 Monthly Multi-family Housing Activity Report – Boston Real Estate
April 2013 Monthly Multi-family Housing Activity Report – Boston Real Estate April 2013 Monthly Multi-family Housing Activity Report – Boston Real Estate
April 2013 Monthly Multi-family Housing Activity Report – Boston Real Estate
 
March 2013 Monthly Multi-family Housing Activity Report - Boston Real Estate
March 2013 Monthly Multi-family Housing Activity Report - Boston Real Estate March 2013 Monthly Multi-family Housing Activity Report - Boston Real Estate
March 2013 Monthly Multi-family Housing Activity Report - Boston Real Estate
 
February 2013 Monthly Multi-family Housing Activity Report - Boston Real Estate
February 2013 Monthly Multi-family Housing Activity Report - Boston Real EstateFebruary 2013 Monthly Multi-family Housing Activity Report - Boston Real Estate
February 2013 Monthly Multi-family Housing Activity Report - Boston Real Estate
 
February 2013's Monthly Indicators report - Boston Real Estate Market Trends
February 2013's Monthly Indicators report - Boston Real Estate Market TrendsFebruary 2013's Monthly Indicators report - Boston Real Estate Market Trends
February 2013's Monthly Indicators report - Boston Real Estate Market Trends
 
January 2013's Monthly Indicators report
January 2013's Monthly Indicators reportJanuary 2013's Monthly Indicators report
January 2013's Monthly Indicators report
 

Dernier

BPTP THE AMAARIO Luxury Project Invest Like Royalty in Sector 37D Gurgaon Dwa...
BPTP THE AMAARIO Luxury Project Invest Like Royalty in Sector 37D Gurgaon Dwa...BPTP THE AMAARIO Luxury Project Invest Like Royalty in Sector 37D Gurgaon Dwa...
BPTP THE AMAARIO Luxury Project Invest Like Royalty in Sector 37D Gurgaon Dwa...ApartmentWala1
 
Cheap Rate ✨➥9711108085▻✨Call Girls In Malviya Nagar(Delhi)
Cheap Rate ✨➥9711108085▻✨Call Girls In Malviya Nagar(Delhi)Cheap Rate ✨➥9711108085▻✨Call Girls In Malviya Nagar(Delhi)
Cheap Rate ✨➥9711108085▻✨Call Girls In Malviya Nagar(Delhi)delhi24hrs1
 
Vanam At Purva Soukhyam Guduvanchery.pdf.pdf
Vanam At Purva Soukhyam Guduvanchery.pdf.pdfVanam At Purva Soukhyam Guduvanchery.pdf.pdf
Vanam At Purva Soukhyam Guduvanchery.pdf.pdfkratirudram
 
Mapusa Beach ( Call Girls ) Goa ✔ 8617370543 ✅ By Goa Call Girls For Pick Up ...
Mapusa Beach ( Call Girls ) Goa ✔ 8617370543 ✅ By Goa Call Girls For Pick Up ...Mapusa Beach ( Call Girls ) Goa ✔ 8617370543 ✅ By Goa Call Girls For Pick Up ...
Mapusa Beach ( Call Girls ) Goa ✔ 8617370543 ✅ By Goa Call Girls For Pick Up ...Nitya salvi
 
Parksville 96 Surrey Floor Plans May 2024
Parksville 96 Surrey Floor Plans May 2024Parksville 96 Surrey Floor Plans May 2024
Parksville 96 Surrey Floor Plans May 2024VickyAulakh1
 
Call Girls In Krishna Nagar Delhi (Escort)↫8447779280↬@SHOT 1500- NIGHT 5500→...
Call Girls In Krishna Nagar Delhi (Escort)↫8447779280↬@SHOT 1500- NIGHT 5500→...Call Girls In Krishna Nagar Delhi (Escort)↫8447779280↬@SHOT 1500- NIGHT 5500→...
Call Girls In Krishna Nagar Delhi (Escort)↫8447779280↬@SHOT 1500- NIGHT 5500→...asmaqueen5
 
2k Shot Call girls Karol Bagh Delhi 9205541914
2k Shot Call girls Karol Bagh Delhi 92055419142k Shot Call girls Karol Bagh Delhi 9205541914
2k Shot Call girls Karol Bagh Delhi 9205541914Delhi Call girls
 
Cheap Rate ✨➥9711108085▻✨Call Girls In Amar Colony (Delhi)
Cheap Rate ✨➥9711108085▻✨Call Girls In Amar Colony (Delhi)Cheap Rate ✨➥9711108085▻✨Call Girls In Amar Colony (Delhi)
Cheap Rate ✨➥9711108085▻✨Call Girls In Amar Colony (Delhi)delhi24hrs1
 
Call Girls In Seelampur Delhi ↬8447779280}Seelampur Escorts Service In Delhi...
Call Girls In Seelampur  Delhi ↬8447779280}Seelampur Escorts Service In Delhi...Call Girls In Seelampur  Delhi ↬8447779280}Seelampur Escorts Service In Delhi...
Call Girls In Seelampur Delhi ↬8447779280}Seelampur Escorts Service In Delhi...asmaqueen5
 
Eldeco Dwarka Project In Delhi-brochure.pdf.pdf
Eldeco Dwarka Project In Delhi-brochure.pdf.pdfEldeco Dwarka Project In Delhi-brochure.pdf.pdf
Eldeco Dwarka Project In Delhi-brochure.pdf.pdfkratirudram
 
Mahindra Happinest Tathawade Pune Brochure.pdf
Mahindra Happinest Tathawade Pune Brochure.pdfMahindra Happinest Tathawade Pune Brochure.pdf
Mahindra Happinest Tathawade Pune Brochure.pdfBabyrudram
 
2k Shots ≽ 9205541914 ≼ Call Girls In Sainik Farm (Delhi)
2k Shots ≽ 9205541914 ≼ Call Girls In Sainik Farm (Delhi)2k Shots ≽ 9205541914 ≼ Call Girls In Sainik Farm (Delhi)
2k Shots ≽ 9205541914 ≼ Call Girls In Sainik Farm (Delhi)Delhi Call girls
 
David Litt Foreclosure Specialist - Your Partner in Real Estate Success
David Litt Foreclosure Specialist - Your Partner in Real Estate SuccessDavid Litt Foreclosure Specialist - Your Partner in Real Estate Success
David Litt Foreclosure Specialist - Your Partner in Real Estate SuccessDavid Litt
 
9990771857 Call Girls Dwarka Sector 9 Delhi (Call Girls ) Delhi
9990771857 Call Girls Dwarka Sector 9 Delhi (Call Girls ) Delhi9990771857 Call Girls Dwarka Sector 9 Delhi (Call Girls ) Delhi
9990771857 Call Girls Dwarka Sector 9 Delhi (Call Girls ) Delhidelhimodel235
 
Nyati Elite NIBM Road Pune E Brochure.pdf
Nyati Elite NIBM Road Pune E Brochure.pdfNyati Elite NIBM Road Pune E Brochure.pdf
Nyati Elite NIBM Road Pune E Brochure.pdfabbu831446
 
9990771857 Call Girls in Dwarka Sector 6 Delhi (Call Girls) Delhi
9990771857 Call Girls in Dwarka Sector 6 Delhi (Call Girls) Delhi9990771857 Call Girls in Dwarka Sector 6 Delhi (Call Girls) Delhi
9990771857 Call Girls in Dwarka Sector 6 Delhi (Call Girls) Delhidelhimodel235
 
Kohinoor Teiko Hinjewadi Phase 2 Pune E-Brochure.pdf
Kohinoor Teiko Hinjewadi Phase 2 Pune  E-Brochure.pdfKohinoor Teiko Hinjewadi Phase 2 Pune  E-Brochure.pdf
Kohinoor Teiko Hinjewadi Phase 2 Pune E-Brochure.pdfManishSaxena95
 
Purva Soukhyam in Guduvancheri Chennai.pdf
Purva Soukhyam in Guduvancheri Chennai.pdfPurva Soukhyam in Guduvancheri Chennai.pdf
Purva Soukhyam in Guduvancheri Chennai.pdfpritika141199
 
Shapoorji Pallonji Joyville Vista Pune | Spend Your Family Time Together
Shapoorji Pallonji Joyville Vista Pune | Spend Your Family Time TogetherShapoorji Pallonji Joyville Vista Pune | Spend Your Family Time Together
Shapoorji Pallonji Joyville Vista Pune | Spend Your Family Time Togetheraidasheikh47
 
Rohan Harita Tathawade Pune Brochure.pdf
Rohan Harita Tathawade Pune Brochure.pdfRohan Harita Tathawade Pune Brochure.pdf
Rohan Harita Tathawade Pune Brochure.pdfabbu831446
 

Dernier (20)

BPTP THE AMAARIO Luxury Project Invest Like Royalty in Sector 37D Gurgaon Dwa...
BPTP THE AMAARIO Luxury Project Invest Like Royalty in Sector 37D Gurgaon Dwa...BPTP THE AMAARIO Luxury Project Invest Like Royalty in Sector 37D Gurgaon Dwa...
BPTP THE AMAARIO Luxury Project Invest Like Royalty in Sector 37D Gurgaon Dwa...
 
Cheap Rate ✨➥9711108085▻✨Call Girls In Malviya Nagar(Delhi)
Cheap Rate ✨➥9711108085▻✨Call Girls In Malviya Nagar(Delhi)Cheap Rate ✨➥9711108085▻✨Call Girls In Malviya Nagar(Delhi)
Cheap Rate ✨➥9711108085▻✨Call Girls In Malviya Nagar(Delhi)
 
Vanam At Purva Soukhyam Guduvanchery.pdf.pdf
Vanam At Purva Soukhyam Guduvanchery.pdf.pdfVanam At Purva Soukhyam Guduvanchery.pdf.pdf
Vanam At Purva Soukhyam Guduvanchery.pdf.pdf
 
Mapusa Beach ( Call Girls ) Goa ✔ 8617370543 ✅ By Goa Call Girls For Pick Up ...
Mapusa Beach ( Call Girls ) Goa ✔ 8617370543 ✅ By Goa Call Girls For Pick Up ...Mapusa Beach ( Call Girls ) Goa ✔ 8617370543 ✅ By Goa Call Girls For Pick Up ...
Mapusa Beach ( Call Girls ) Goa ✔ 8617370543 ✅ By Goa Call Girls For Pick Up ...
 
Parksville 96 Surrey Floor Plans May 2024
Parksville 96 Surrey Floor Plans May 2024Parksville 96 Surrey Floor Plans May 2024
Parksville 96 Surrey Floor Plans May 2024
 
Call Girls In Krishna Nagar Delhi (Escort)↫8447779280↬@SHOT 1500- NIGHT 5500→...
Call Girls In Krishna Nagar Delhi (Escort)↫8447779280↬@SHOT 1500- NIGHT 5500→...Call Girls In Krishna Nagar Delhi (Escort)↫8447779280↬@SHOT 1500- NIGHT 5500→...
Call Girls In Krishna Nagar Delhi (Escort)↫8447779280↬@SHOT 1500- NIGHT 5500→...
 
2k Shot Call girls Karol Bagh Delhi 9205541914
2k Shot Call girls Karol Bagh Delhi 92055419142k Shot Call girls Karol Bagh Delhi 9205541914
2k Shot Call girls Karol Bagh Delhi 9205541914
 
Cheap Rate ✨➥9711108085▻✨Call Girls In Amar Colony (Delhi)
Cheap Rate ✨➥9711108085▻✨Call Girls In Amar Colony (Delhi)Cheap Rate ✨➥9711108085▻✨Call Girls In Amar Colony (Delhi)
Cheap Rate ✨➥9711108085▻✨Call Girls In Amar Colony (Delhi)
 
Call Girls In Seelampur Delhi ↬8447779280}Seelampur Escorts Service In Delhi...
Call Girls In Seelampur  Delhi ↬8447779280}Seelampur Escorts Service In Delhi...Call Girls In Seelampur  Delhi ↬8447779280}Seelampur Escorts Service In Delhi...
Call Girls In Seelampur Delhi ↬8447779280}Seelampur Escorts Service In Delhi...
 
Eldeco Dwarka Project In Delhi-brochure.pdf.pdf
Eldeco Dwarka Project In Delhi-brochure.pdf.pdfEldeco Dwarka Project In Delhi-brochure.pdf.pdf
Eldeco Dwarka Project In Delhi-brochure.pdf.pdf
 
Mahindra Happinest Tathawade Pune Brochure.pdf
Mahindra Happinest Tathawade Pune Brochure.pdfMahindra Happinest Tathawade Pune Brochure.pdf
Mahindra Happinest Tathawade Pune Brochure.pdf
 
2k Shots ≽ 9205541914 ≼ Call Girls In Sainik Farm (Delhi)
2k Shots ≽ 9205541914 ≼ Call Girls In Sainik Farm (Delhi)2k Shots ≽ 9205541914 ≼ Call Girls In Sainik Farm (Delhi)
2k Shots ≽ 9205541914 ≼ Call Girls In Sainik Farm (Delhi)
 
David Litt Foreclosure Specialist - Your Partner in Real Estate Success
David Litt Foreclosure Specialist - Your Partner in Real Estate SuccessDavid Litt Foreclosure Specialist - Your Partner in Real Estate Success
David Litt Foreclosure Specialist - Your Partner in Real Estate Success
 
9990771857 Call Girls Dwarka Sector 9 Delhi (Call Girls ) Delhi
9990771857 Call Girls Dwarka Sector 9 Delhi (Call Girls ) Delhi9990771857 Call Girls Dwarka Sector 9 Delhi (Call Girls ) Delhi
9990771857 Call Girls Dwarka Sector 9 Delhi (Call Girls ) Delhi
 
Nyati Elite NIBM Road Pune E Brochure.pdf
Nyati Elite NIBM Road Pune E Brochure.pdfNyati Elite NIBM Road Pune E Brochure.pdf
Nyati Elite NIBM Road Pune E Brochure.pdf
 
9990771857 Call Girls in Dwarka Sector 6 Delhi (Call Girls) Delhi
9990771857 Call Girls in Dwarka Sector 6 Delhi (Call Girls) Delhi9990771857 Call Girls in Dwarka Sector 6 Delhi (Call Girls) Delhi
9990771857 Call Girls in Dwarka Sector 6 Delhi (Call Girls) Delhi
 
Kohinoor Teiko Hinjewadi Phase 2 Pune E-Brochure.pdf
Kohinoor Teiko Hinjewadi Phase 2 Pune  E-Brochure.pdfKohinoor Teiko Hinjewadi Phase 2 Pune  E-Brochure.pdf
Kohinoor Teiko Hinjewadi Phase 2 Pune E-Brochure.pdf
 
Purva Soukhyam in Guduvancheri Chennai.pdf
Purva Soukhyam in Guduvancheri Chennai.pdfPurva Soukhyam in Guduvancheri Chennai.pdf
Purva Soukhyam in Guduvancheri Chennai.pdf
 
Shapoorji Pallonji Joyville Vista Pune | Spend Your Family Time Together
Shapoorji Pallonji Joyville Vista Pune | Spend Your Family Time TogetherShapoorji Pallonji Joyville Vista Pune | Spend Your Family Time Together
Shapoorji Pallonji Joyville Vista Pune | Spend Your Family Time Together
 
Rohan Harita Tathawade Pune Brochure.pdf
Rohan Harita Tathawade Pune Brochure.pdfRohan Harita Tathawade Pune Brochure.pdf
Rohan Harita Tathawade Pune Brochure.pdf
 

January 2014 Greater Boston Real Estate Market Trends Report

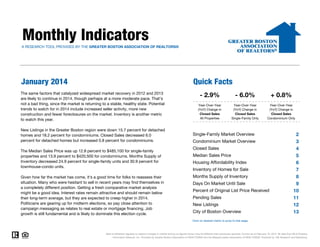
  • 1. Monthly Indicators A RESEARCH TOOL PROVIDED BY THE GREATER BOSTON ASSOCIATION OF REALTORS® January 2014 Quick Facts The same factors that catalyzed widespread market recovery in 2012 and 2013 are likely to continue in 2014, though perhaps at a more moderate pace. That's not a bad thing, since the market is returning to a stable, healthy state. Potential trends to watch for in 2014 include increased seller activity, more new construction and fewer foreclosures on the market. Inventory is another metric to watch this year. New Listings in the Greater Boston region were down 15.7 percent for detached homes and 18.2 percent for condominiums. Closed Sales decreased 6.0 percent for detached homes but increased 0.8 percent for condominiums. The Median Sales Price was up 12.8 percent to $485,100 for single-family properties and 13.9 percent to $420,500 for condominiums. Months Supply of Inventory decreased 24.9 percent for single-family units and 30.9 percent for townhouse-condo units. Given how far the market has come, it's a good time for folks to reassess their situation. Many who were hesitant to sell in recent years may find themselves in a completely different position. Getting a fresh comparative market analysis might be a good idea. Interest rates remain attractive and should remain below their long-term average, but they are expected to creep higher in 2014. Politicians are gearing up for midterm elections, so pay close attention to campaign messaging as relates to real estate or mortgage financing. Job growth is still fundamental and is likely to dominate this election cycle. - 2.9% - 6.0% + 0.8% Year-Over-Year (YoY) Change in Closed Sales All Properties Year-Over-Year (YoY) Change in Closed Sales Single-Family Only Year-Over-Year (YoY) Change in Closed Sales Condominium Only Single-Family Market Overview Condominium Market Overview Closed Sales Median Sales Price Housing Affordability Index Inventory of Homes for Sale Months Supply of Inventory Days On Market Until Sale Percent of Original List Price Received Pending Sales New Listings City of Boston Overview 2 3 4 5 6 7 8 9 10 11 12 13 Click on desired metric to jump to that page. Data is refreshed regularly to capture changes in market activity so figures shown may be different than previously reported. Current as of February 18, 2014. All data from MLS Property Information Network, Inc. Provided by Greater Boston Association of REALTORS® and the Massachusetts Association of REALTORS®. Powered by 10K Research and Marketing.
  • 2. Single-Family Market Overview Key market metrics for the current month and year-to-date figures for Single-Family Homes Only. Key Metrics Historical Sparklines Jan-2013 Jan-2014 Closed Sales +/– YTD 2013 YTD 2014 +/– 597 1-2013 1 2013 1-2012 1-2013 1-2012 1-2013 1-2012 1-2013 1-2012 1-2013 1-2012 1-2013 - 29.4% -- -- -- 2.9 - 24.9% -- -- -- 79 - 27.0% 108 79 - 27.0% 95.6% + 1.9% 93.9% 95.6% + 1.9% 549 - 11.7% 622 549 - 11.7% 733 - 15.7% 870 733 - 15.7% 1-2014 New Listings 1-2011 1,617 1-2014 Pending Sales 1-2011 - 22.4% 1-2014 Percent of Original List Price Received 1-2011 97 1-2014 Days on Market Until Sale 1-2011 125 1-2014 1 2014 Months Supply of Inventory 1-2011 - 22.4% 870 1-2012 1 2012 97 1-2014 Inventory of Homes for Sale 1-2011 1 2011 + 12.8% 622 1-2013 $485,100 93.9% 1-2012 $430,000 1-2014 Housing Affordability Index 1-2011 + 12.8% 108 1-2013 $485,100 3.8 1-2012 - 6.0% 1-2014 Median Sales Price 1-2011 561 2,291 1-2013 597 125 1-2012 - 6.0% $430,000 1-2011 561 1-2014 All data from MLS Property Information Network, Inc. Provided by the Greater Boston Association of REALTORS® and the Massachusetts Association of REALTORS®. Powered by 10K Research and Marketing. | Click for Cover Page | 2
  • 3. Condominium Market Overview Key market metrics for the current month and year-to-date figures for Condominium Properties Only. Key Metrics Historical Sparklines Jan-2013 Jan-2014 Closed Sales +/– YTD 2013 YTD 2014 +/– 514 1-2013 1 2013 1-2012 1-2013 1-2012 1-2013 1-2012 1-2013 1-2012 1-2013 1-2012 1-2013 - 30.4% -- -- -- 2.1 - 30.9% -- -- -- 63 - 28.9% 88 63 - 28.9% 97.4% + 1.7% 95.8% 97.4% + 1.7% 636 - 3.0% 656 636 - 3.0% 738 - 18.2% 902 738 - 18.2% 1-2014 New Listings 1-2011 1,101 1-2014 Pending Sales 1-2011 - 22.9% 1-2014 Percent of Original List Price Received 1-2011 110 1-2014 Days on Market Until Sale 1-2011 143 1-2014 1 2014 Months Supply of Inventory 1-2011 - 22.9% 902 1-2012 1 2012 110 1-2014 Inventory of Homes for Sale 1-2011 1 2011 + 13.9% 656 1-2013 $420,500 95.8% 1-2012 $369,250 1-2014 Housing Affordability Index 1-2011 + 13.9% 88 1-2013 $420,500 3.1 1-2012 + 0.8% 1-2014 Median Sales Price 1-2011 518 1,582 1-2013 514 143 1-2012 + 0.8% $369,250 1-2011 518 1-2014 All data from MLS Property Information Network, Inc. Provided by the Greater Boston Association of REALTORS® and the Massachusetts Association of REALTORS®. Powered by 10K Research and Marketing. | Click for Cover Page | 3
  • 4. Closed Sales A count of the actual sales that have closed in a given month. January Year to Date YoY Change Single-Family Condominium YoY Change Feb-2013 597 597 561 561 518 514 518 - 8.0% 435 + 13.3% 616 - 3.8% 628 + 3.6% Apr-2013 518 518 410 767 + 4.4% 805 + 6.5% May-2013 1,096 + 10.0% 1,068 + 6.4% Jun-2013 514 410 425 Mar-2013 1,480 - 1.1% 1,246 - 1.0% Jul-2013 +15.3% -6.0% Single-Family 2013 2014 +25.4% +0.8% Condominium 2012 2013 2014 +15.3% -6.0% Single-Family 2012 2013 +25.4% +0.8% 919 + 22.4% 888 + 18.9% 855 + 10.5% 764 + 7.5% 791 - 11.4% 710 - 6.0% 897 + 10.2% 788 + 2.9% Jan-2014 2014 + 6.1% Dec-2013 2012 + 20.7% 1,275 Nov-2013 2014 1,252 + 11.6% Oct-2013 2013 + 18.0% 1,428 Sep-2013 2012 1,488 Aug-2013 561 - 6.0% 518 + 0.8% 11,323 + 5.8% 10,377 + 6.5% Total Condominium Historical Closed Sales Activity Single-Family Condominium 1,800 1,600 1,400 1,200 1,000 800 600 400 200 Jan-2003 Jan-2004 Jan-2005 Jan-2006 Jan-2007 Jan-2008 Jan-2009 Jan-2010 Jan-2011 Jan-2012 Jan-2013 Jan-2014 All data from MLS Property Information Network, Inc. Provided by the Greater Boston Association of REALTORS® and the Massachusetts Association of REALTORS®. Powered by 10K Research and Marketing. | Click for Cover Page | 4
  • 5. Median Sales Price Median price point for all closed sales, not accounting for seller concessions, in a given month. January Year to Date $480,000 + 14.3% $387,500 + 4.3% May-2013 $500,000 + 7.2% $410,000 + 7.5% Jun-2013 $545,000 + 8.1% $420,000 + 5.0% $533,000 + 4.1% $400,500 + 3.5% $521,000 + 5.5% $416,000 + 9.5% $502,500 + 15.5% $410,000 + 9.3% $474,000 + 9.0% $416,750 + 13.8% Nov-2013 $369,250 + 19.1% Oct-2013 $355,000 - 5.4% $405,000 Sep-2013 $369,250 $350,000 + 3.6% Aug-2013 $355,000 $420,500 $406,500 + 8.3% $430,101 Jul-2013 $420,500 $406,500 $430,000 Apr-2013 $485,100 $430,000 Condominium Mar-2013 $430,000 YoY Change Feb-2013 $485,100 Single-Family YoY Change $480,000 + 6.7% $410,750 + 8.1% Dec-2013 2012 2013 2014 +5.8% +12.8% Single-Family 2012 2013 2014 +4.0% +13.9% Condominium 2012 2013 2014 +5.8% +12.8% Single-Family 2012 2013 +4.0% + 6.4% $420,400 + 10.5% $485,100 + 12.8% $420,500 + 13.9% Median +13.9% $499,950 Jan-2014 2014 $500,000 + 8.0% $409,000 + 7.6% Condominium Historical Median Sales Price Single-Family Condominium $550,000 $500,000 $450,000 $400,000 $350,000 $300,000 $250,000 Jan-2003 Jan-2004 Jan-2005 Jan-2006 Jan-2007 Jan-2008 Jan-2009 Jan-2010 Jan-2011 Jan-2012 Jan-2013 Jan-2014 All data from MLS Property Information Network, Inc. Provided by the Greater Boston Association of REALTORS® and the Massachusetts Association of REALTORS®. Powered by 10K Research and Marketing. | Click for Cover Page | 5
  • 6. Housing Affordability Index This index measures housing affordability for the region. An index of 120 means the median household income was 120% of what is necessary to qualify for the median-priced home under prevailing interest rates. A higher number means greater affordability. January Year to Date Single-Family 120 YoY Change Feb-2013 110 110 97 97 - 1.6% 146 + 11.2% 121 + 3.4% 128 - 8.8% 112 - 5.3% 136 + 2.9% May-2013 104 - 4.8% 124 - 4.9% Jun-2013 125 122 Mar-2013 143 135 125 Condominium Apr-2013 143 135 120 YoY Change 90 - 11.8% 114 - 9.2% Jul-2013 92 - 9.2% 120 - 8.5% Aug-2013 93 - 11.2% 115 - 13.9% Sep-2013 98 - 18.5% 118 - 14.0% Oct-2013 103 - 13.4% 116 - 16.6% Nov-2013 108 - 6.7% 125 - 7.7% Dec-2013 2012 2013 2014 +4.1% -22.4% Single-Family 2012 2013 2014 +5.6% 2012 -22.9% 2014 +4.1% Condominium 2013 99 - 11.8% 117 - 14.6% 2013 2014 Jan-2014 97 - 22.4% 110 - 22.9% +5.6% -22.4% Single-Family 2012 -22.9% Average 103 -9.4% 122 -8.9% Condominium Historical Housing Affordability Index Single-Family Condominium 160 150 140 130 120 110 100 90 80 70 60 Jan-2004 Jan-2005 Jan-2006 Jan-2007 Jan-2008 Jan-2009 Jan-2010 Jan-2011 Jan-2012 Jan-2013 Jan-2014 All data from MLS Property Information Network, Inc. Provided by the Greater Boston Association of REALTORS® and the Massachusetts Association of REALTORS®. Powered by 10K Research and Marketing. | Click for Cover Page | 6
  • 7. Inventory of Homes for Sale The number of properties available for sale in active status at the end of a given month. January Single-Family - 41.5% 1,731 - 47.0% 2,766 - 34.9% 1,973 - 40.2% 3,034 - 30.8% 2,068 - 35.1% 3,024 - 26.8% 2,022 - 31.9% Jul-2013 2,854 - 25.2% 1,854 - 32.3% Aug-2013 2,747 - 23.7% 1,731 - 28.6% Sep-2013 2,978 - 20.8% 1,940 - 23.3% Oct-2013 2,839 - 18.3% 1,860 - 19.9% Nov-2013 1,101 1,699 - 40.7% Jun-2013 1,582 - 32.5% 2,375 May-2013 1,617 2,399 Apr-2013 2,291 YoY Change Mar-2013 2,743 Condominium Feb-2013 3,294 YoY Change 2,342 - 21.5% 1,524 - 24.0% Dec-2013 2012 2013 2014 -30.4% Single-Family -29.4% 1,715 - 25.2% 1,174 - 22.9% 2013 2014 Jan-2014 1,617 - 29.4% 1,101 - 30.4% -42.3% Condominium 2012 -30.4% Average 2,558 - 27.9% 1,723 - 32.8% Historical Inventory of Homes for Sale Single-Family Condominium 9,000 8,000 7,000 6,000 5,000 4,000 3,000 2,000 1,000 Jan-2003 Jan-2004 Jan-2005 Jan-2006 Jan-2007 Jan-2008 Jan-2009 Jan-2010 Jan-2011 Jan-2012 Jan-2013 Jan-2014 All data from MLS Property Information Network, Inc. Provided by the Greater Boston Association of REALTORS® and the Massachusetts Association of REALTORS®. Powered by 10K Research and Marketing. | Click for Cover Page | 7
  • 8. Months Supply of Inventory The inventory of homes for sale at the end of a given month, divided by the average monthly pending sales from the last 12 months. January Single-Family - 48.4% 2.8 - 48.9% 3.6 - 37.6% 2.5 - 43.8% 2.8 - 37.1% 1.9 - 39.0% 2.0 - 26.0% 1.6 - 31.2% Jul-2013 1.9 - 36.6% 1.5 - 44.0% Aug-2013 1.9 - 31.6% 1.4 - 32.7% Sep-2013 3.2 - 35.3% 2.2 - 35.4% Oct-2013 3.3 - 26.0% 2.4 - 25.5% Nov-2013 2.1 3.9 - 38.4% Jun-2013 3.1 - 26.7% 3.9 May-2013 2.9 5.6 Mar-2013 3.8 YoY Change Apr-2013 6.4 Condominium Feb-2013 6.7 YoY Change 3.0 - 11.3% 2.1 - 19.1% Dec-2013 2012 2013 -39.7% Single-Family 2012 -24.9% 1.9 - 32.2% 1.5 - 25.1% 2013 2014 Jan-2014 2.9 - 24.9% 2.1 - 30.9% -54.0% Condominium 2014 -30.9% Average 2.8 - 35.7% 2.0 - 42.2% Historical Months Supply of Inventory Single-Family Condominium 16 14 12 10 8 6 4 2 0 Jan-2004 Jan-2005 Jan-2006 Jan-2007 Jan-2008 Jan-2009 Jan-2010 Jan-2011 Jan-2012 Jan-2013 Jan-2014 All data from MLS Property Information Network, Inc. Provided by the Greater Boston Association of REALTORS® and the Massachusetts Association of REALTORS®. Powered by 10K Research and Marketing. | Click for Cover Page | 8
  • 9. Days on Market Until Sale Average number of days between when a property is listed and when an offer is accepted in a given month. January Year to Date 2014 -17.2% -27.0% Single-Family 2012 2013 2014 -29.4% -28.9% Condominium 2012 2013 2014 -17.2% -27.0% Single-Family 2012 2014 -29.4% -28.9% - 35.1% 51 - 40.3% 56 - 37.9% 43 - 42.4% 47 - 41.6% 38 - 46.2% 48 - 45.1% 40 - 47.3% 57 - 36.1% 49 - 41.7% 59 - 33.7% 47 - 43.9% 65 - 27.2% 51 - 33.6% 70 - 28.0% 55 - 34.1% Jan-2014 2013 63 - 22.3% Dec-2013 2013 - 22.8% 75 Nov-2013 2012 93 Oct-2013 63 - 39.0% Sep-2013 63 - 22.6% 71 Aug-2013 88 79 95 - 17.4% Jul-2013 88 79 - 16.7% 107 Jun-2013 108 111 May-2013 108 YoY Change Mar-2013 125 Condominium Apr-2013 131 125 YoY Change Feb-2013 131 Single-Family 79 - 27.0% 63 - 28.9% Total 66 - 31.7% 49 - 37.5% Condominium Historical Days on Market Until Sale Single-Family Condominium 150 130 110 90 70 50 30 Jan-2003 Jan-2004 Jan-2005 Jan-2006 Jan-2007 Jan-2008 Jan-2009 Jan-2010 Jan-2011 Jan-2012 Jan-2013 Jan-2014 All data from MLS Property Information Network, Inc. Provided by the Greater Boston Association of REALTORS® and the Massachusetts Association of REALTORS®. Powered by 10K Research and Marketing. | Click for Cover Page | 9
  • 10. Percent of Original List Price Received Percentage found when dividing a property’s sales price by its original list price, then taking the average for all properties sold in a given month, not accounting for seller concessions. January Year to Date 96.7% + 3.5% + 2.3% 97.6% + 3.8% Apr-2013 96.7% + 3.5% 98.8% + 3.2% May-2013 97.8% + 2.6% 99.5% + 3.5% 98.4% + 3.3% 99.7% + 3.5% 98.1% + 2.4% 99.9% + 3.5% 97.9% + 3.3% 99.7% + 3.6% Sep-2013 97.3% + 3.0% 99.0% + 2.6% Oct-2013 97.2% + 3.0% 98.8% + 3.1% Nov-2013 93.9% 95.6% + 3.2% 95.2% Aug-2013 90.4% 94.1% Jul-2013 93.9% 95.6% YoY Change Jun-2013 90.4% Condominium Mar-2013 97.4% 93.0% 95.8% YoY Change Feb-2013 97.4% 93.0% 95.8% Single-Family 96.3% + 1.7% 98.9% + 2.8% Dec-2013 2012 2013 +3.8% 2014 +1.9% Single-Family 2012 2013 2014 +3.0% +1.7% Condominium 2012 2013 2014 +3.8% +1.9% Single-Family 95.9% + 1.7% 98.0% + 1.9% 2013 2014 Jan-2014 95.6% + 1.9% 97.4% + 1.7% +3.0% 2012 +1.7% Average 97.1% + 2.8% 99.0% + 3.1% Condominium Historical Percent of Original List Price Received Single-Family Condominium 101% 99% 97% 95% 93% 91% 89% Jan-2003 Jan-2004 Jan-2005 Jan-2006 Jan-2007 Jan-2008 Jan-2009 Jan-2010 Jan-2011 Jan-2012 Jan-2013 Jan-2014 All data from MLS Property Information Network, Inc. Provided by the Greater Boston Association of REALTORS® and the Massachusetts Association of REALTORS®. Powered by 10K Research and Marketing. | Click for Cover Page | 10
  • 11. Pending Sales A count of the properties in UAG status between the first and last day in a given month, regardless of current status (based on Off Market Date). January Year to Date YoY Change Single-Family Condominium YoY Change 605 553 549 636 553 702 - 6.8% 712 - 4.3% 1,164 + 1.9% 1,164 + 9.3% Apr-2013 656 622 Mar-2013 1,380 + 12.4% 1,270 + 9.2% 1,479 + 15.7% 1,259 + 6.9% Jun-2013 549 636 Feb-2013 May-2013 605 656 622 1,285 + 9.5% 1,091 + 10.1% Jul-2013 979 + 4.9% 953 + 19.9% Aug-2013 888 + 15.2% 760 + 4.3% Sep-2013 836 - 1.9% 787 + 7.5% Oct-2013 946 + 8.9% 816 + 3.3% Nov-2013 705 + 3.7% 641 + 7.9% Dec-2013 2012 2013 2014 +2.8% -11.7% Single-Family 2012 2013 2014 +18.6% -3.0% Condominium 2012 2013 2014 +2.8% -11.7% Single-Family 2012 2013 +18.6% -3.0% 483 - 3.6% 427 - 7.0% Jan-2014 2014 549 - 11.7% 636 - 3.0% 11,396 + 5.5% 10,516 + 6.3% Total Condominium Historical Pending Sales Activity Single-Family Condominium 2,200 2,000 1,800 1,600 1,400 1,200 1,000 800 600 400 200 Jan-2003 Jan-2004 Jan-2005 Jan-2006 Jan-2007 Jan-2008 Jan-2009 Jan-2010 Jan-2011 Jan-2012 Jan-2013 Jan-2014 All data from MLS Property Information Network, Inc. Provided by the Greater Boston Association of REALTORS® and the Massachusetts Association of REALTORS®. Powered by 10K Research and Marketing. | Click for Cover Page | 11
  • 12. New Listings A count of the properties that have been newly listed on the market in a given month. January Year to Date 870 926 923 902 870 984 Mar-2013 902 YoY Change Feb-2013 926 923 Single-Family Condominium YoY Change 1,343 - 22.4% 950 - 14.6% - 30.6% 1,342 - 21.1% Apr-2013 738 733 1,994 + 14.6% 1,661 + 13.5% May-2013 1,981 + 14.4% 1,531 + 12.6% Jun-2013 738 733 1,505 + 15.1% 1,223 + 7.9% Jul-2013 -5.7% -15.7% Single-Family 2013 2014 -2.6% -18.2% Condominium 2012 2013 2014 -5.7% -15.7% Single-Family 2012 2014 -2.6% -18.2% 1,456 + 6.4% 1,253 + 11.0% 1,216 + 18.4% 1,010 + 17.3% 651 + 4.5% 554 + 0.4% 393 + 12.3% 363 + 18.2% Jan-2014 2013 + 11.6% Dec-2013 2012 + 12.3% 866 Oct-2013 2014 993 + 6.1% Nov-2013 2013 + 12.4% 1,031 Sep-2013 2012 1,116 Aug-2013 733 - 15.7% 738 - 18.2% 14,403 + 1.5% 12,484 + 2.5% Total Condominium Historical New Listing Activity Single-Family Condominium 2,750 2,500 2,250 2,000 1,750 1,500 1,250 1,000 750 500 250 0 Jan-2003 Jan-2004 Jan-2005 Jan-2006 Jan-2007 Jan-2008 Jan-2009 Jan-2010 Jan-2011 Jan-2012 Jan-2013 Jan-2014 All data from MLS Property Information Network, Inc. Provided by the Greater Boston Association of REALTORS® and the Massachusetts Association of REALTORS®. Powered by 10K Research and Marketing. | Click for Cover Page | 12
  • 13. City of Boston – Market Overview Key market metrics for the current month and year-to-date figures for the City of Boston. Key Metrics Historical Sparklines Jan-2013 Jan-2014 Closed Sales +/– YTD 2013 YTD 2014 +/– 271 1-2013 1 2013 1-2012 1-2013 1-2012 1-2013 1-2012 1-2013 1-2012 1-2013 1-2012 1-2013 - 23.1% -- -- -- 2.0 - 26.9% -- -- -- 60 - 21.2% 77 60 - 21.2% 97.5% + 1.3% 96.3% 97.5% + 1.3% 334 + 0.6% 332 334 + 0.6% 392 - 17.3% 474 392 - 17.3% 1-2014 New Listings 1-2011 571 1-2014 Pending Sales 1-2011 - 22.4% 1-2014 Percent of Original List Price Received 1-2011 97 1-2014 Days on Market Until Sale 1-2011 125 1-2014 1 2014 Months Supply of Inventory 1-2011 - 22.4% 474 1-2012 1 2012 97 1-2014 Inventory of Homes for Sale 1-2011 1 2011 + 12.0% 332 1-2013 $465,000 96.3% 1-2012 $415,000 1-2014 Housing Affordability Index 1-2011 + 12.0% 77 1-2013 $465,000 2.7 1-2012 + 5.2% 1-2014 Median Sales Price 1-2011 285 743 1-2013 271 125 1-2012 + 5.2% $415,000 1-2011 285 1-2014 All data from MLS Property Information Network, Inc. Provided by the Greater Boston Association of REALTORS® and the Massachusetts Association of REALTORS®. Powered by 10K Research and Marketing. | Click for Cover Page | 13