SlideShare une entreprise Scribd logo
1  sur  24
Télécharger pour lire hors ligne
School Board Report                                                                                                                                           Toronto DSB (66052)


                                           School Board
                                              Report
                            Grade 9 Assessment of Mathematics, 2008–2009

 Board: Toronto DSB (66052)

I am pleased to provide you with this report on the
Grade 9 Assessment of Mathematics for 2008–2009.               WHERE TO FIND . . .                                                                                   PAGE
                                                                                                                                                         Applied         Academic
Included are student results for the current year, those       Percentages of all students at or above the provincial standard
from previous years and, to put these results in context,            ·  2008–2009......................................................................        1            1
information about the local student populations.                     ·  Over time........................................................................      2            2
                                                               Tips for using this report................................................................      3            3
Throughout the province and since the inception of the         Contextual information: 2008–2009...............................................                4            7
agency, EQAO results have helped inform professional           Results for groups of students: 2008–2009
practice and have served as a catalyst for improving                 ·    All students....................................................................     5            8
                                                                     ·    Participating students...................................................            5            8
student achievement. This report has been designed to                ·    Students by gender.......................................................            6            9
assist you in your conversations about improved student
                                                               Contextual information: Over time.................................................              10           12
learning.
                                                               Results for all students: Over time.................................................            11           13

We believe that every student deserves the best outcome        Results for all students: Over time by gender...............................                    14           15

from public education. That’s why, in close collaboration      Student questionnaire results.........................................................          16–19        20–23
with Ontario educators, EQAO continues to develop              Explanation of terms........................................................................    24           24
assessments that gauge the achievement of all Ontario
students against the learning expectations outlined in The
Ontario Curriculum. These assessments ensure that every
student in Ontario’s publicly funded school system is
assessed using the same yard stick at key stages in his or              PERCENTAGE OF ALL STUDENTS AT OR ABOVE THE
her schooling.                                                          PROVINCIAL STANDARD (LEVELS 3 AND 4), 2008–2009

However, it should be remembered that EQAO’s
assessment results are just one piece of information about
student achievement. These results should be considered
in conjunction with school-based information, such as that                     APPLIED COURSE                                                ACADEMIC COURSE
from classroom assessments.

I trust this report will help parents, educators and all who
support a strong public education system work together so
that all students can reach their full potential.
                                                                                                                                                     75         77
Sincerely,

                                                                                                38
                                                                                    23

Marguerite Jackson
                                                                                   Board      Province                                             Board      Province
Chief Executive Officer
Education Quality and Accountability Office


September 17, 2009                                                                                                                                                               1 of 24
School Board Report                                                                                                                          Toronto DSB (66052)

 Grade 9 Assessment of Mathematics, 2008–2009

    PERCENTAGE OF ALL STUDENTS AT OR ABOVE THE PROVINCIAL STANDARD (LEVELS 3 AND 4) OVER TIME


                                                                 APPLIED MATHEMATICS*


                                                     Board                                             Province


                                                                                                       35 35 34 38
                                                         23                                      27
                                             15 20 17 19


         2004–2005                        2005–2006                       2006–2007                          2007–2008                         2008–2009


                                                                    Total Number of Students
                                            2004–2005                2005–2006               2006–2007                2007–2008                2008–2009

                Board                             6 334                    6 551                   6 228                    5 894                    6 356
                Province                         51 155                  50 687                   49 056                   47 817                  48 482


  * Note that significant revisions were made to applied courses in 2005 as reflected in The Ontario Curriculum, Grades 9 and 10: Mathematics (revised 2005).


                                                                ACADEMIC MATHEMATICS


                                                     Board                                             Province


                                                              72 75                                       75 77
                                             65 65 66                                            68 71 71


         2004–2005                        2005–2006                       2006–2007                          2007–2008                         2008–2009


                                                                    Total Number of Students
                                            2004–2005                2005–2006               2006–2007                2007–2008                2008–2009

                Board                            13 624                  13 690                   13 528                   13 329                  13 279
                Province                       104 100                  103 412                  103 011                 100 823                  100 992


September 17, 2009                                                                                                                                              2 of 24
School Board Report                                                                                                       Toronto DSB (66052)


                TIPS                                     ABOUT THIS SCHOOL OR BOARD REPORT

  The applied and academic              This report shows how well students have met curriculum expectations for either the
  mathematics courses are               applied or academic mathematics program to the end of Grade 9. Students complete two
  different and should be               booklets that allow them to show what they know in mathematics. The assessment is
  considered separately.                based on The Ontario Curriculum: Mathematics, Grades 9 and 10.

  Note: Students in locally developed
  courses do not participate in these   This report includes
  assessments.
                                        ¨ results for this year;
                  –                     ¨ a comparison of results over the past four years to aid in monitoring
  Each school or board is                 improvement and
  unique. To appreciate the
  distinctive character of a            ¨ information about the characteristics of the students who participated.
  school or board, look at the
  contextual information to
  understand the features and           Specifically, you will find
  characteristics of the                ¨ summary graphs showing the percentage of students achieving the provincial
  community it serves.                    standard in either applied or academic mathematics;
                  –                     ¨ detailed tables and graphs showing results for all levels of achievement,
  This assessment captures                participation information and results for gender
  the performance of students
                                        ¨ student questionnaire results and
  at one point in time each
  year. Consider the results            ¨ an explanation of all terms used in this report.
  along with other information
  about students’ achievement
  in mathematics.

                  –                                                  HOW TO USE THIS REPORT
  Exercise caution when
  interpreting results for small        ¨ Examine the contextual information to understand the similarities and differences
  schools or boards. Results               between this school, the board and the province; the board and the province.
  may vary considerably from               Consider the challenges that any differences might present.
  year to year, and differences
  may look exaggerated. For
  example, in a school of 30            ¨ Examine the results for applied and academic mathematics.
  students, a difference of 10%              · Are these results consistent with what you would expect?
  represents only three
  students.                                  · How do the school results compare to the board and province; the board
                                               results compare to the province?
                  –
  Trends may be difficult to                 · How do these results compare over time? Note that significant revisions
  identify or to interpret. This is            were made to applied courses in 2005 as reflected in The Ontario
  especially true when groups                  Curriculum, Grades 9 and 10: Mathematics (revised 2005).
  are small or in schools where              · What influence might students’ attitudes have on student performance (refer
  there is a high turnover in the
  student population.                          to the questionnaire results)?

                  –
                                        ¨ Speak to the school or board staff about the goals for school improvement related
  EQAO values students’
  privacy. Results are not                to mathematics.
  reported publicly for schools
                                        The Education Quality and Accountability Office is an independent agency that gathers information
  where fewer than 15                   about student achievement through province-wide assessments. Each year, all Grade 9 students in
  students participated,                applied and academic mathematics take part in this assessment across Ontario. Individual results are
  because it might be possible          reported to students and to parents and guardians. School, board and provincial results are released
  to identify individual                publicly.
  students.
                                        Learn more about us at www.eqao.com.


September 17, 2009                                                                                                                        3 of 24
School Board Report                                                                                                                                    Toronto DSB (66052)

Grade 9 Assessment of Mathematics, 2008–2009, Applied Course
Contextual Information
This information provides a context for interpreting the board’s applied mathematics course results.

                                                                                                   Board                   Province

    Enrolment
     Number of students in applied mathematics course                                                        6 356                   48 482
     Number of classes with students in applied mathematics course                                             442                     2 950
     Number of schools with applied mathematics classes                                                          99                      715

                                                                                            Number Percent Number Percent
    Participation in the Assessment
     Students who participated in the assessment                                               5 496          86%       45 616          94%
       Participating students who received one or more                                         1 062          19%         9 374         21%
       accommodations*
       Participating students who received one or more special                                    363           7%        1 144           3%
       provisions*
     Students who did not complete any part of the assessment (no                                 860         14%         2 866           6%
     data)*
    Gender† Based on number of students enrolled
     Female                                                                                    2 867          45%       21 752          45%
     Male                                                                                      3 489          55%       26 730          55%
     Gender not specified                                                                            0          0%             0          0%

    Student Status† Based on number of students enrolled
     English language learners*                                                                   874         14%         2 532           5%
     Students with special needs (excluding gifted)*                                           2 078          33%       14 483          30%

    Semester/Full Year Based on number of students enrolled
     First-semester course                                                                     2 089          33%       21 964          45%
     Second-semester course                                                                    2 037          32%       21 765          45%
     Full-year course                                                                          2 230          35%         4 753         10%
                                                 ††
    Language and School Background
     Based on Student Questionnaire data
                                                            Number of Respondents:                 5 065                    43 413
     Speak only or mostly a language other than English at home                                   744    15%              2 757           6%
     Speak another language as often as English at home                                        1 068          21%         4 980         11%
     Attended three or more elementary schools from kindergarten to                            2 031          40%       17 179          40%
     Grade 8
*  See the Explanation of Terms.
†  Contextual data pertaining to “gender” and “student status” are provided by schools and/or boards through the Student Data Collection process. Some data
   may be missing because they were not provided by the school or the board.
†† Contextual data pertaining to “school background” and “language” are gathered from the Student Questionnaire completed by students. Some data may be
   missing because they were not provided by the students.


September 17, 2009                                                                                                                                                 4 of 24
School Board Report                                                                                                                                    Toronto DSB (66052)


 Grade 9 Assessment of Mathematics, 2008–2009, Applied Course
 Results for All Students
 All Students*                                                                                    Percentage of All Students in Applied Mathematics
                               Board           Province                                                         Course at All Levels*
    Number of Students         6 356            48 482
                                #        %                %
   Level 4                    193       3%              5%
   Level 3                  1 271      20%            33%
   Level 2                  1 894      30%            35%
   Level 1                  1 217      19%            14%
                                                                                                                                  35                  33
   Below Level 1              921      14%              7%                                                                  30
                                                                                                         19                                    20
          Participating                                                              14                        14
                            5 496      86%            94%                                   7
               Students                                                                                                                                           3    5
   No Data                    860      14%              6%
                                                                                    Below L1             Level 1            Level 2               Level 3         Level 4
  At or Above
  Provincial Standard                  23%            38%
                                                                                                              Board                    Province
  (Levels 3 and 4) †

 Results for Participating Students (excludes "no data" category)
 Participating Students**                                                                  Percentage of Participating Students in Applied Mathematics
                              Board           Province                                                        Course at All Levels**
   Number of Students         5 496            45 616
                                #        %                %
   Level 4                   193        4%             6%
   Level 3                  1 271      23%            35%
   Level 2                  1 894      34%            38%
   Level 1                  1 217      22%            15%
                                                                                                                            34    38                  35
   Below Level 1             921       17%             7%
                                                                                                         22                                    23
  At or Above                                                                        17                        15
  Provincial Standard                  27%            40%                                   7                                                                     4    6
  (Levels 3 and 4) †
                                                                                    Below L1             Level 1            Level 2               Level 3         Level 4

                                                                                                              Board                    Province


* Because percentages in tables and graphs are rounded, and because graphs do not show all reporting categories, percentages may not add to 100.
** Because percentages in tables and graphs are rounded, percentages may not add to 100.
† These percentages are based on the actual number of students and cannot be calculated simply by adding the rounded percentages of students at Levels 3 and 4.


September 17, 2009                                                                                                                                                     5 of 24
School Board Report                                                                                                                                    Toronto DSB (66052)


 Grade 9 Assessment of Mathematics, 2008–2009, Applied Course
 Results by Gender††
 All Students: Board by Gender*                                                                        Percentage of All Students in Applied
                                Female                  Male                                     Mathematics Course at All Levels by Gender: Board*
   Number of Students            2 867                  3 489
                                  #          %           #          %
   Level 4                       72         3%         121         3%
   Level 3                      535       19%          736        21%
   Level 2                      886       31%        1 008        29%
   Level 1                      578       20%          639        18%
   Below Level 1                399       14%          522        15%                                                       31    29
                                                                                                         20    18                              19    21
          Participating                                                              14    15
                              2 470       86%        3 026        87%
               Students                                                                                                                                           3    3
   No Data                      397       14%          463        13%
  At or Above                                                                       Below L1             Level 1            Level 2             Level 3           Level 4
  Provincial Standard                     21%                    25%
  (Levels 3 and 4) †                                                                                          Female                    Male


 All Students: Province by Gender*                                                                     Percentage of All Students in Applied
                                Female                   Male                                   Mathematics Course at All Levels by Gender: Province*
   Number of Students           21 752                  26 730
                                  #          %           #          %
   Level 4                      897         4%       1 618         6%
   Level 3                    6 581       30%        9 308        35%
   Level 2                    8 152       37%        8 965        34%
   Level 1                    3 337       15%        3 543        13%
                                                                                                                            37    34                 35
   Below Level 1              1 438         7%       1 777         7%                                                                          30
          Participating                                                                                  15    13
                            20 405        94%       25 211        94%                 7     7                                                                          6
               Students                                                                                                                                           4
   No Data                    1 347         6%       1 519         6%
  At or Above                                                                       Below L1             Level 1            Level 2             Level 3           Level 4
  Provincial Standard                     34%                    41%
  (Levels 3 and 4) †                                                                                          Female                    Male


* Because percentages in tables and graphs are rounded, and because graphs do not show all reporting categories, percentages may not add to 100.
† These percentages are based on the actual number of students and cannot be calculated simply by adding the rounded percentages of students at Levels 3 and 4.
†† Includes only students for whom gender data were available.


September 17, 2009                                                                                                                                                     6 of 24
School Board Report                                                                                                                                    Toronto DSB (66052)

Grade 9 Assessment of Mathematics, 2008–2009, Academic Course
Contextual Information
This information provides a context for interpreting the board’s academic mathematics course results.

                                                                                                   Board                   Province

    Enrolment
     Number of students in academic mathematics course                                                     13 279                   100 992
     Number of classes with students in academic mathematics                                                   578                     4 156
     course
     Number of schools with academic mathematics classes                                                         89                      684

                                                                                            Number Percent Number Percent
    Participation in the Assessment
     Students who participated in the assessment                                              13 063          98% 100 060               99%
       Participating students who received one or more                                            398           3%        3 233           3%
       accommodations*
       Participating students who received one or more special                                    456           3%        1 709           2%
       provisions*
     Students who did not complete any part of the assessment (no                                 216           2%          932           1%
     data)*
    Gender† Based on number of students enrolled
     Female                                                                                    6 499          49%       51 554          51%
     Male                                                                                      6 780          51%       49 438          49%
     Gender not specified                                                                            0          0%             0          0%

    Student Status† Based on number of students enrolled
     English language learners*                                                                1 093            8%        3 942           4%
     Students with special needs (excluding gifted)*                                              800           6%        4 639           5%

    Semester/Full Year Based on number of students enrolled
     First-semester course                                                                     2 659          20%       44 727          44%
     Second-semester course                                                                    3 115          23%       43 199          43%
     Full-year course                                                                          7 505          57%       13 066          13%
    Language and School Background††
     Based on Student Questionnaire data
                                                            Number of Respondents:                12 240                    96 485
     Speak only or mostly a language other than English at home                                2 438     20%              8 689           9%
     Speak another language as often as English at home                                        3 192          26%       14 233          15%
     Attended three or more elementary schools from kindergarten to                            4 769          39%       33 813          35%
     Grade 8
*  See the Explanation of Terms.
†  Contextual data pertaining to “gender” and “student status” are provided by schools and/or boards through the Student Data Collection process. Some data
   may be missing because they were not provided by the school or the board.
†† Contextual data pertaining to “school background” and “language” are gathered from the Student Questionnaire completed by students. Some data may be
   missing because they were not provided by the students.


September 17, 2009                                                                                                                                                 7 of 24
School Board Report                                                                                                                                    Toronto DSB (66052)


 Grade 9 Assessment of Mathematics, 2008–2009, Academic Course
 Results for All Students
 All Students*                                                                                  Percentage of All Students in Academic Mathematics
                              Board            Province                                                        Course at All Levels*
    Number of Students        13 279           100 992
                                #        %                %
   Level 4                  1 490      11%              8%
   Level 3                  8 434      64%            69%                                                                                             69
                                                                                                                                               64
   Level 2                  1 913      14%            15%
   Level 1                  1 101       8%              6%
   Below Level 1              125       1%            <1%
          Participating                                                                                                     14    15                              11
                        13 063         98%            99%                                                8                                                             8
               Students                                                                                        6
                                                                                      1    <1
   No Data                    216       2%              1%
                                                                                    Below L1             Level 1            Level 2               Level 3         Level 4
  At or Above
  Provincial Standard                  75%            77%
                                                                                                             Board                     Province
  (Levels 3 and 4) †

 Results for Participating Students (excludes "no data" category)
 Participating Students**                                                                 Percentage of Participating Students in Academic Mathematics
                              Board           Province                                                         Course at All Levels**
   Number of Students         13 063          100 060
                                #        %                %
   Level 4                  1 490      11%             8%
   Level 3                  8 434      65%            70%                                                                                             70
                                                                                                                                               65
   Level 2                  1 913      15%            15%
   Level 1                  1 101       8%             6%
   Below Level 1             125        1%            <1%
  At or Above                                                                                                               15    15                              11
  Provincial Standard                  76%            78%                                                8     6                                                       8
                                                                                      1    <1
  (Levels 3 and 4) †
                                                                                    Below L1             Level 1            Level 2               Level 3         Level 4

                                                                                                             Board                     Province


* Because percentages in tables and graphs are rounded, and because graphs do not show all reporting categories, percentages may not add to 100.
** Because percentages in tables and graphs are rounded, percentages may not add to 100.
† These percentages are based on the actual number of students and cannot be calculated simply by adding the rounded percentages of students at Levels 3 and 4.


September 17, 2009                                                                                                                                                     8 of 24
School Board Report                                                                                                                                    Toronto DSB (66052)


 Grade 9 Assessment of Mathematics, 2008–2009, Academic Course
 Results by Gender††
 All Students: Board by Gender*                                                                       Percentage of All Students in Academic
                                Female                  Male                                     Mathematics Course at All Levels by Gender: Board*
   Number of Students            6 499                  6 780
                                  #          %           #          %
   Level 4                      641       10%          849        13%
   Level 3                    4 077       63%        4 357        64%
                                                                                                                                               63    64
   Level 2                    1 019       16%          894        13%
   Level 1                      616         9%         485         7%
   Below Level 1                 50         1%          75         1%
          Participating                                                                                                     16    13                                   13
                              6 403       99%        6 660        98%                                    9     7                                                  10
               Students                                                               1     1
   No Data                       96         1%         120         2%
  At or Above                                                                       Below L1             Level 1            Level 2             Level 3           Level 4
  Provincial Standard                     73%                    77%
  (Levels 3 and 4) †                                                                                          Female                    Male


 All Students: Province by Gender*                                                                    Percentage of All Students in Academic
                                Female                   Male                                   Mathematics Course at All Levels by Gender: Province*
   Number of Students           51 554                  49 438
                                  #          %           #          %
   Level 4                    3 530         7%       4 629         9%
   Level 3                  35 048        68%       35 013        71%                                                                          68    71

   Level 2                    8 652       17%        6 476        13%
   Level 1                    3 715         7%       2 615         5%
   Below Level 1                156       <1%          226       <1%
          Participating                                                                                                     17    13
                            51 101        99%       48 959        99%                                    7     5                                                  7    9
               Students                                                              <1    <1
   No Data                      453         1%         479         1%
  At or Above                                                                       Below L1             Level 1            Level 2             Level 3           Level 4
  Provincial Standard                     75%                    80%
  (Levels 3 and 4) †                                                                                          Female                    Male


* Because percentages in tables and graphs are rounded, and because graphs do not show all reporting categories, percentages may not add to 100.
† These percentages are based on the actual number of students and cannot be calculated simply by adding the rounded percentages of students at Levels 3 and 4.
†† Includes only students for whom gender data were available.


September 17, 2009                                                                                                                                                     9 of 24
School Board Report                                                                                                                                    Toronto DSB (66052)

Grade 9 Assessment of Mathematics, 2008–2009
Contextual Information over Time: Applied Mathematics Course
This information provides a context for interpreting the board’s results over the past five years.

                                                                                           2004–2005 2005–2006 2006–2007 2007–2008 2008–2009

    Enrolment
    Number of students in applied mathematics course                                                6 334            6 551             6 228            5 894           6 356
    Number of classes with students in applied mathematics course                                      368              420              421               401            442
    Number of schools with applied mathematics classes                                                  84               96                96               96             99

    Participation in the Assessment
    Students who participated in the assessment                                                        85%              79%             80%               86%            86%
     Participating students who received one or more                                                   18%              12%             14%               19%            19%
     accommodations*
     Participating students who received one or more special                                           7%               4%                5%               6%              7%
     provisions*
    Students who did not complete any part of the assessment (no                                       11%              17%             20%               14%             14%
    data)*
    Students who were exempted*                                                                        4%               4%             ---ÌÌ                ---            ---

    Gender† Based on number of students enrolled
    Female                                                                                             42%              45%             45%               44%            45%
    Male                                                                                               54%              55%             55%               56%            55%
    Gender not specified                                                                               3%               0%              <1%                0%              0%

    Student Status† Based on number of students enrolled
    English language learners*                                                                         11%              15%             15%               15%            14%
    Students with special needs (excluding gifted)*                                                    22%              26%             29%               33%            33%

    Semester/Full Year Based on number of students enrolled
    First-semester course                                                                              33%              34%             33%               34%            33%
    Second-semester course                                                                             31%              34%             36%               34%            32%
    Full-year course                                                                                   36%              32%             31%               32%            35%
                                                 ††
    Language and School Background
     Based on Student Questionnaire data
                                                            Number of Respondents:               n/a              n/a             4 626             4 723             5 065
    Speak only or mostly a language other than English at home                                                                        15%               16%               15%
    Speak another language as often as English at home                                     Information not available                    21%               22%            21%
    Attended three or more elementary schools from kindergarten to                                                                      41%               42%            40%
    Grade 8
*   See the Explanation of Terms.
†   Contextual data pertaining to “gender” and “student status” are provided by schools and/or boards through the Student Data Collection process. Some data may be
    missing because they were not provided by the school or the board.
ÌÌ Beginning in 2006–2007, exemptions have not been permitted.
†† Contextual data pertaining to “school background” and “language” are gathered from the Student Questionnaire completed by students. Some data may be missing
    because they were not provided by the students.
n/a Information not available.


September 17, 2009                                                                                                                                                     10 of 24
School Board Report                                                                                                                                            Toronto DSB (66052)

Results over Time, 2005–2006 to 2008–2009
Applied Mathematics Course for All Students**
 Board*                                                                                                      Percentage of All Students in
                      Year    '05–'06   '06–'07        '07–'08       '08–'09                        Applied Mathematics Course at All Levels: Board*
       Number of Students     6 551      6 228         5 894         6 356
 Level 4                           2%         2%            3%            3%
 Level 3                          17%       15%            16%           20%
 Level 2                          28%       29%            30%           30%
 Level 1                          17%       18%            20%           19%
 Below Level 1                    15%       16%            17%           14%
                                                                                                                             28 29 30       30

     Participating Students       79%       80%            86%           86%         15 16 17 14          17 18
                                                                                                                  20 19
                                                                                                                                                   17 15 16
                                                                                                                                                               20

 No Data                          17%       20%            14%           14%                                                                                         2    2   3    3

 ExemptÌ                           4%            ---           ---            ---
                                                                                          Below L1          Level 1               Level 2            Level 3             Level 4
 At or Above
 Provincial Standard              20%       17%            19%           23%
 (Levels 3 and 4)†                                                                         2005–2006                  2006–2007                  2007–2008               2008–2009


 Province*                                                                                                 Percentage of All Students in
                      Year    '05–'06   '06–'07        '07–'08       '08–'09                    Applied Mathematics Course at All Levels: Province*
       Number of Students     50 687    49 056         47 817        48 482
 Level 4                           5%         5%            5%            5%
 Level 3                          31%       30%            29%           33%
 Level 2                          34%       36%            36%           35%
 Level 1                          14%       14%            15%           14%
 Below Level 1                     7%         7%            8%            7%                                                 34 36 36       35
                                                                                                                                                   31 30 29 33

     Participating Students       90%       91%            93%           94%                                      15 14
                                                                                                          14 14
                                                                                      7     7   8    7
 No Data                           8%         9%            7%            6%                                                                                         5    5   5    5

 ExemptÌ                           2%            ---           ---            ---
                                                                                          Below L1          Level 1               Level 2            Level 3             Level 4
 At or Above
 Provincial Standard              35%       35%            34%           38%
 (Levels 3 and 4)†                                                                         2005–2006                  2006–2007                  2007–2008               2008–2009


*     Because percentages in tables and graphs are rounded, and because graphs do not show all reporting categories, percentages may not add to 100.
**    Note that significant revisions were made to applied courses in 2005 as reflected in The Ontario Curriculum, Grades 9 and 10: Mathematics (revised 2005).
†     These percentages are based on the actual number of students and cannot be calculated simply by adding the rounded percentages of students at Levels 3 and 4.
Ì     In 2006–2007, students who were coded “exempt” were placed in the “no data” category. Since this may affect the percentage of students for whom no data are available, the
      results may not be comparable with those of previous years.


September 17, 2009                                                                                                                                                            11 of 24
School Board Report                                                                                                                                    Toronto DSB (66052)

Grade 9 Assessment of Mathematics, 2008–2009
Contextual Information over Time: Academic Mathematics Course
This information provides a context for interpreting the board’s results over the past five years.

                                                                                           2004–2005 2005–2006 2006–2007 2007–2008 2008–2009

    Enrolment
    Number of students in academic mathematics course                                             13 624            13 690           13 528            13 329           13 279
    Number of classes with students in academic mathematics                                            542              565              557               568            578
    course
    Number of schools with academic mathematics classes                                                 82               90                86               88             89

    Participation in the Assessment
    Students who participated in the assessment                                                        98%              96%             97%               98%             98%
     Participating students who received one or more                                                   3%               2%                2%               3%              3%
     accommodations*
     Participating students who received one or more special                                           4%               2%                3%               3%              3%
     provisions*
    Students who did not complete any part of the assessment (no                                       2%               3%                3%               2%              2%
    data)*
    Students who were exempted*                                                                        1%               1%             ---ÌÌ                ---            ---

    Gender† Based on number of students enrolled
    Female                                                                                             48%              50%             50%               49%             49%
    Male                                                                                               49%              50%             50%               51%             51%
    Gender not specified                                                                               3%               0%              <1%                0%              0%

    Student Status† Based on number of students enrolled
    English language learners*                                                                         7%               9%                9%               8%              8%
    Students with special needs (excluding gifted)*                                                    4%               5%                5%               6%              6%

    Semester/Full Year Based on number of students enrolled
    First-semester course                                                                              21%              21%             21%               23%             20%
    Second-semester course                                                                             22%              23%             24%               23%             23%
    Full-year course                                                                                   57%              56%             55%               55%             57%
    Language and School Background††
     Based on Student Questionnaire data
                                                            Number of Respondents:               n/a              n/a            12 458            12 482             12 240
    Speak only or mostly a language other than English at home                                                                        20%               20%                20%
    Speak another language as often as English at home                                     Information not available                    25%               26%             26%
    Attended three or more elementary schools from kindergarten to                                                                      40%               40%             39%
    Grade 8
*   See the Explanation of Terms.
†   Contextual data pertaining to “gender” and “student status” are provided by schools and/or boards through the Student Data Collection process. Some data may be
    missing because they were not provided by the school or the board.
ÌÌ Beginning in 2006–2007, exemptions have not been permitted.
†† Contextual data pertaining to “school background” and “language” are gathered from the Student Questionnaire completed by students. Some data may be missing
    because they were not provided by the students.
n/a Information not available.


September 17, 2009                                                                                                                                                     12 of 24
School Board Report                                                                                                                                             Toronto DSB (66052)

Results over Time, 2005–2006 to 2008–2009
Academic Mathematics Course for All Students
 Board*                                                                                                   Percentage of All Students in
                     Year    '05–'06   '06–'07     '07–'08     '08–'09                          Academic Mathematics Course at All Levels: Board*
      Number of Students     13 690    13 528      13 329      13 279
 Level 4                          7%       10%         11%          11%
 Level 3                         58%       56%         61%          64%
                                                                                                                                                                64
 Level 2                         16%       17%         15%          14%                                                                            58 56
                                                                                                                                                           61

 Level 1                         12%       12%         10%           8%
 Below Level 1                    2%        2%          1%           1%
    Participating Students       96%       97%         98%          98%                                                      16 17 15
                                                                                                        12 12                               14
                                                                                                                 10                                                       10   11 11
                                                                                                                      8                                               7
 No Data                          3%        3%          2%           2%              2     2   1    1
 ExemptÌ                          1%         ---         ---            ---
                                                                                         Below L1           Level 1               Level 2            Level 3              Level 4
 At or Above
 Provincial Standard             65%       66%         72%          75%
 (Levels 3 and 4)†                                                                        2005–2006                   2006–2007                  2007–2008                2008–2009


 Province*                                                                                                Percentage of All Students in
                     Year    '05–'06   '06–'07     '07–'08     '08–'09                         Academic Mathematics Course at All Levels: Province*
      Number of Students     103 412   103 011     100 823     100 992
 Level 4                          6%        6%          8%           8%
 Level 3                         65%       64%         68%          69%
                                                                                                                                                           68 69
                                                                                                                                                   65 64
 Level 2                         17%       18%         16%          15%
 Level 1                          9%        9%          7%           6%
 Below Level 1                    1%        1%          1%          <1%
    Participating Students       98%       98%         99%          99%                                                      17 18 16       15
                                                                                                        9    9   7                                                             8    8
 No Data                          1%        2%          1%           1%              1     1   1   <1
                                                                                                                      6                                               6    6

 ExemptÌ                         <1%         ---         ---            ---
                                                                                         Below L1           Level 1               Level 2            Level 3              Level 4
 At or Above
 Provincial Standard             71%       71%         75%          77%
 (Levels 3 and 4)†                                                                        2005–2006                   2006–2007                  2007–2008                2008–2009


*    Because percentages in tables and graphs are rounded, and because graphs do not show all reporting categories, percentages may not add to 100.
†    These percentages are based on the actual number of students and cannot be calculated simply by adding the rounded percentages of students at Levels 3 and 4.
Ì    In 2006–2007, students who were coded “exempt” were placed in the “no data” category. Since this may affect the percentage of students for whom no data are available, the
     results may not be comparable with those of previous years.


September 17, 2009                                                                                                                                                             13 of 24
School Board Report                                                                                                                                  Toronto DSB (66052)


                                                  RESULTS FOR ALL STUDENTS OVER TIME BY GENDER†

                                   Percentage of Students At or Above the Provincial Standard (Levels 3 and 4):
                                                      GRADE 9 APPLIED MATHEMATICS*

                                                        2004–2005               2005–2006              2006–2007               2007–2008              2008–2009


                    BOARD

                                                                                                                                                         21    25
                                                                16                 20   19               18    17                18    20
                                                          14


                  PROVINCE                                                                                                                                      41
                                                                                   33   37               33    37                      36                34
                                                                28                                                               31
                                                          25


                                                                                        Female                          Male


                                                      Total Number of Students in Applied Mathematics Course†
                                   2004–2005                      2005–2006                      2006–2007                     2007–2008                       2008–2009
                               Female       Male               Female      Male              Female       Male              Female       Male              Female      Male
            Board               2 688       3 439               2 927      3 624              2 773       3 451              2 591       3 303                2 867    3 489
            Province           22 371      27 413              22 884     27 802             22 126     26 926              21 626     26 182             21 752      26 730


      † Includes only students for whom gender data were available.
      * Note that significant revisions were made to applied courses in 2005 as reflected in The Ontario Curriculum, Grades 9 and 10: Mathematics (revised 2005).


September 17, 2009                                                                                                                                                    14 of 24
School Board Report                                                                                                                   Toronto DSB (66052)


                                                 RESULTS FOR ALL STUDENTS OVER TIME BY GENDER†

                                   Percentage of Students At or Above the Provincial Standard (Levels 3 and 4):
                                                      GRADE 9 ACADEMIC MATHEMATICS

                                                       2004–2005              2005–2006             2006–2007      2007–2008          2008–2009


                                                                                                                             73         73    77
                                                                66                    66                  67            70
                                                          64                     65                  65

                    BOARD


                                                                                                                             77               80
                                                                                      72                  72            74              75
                                                          67    69               70                  69

                  PROVINCE


                                                                                      Female                    Male


                                                    Total Number of Students in Academic Mathematics Course†
                                  2004–2005                       2005–2006                   2006–2007                2007–2008              2008–2009
                               Female       Male               Female    Male              Female     Male       Female       Male       Female       Male
            Board               6 595       6 635               6 875    6 815              6 756    6 770        6 548       6 781          6 499    6 780
            Province           52 030     50 129               53 183   50 228             52 887   50 122       51 367      49 452      51 554      49 438


      † Includes only students for whom gender data were available.


September 17, 2009                                                                                                                                   15 of 24
School Board Report                                                                                                                                         Toronto DSB (66052)


Grade 9 Assessment of Mathematics, 2008–2009, Applied Course

                                   STUDENT QUESTIONNAIRE RESULTS FOR THIS BOARD (# = 5 065)

                                                                                                 Percentage of Students*
                     Questionnaire Item
                                                                                 0                                                                    100

                                                                                                                                                               Number of
                                                                                                                                                             Students Who
1. Degree to which students “agree” or “disagree” with each of the following statements:                                                                       Answered
                                                                                                                                                            “Strongly Agree
                                                                                                                                                               or Agree”


                                                 I like mathematics.                                     40                      28                  31         2 023

                                        I am good at mathematics.                                   33                           35                  31         1 668

        I understand most of the mathematics I am taught.                                                               60                      26   14         3 028

             The mathematics I learn now is very useful for                                                     47                    27             25         2 398
                                             everyday life.
   I need to keep taking mathematics for the kind of job I                                                      47                     30            22         2 377
                               want after I leave school.

                                            Mathematics is boring.                                    36                    28                       35         1 810

                                 Mathematics is an easy subject.                            20                   30                                  49         1 019


                                                                                     Strongly agree or                                         Disagree or
                                                                                                                     Undecided
                                                                                          agree                                             strongly disagree

                                                                                                                                                               Number of
                                                                                                                                                             Students Who
2. How “easy” or “hard” students find mathematics questions that deal with the following:
                                                                                                                                                            Answered “Very
                                                                                                                                                             Easy or Easy”

     number sense (e.g., operations with integers, rational                                                     46                         34        18         2 348
                                     numbers, exponents)
                algebra (e.g., solving equations, simplifying                                              41                    29                  28         2 094
                               expressions with polynomials)

        linear relations (e.g., scatter plots, lines of best fit)                                                      57                   27       15         2 869

                measurement (e.g., perimeter, area, volume)                                                                 62                  24   13         3 117

      geometry (e.g., angles, parallel lines, quadrilaterals)                                            40                           34             24         2 020


                                                                                   Very easy or easy                 Undecided              Hard or very hard


* Percentages may not add to 100, due to a lack of or ambiguous responses. Where there is no number in a box, the percentage of responses is smaller than 4.


September 17, 2009                                                                                                                                                      16 of 24
School Board Report                                                                                                                                      Toronto DSB (66052)


Grade 9 Assessment of Mathematics, 2008–2009, Applied Course

                                 STUDENT QUESTIONNAIRE RESULTS FOR THIS BOARD (# = 5 065)

                                                                                                    Percentage of Students*
                     Questionnaire Item
                                                                                 0                                                               100

                                                                                                                                                            Number of
                                                                                                                                                          Students Who
 3. Students have the following at home to use for mathematics school work:
                                                                                                                                                            Answered
                                                                                                                                                              “Yes”

                                                            a computer                                                49                       49               2 495

                                              a scientific calculator                                                                75        23               3 794

                                               a graphing calculator                     14                                                    83                733


                                                                                                          Yes                   No


                                                                                                                                                               Number of
 4. Amount of time students usually spend on mathematics homework (in or out of school) on any given day:                                                      Students


                                              more than 45 minutes                             16                                                                809

                                      between 31 and 45 minutes                                      24                                                         1 201

                                                   30 minutes or less                                            41                                             2 071

               mathematics homework not usually assigned                                       17                                                                882

                                                                                                                                                               Number of
5. How often students complete all of their mathematics homework:
                                                                                                                                                               Students


                                                     never or seldom                          15                                                                 779

                                                            sometimes                                       34                                                  1 719

                                                      often or always                                                      48                                   2 449

                                                                                                                                                               Number of
 6. How often students have been absent from their Grade 9 mathematics class this year:
                                                                                                                                                               Students


                                                                   never                      14                                                                 713

                                                    one to four times                                                  47                                       2 366

                                                   five to nine times                               21                                                          1 039

                                                    10 or more times                           16                                                                817

* Percentages may not add to 100, due to a lack of or ambiguous responses. Where there is no number in a box, the percentage of responses is smaller than 4.


September 17, 2009                                                                                                                                                         17 of 24
School Board Report                                                                                                         Toronto DSB (66052)


Grade 9 Assessment of Mathematics, 2008–2009, Applied Course

                                  STUDENT QUESTIONNAIRE RESULTS FOR THIS BOARD (# = 5 065)

                                                                                            Percentage of Students*
                     Questionnaire Item
                                                                             0                                        100

                                                                                                                               Number of
7. How often students have been late for their Grade 9 mathematics class this year:
                                                                                                                               Students


                                                                  never                         24                              1 237

                                                   one to four times                                 36                         1 801

                                                   five to nine times                  18                                        902

                                                   10 or more times                        19                                    987


                                                                                                                               Number of
8. Language(s) students speak at home:
                                                                                                                               Students


                                            only or mostly English                                             62               3 134

          another language (or other languages) as often as
                                                                                            21                                  1 068
                                                   English

    only or mostly another language (or other languages)                              15                                         744


 9. Number of elementary schools (kindergarten to Grade 8) attended:                                                           Number of
                                                                                                                               Students


                                                 one or two schools                                       57                    2 886

                                                        three schools                      20                                    995

                                                         four schools            10                                              514

                                               five schools or more              10                                              522

* Percentages may not add to 100, due to a lack of or ambiguous responses.


September 17, 2009                                                                                                                      18 of 24
School Board Report                                                                                                                                                     Toronto DSB (66052)

Grade 9 Assessment of Mathematics, 2008–2009, Applied Course
                                                                                             Board                                      Province


                                                                              All Students


                                                                                                                         All Students
                                                                                                                         (# = 43 413)


                                                                                                                                          (# = 19 517)


                                                                                                                                                         (# = 23 896)
                                                                              (# = 5 065)


                                                                                             (# = 2 292)


                                                                                                           (# = 2 773)
                                                                                             Female*


                                                                                                                                          Female*
STUDENT QUESTIONNAIRE RESULTS


                                                                                                           Male*


                                                                                                                                                         Male*
FOR BOARD AND PROVINCE
(all students, female, male)
Percentage of students indicating that they “strongly agree” or “agree” with each of the following statements:
                                                  I like mathematics.              40%            33%           46%           36%               30%            42%
                                         I am good at mathematics.                 33%            26%           39%           36%               28%            43%
             I understand most of the mathematics I am taught.                     60%            57%           62%           63%               59%            66%
 The mathematics I learn now is very useful for everyday life.                     47%            46%           48%           42%               39%            44%
  I need to keep taking mathematics for the kind of job I want
                                                                                   47%            45%           49%           43%               39%            46%
                                          after I leave school.
                                             Mathematics is boring.                36%            38%           34%           42%               44%            41%
                                   Mathematics is an easy subject.                 20%            15%           24%           22%               17%            27%
Percentage of students indicating that the following are “very easy” or “easy”:
                                                        number sense               46%            42%           50%           47%               43%            50%
                                                               algebra             41%            41%           42%           43%               44%            43%
                                                       linear relations            57%            57%           57%           64%               63%            64%
                                                        measurement                62%            61%           62%           66%               65%            67%
                                                             geometry              40%            37%           42%           41%               36%            45%
Percentage of students indicating they have the following at home to use for mathematics school work:
                                                           a computer              49%            50%           48%           45%               46%            44%
                                               a scientific calculator             75%            80%           71%           75%               79%            73%
                                               a graphing calculator               14%            13%           15%           10%                  8%          11%
Percentage of students indicating they usually spend the following amounts of time on mathematics homework
(in or out of school) on any given day:**
                                                   30 minutes or less              41%            38%           43%           46%               44%            47%
                                               more than 30 minutes                40%            43%           37%           34%               38%            31%
                    mathematics homework not usually assigned                      17%            17%           18%           19%               17%            21%
Percentage of students indicating they complete all of their mathematics homework**
                                                    never or seldom.               15%            12%           18%           16%               13%            19%
                                                           sometimes.              34%            34%           34%           31%               31%            31%
                                                     often or always.              48%            51%           46%           51%               55%            48%
Percentage of students indicating they have been absent from their mathematics class this year**
                                                   four times or less.             61%            61%           61%           60%               58%            61%
                                                  five times or more.              37%            37%           36%           39%               41%            38%
Percentage of students indicating how often they have been late for their mathematics class this year**
                                                   four times or less.             60%            62%           59%           69%               69%            68%
                                                  five times or more.              37%            36%           39%           30%               29%            30%
Percentage of students indicating that they speak the following language(s) at home:**
                                             only or mostly English                62%            63%           61%           81%               81%            81%
     another language (or other languages) as often as English                     21%            22%           20%           11%               12%            11%
          only or mostly another language (or other languages)                     15%            12%           17%              6%                6%             7%
Percentage of students indicating that from kindergarten to Grade 8 they attended
                                three or more elementary schools.                  40%            41%           39%           40%               40%            39%
* Includes only students for whom gender data were available.
** Percentages may not add to 100, due to a lack of or ambiguous responses.


September 17, 2009                                                                                                                                                                 19 of 24
School Board Report                                                                                                                                        Toronto DSB (66052)


Grade 9 Assessment of Mathematics, 2008–2009, Academic Course

                                  STUDENT QUESTIONNAIRE RESULTS FOR THIS BOARD (# = 12 240)

                                                                                                Percentage of Students*
                     Questionnaire Item
                                                                                 0                                                                    100

                                                                                                                                                               Number of
                                                                                                                                                             Students Who
1. Degree to which students “agree” or “disagree” with each of the following statements:                                                                       Answered
                                                                                                                                                            “Strongly Agree
                                                                                                                                                               or Agree”


                                                 I like mathematics.                                                  58                  23         19         7 118

                                        I am good at mathematics.                                                51                       30         18         6 292

        I understand most of the mathematics I am taught.                                                                        72             18    9         8 859

             The mathematics I learn now is very useful for
                                                                                                          42                     31                  27         5 108
                                             everyday life.
   I need to keep taking mathematics for the kind of job I
                                                                                                                      58                       29    12         7 107
                               want after I leave school.

                                            Mathematics is boring.                              27                  28                               45         3 263

                                 Mathematics is an easy subject.                                  30                  29                             40         3 685


                                                                                     Strongly agree or                                        Disagree or
                                                                                                                 Undecided
                                                                                          agree                                            strongly disagree

                                                                                                                                                               Number of
                                                                                                                                                             Students Who
2. How “easy” or “hard” students find mathematics questions that deal with the following:
                                                                                                                                                            Answered “Very
                                                                                                                                                             Easy or Easy”

     number sense (e.g., operations with integers, rational
                                                                                                                                69              21    9         8 401
                                     numbers, exponents)
                algebra (e.g., solving equations, simplifying
                                                                                                                           65              19        15         7 901
                               expressions with polynomials)

        linear relations (e.g., scatter plots, lines of best fit)                                              47                    29              22         5 745

  analytic geometry (e.g., slope, y-intercept, equations of
                                                                                                            45                  24                   29         5 553
                                                      lines)

                measurement (e.g., perimeter, area, volume)                                                                          75         16    7         9 190

      geometry (e.g., angles, parallel lines, quadrilaterals)                                                              63              22        13         7 758


                                                                                     Very easy or easy           Undecided                 Hard or very hard


* Percentages may not add to 100, due to a lack of or ambiguous responses. Where there is no number in a box, the percentage of responses is smaller than 4.


September 17, 2009                                                                                                                                                       20 of 24
School Board Report                                                                                                                                      Toronto DSB (66052)


Grade 9 Assessment of Mathematics, 2008–2009, Academic Course

                                STUDENT QUESTIONNAIRE RESULTS FOR THIS BOARD (# = 12 240)

                                                                                                        Percentage of Students*
                     Questionnaire Item
                                                                                 0                                                               100

                                                                                                                                                            Number of
                                                                                                                                                          Students Who
 3. Students have the following at home to use for mathematics school work:
                                                                                                                                                            Answered
                                                                                                                                                              “Yes”

                                                            a computer                                                      59                  39              7 264

                                              a scientific calculator                                                                      87   11              10 654

                                               a graphing calculator                         13                                                 85              1 536


                                                                                                                 Yes                  No


                                                                                                                                                               Number of
 4. Amount of time students usually spend on mathematics homework (in or out of school) on any given day:                                                      Students


                                              more than 45 minutes                                          24                                                  2 978

                                      between 31 and 45 minutes                                                    34                                           4 189

                                                   30 minutes or less                                                  36                                       4 415

               mathematics homework not usually assigned                             3                                                                           389

                                                                                                                                                               Number of
5. How often students complete all of their mathematics homework:
                                                                                                                                                               Students


                                                     never or seldom                              14                                                            1 669

                                                            sometimes                                        26                                                 3 134

                                                      often or always                                                            58                             7 141

                                                                                                                                                               Number of
 6. How often students have been absent from their Grade 9 mathematics class this year:
                                                                                                                                                               Students


                                                                   never                               19                                                       2 353

                                                    one to four times                                                       56                                  6 842

                                                   five to nine times                              16                                                           1 943

                                                    10 or more times                     6                                                                       782

* Percentages may not add to 100, due to a lack of or ambiguous responses. Where there is no number in a box, the percentage of responses is smaller than 4.


September 17, 2009                                                                                                                                                         21 of 24
Jarvis Collegiate Institute Gr 9 - 12 - EQAO Board Report

Contenu connexe

Tendances

Naep estimated equivalency 2011 wkce admin ppt
Naep estimated equivalency 2011 wkce admin pptNaep estimated equivalency 2011 wkce admin ppt
Naep estimated equivalency 2011 wkce admin pptroverdust
 
P.S. 160 Progress Report
P.S. 160 Progress ReportP.S. 160 Progress Report
P.S. 160 Progress Reportguestc6e565
 
Havelock snapshot
Havelock snapshotHavelock snapshot
Havelock snapshotsmithlori24
 
High School Success
High School SuccessHigh School Success
High School SuccessE3 Alliance
 
Don Fraynd, Chief School Improvement Officer, Chicago Public Schools Presenta...
Don Fraynd, Chief School Improvement Officer, Chicago Public Schools Presenta...Don Fraynd, Chief School Improvement Officer, Chicago Public Schools Presenta...
Don Fraynd, Chief School Improvement Officer, Chicago Public Schools Presenta...Education Resource Strategies
 
High School Success
High School SuccessHigh School Success
High School SuccessChristin007
 
PTISD District Report Oct. 2012
PTISD District Report Oct. 2012PTISD District Report Oct. 2012
PTISD District Report Oct. 2012Pine Tree ISD
 
Branford Connecticut CMTs CAPT 2006-2012 results District Reference Group Ran...
Branford Connecticut CMTs CAPT 2006-2012 results District Reference Group Ran...Branford Connecticut CMTs CAPT 2006-2012 results District Reference Group Ran...
Branford Connecticut CMTs CAPT 2006-2012 results District Reference Group Ran...Thomas Salvin
 
Kenya school report card 2012 pilot report
Kenya school report card 2012   pilot reportKenya school report card 2012   pilot report
Kenya school report card 2012 pilot reportKenyaSchoolReport.com
 

Tendances (13)

AEIS Report Presentation
AEIS Report PresentationAEIS Report Presentation
AEIS Report Presentation
 
Naep estimated equivalency 2011 wkce admin ppt
Naep estimated equivalency 2011 wkce admin pptNaep estimated equivalency 2011 wkce admin ppt
Naep estimated equivalency 2011 wkce admin ppt
 
P.S. 160 Progress Report
P.S. 160 Progress ReportP.S. 160 Progress Report
P.S. 160 Progress Report
 
Havelock snapshot
Havelock snapshotHavelock snapshot
Havelock snapshot
 
High School Success
High School SuccessHigh School Success
High School Success
 
Eex6065 transition 2012
Eex6065 transition 2012Eex6065 transition 2012
Eex6065 transition 2012
 
School report card 2013 Kenya
School report card  2013  KenyaSchool report card  2013  Kenya
School report card 2013 Kenya
 
Don Fraynd, Chief School Improvement Officer, Chicago Public Schools Presenta...
Don Fraynd, Chief School Improvement Officer, Chicago Public Schools Presenta...Don Fraynd, Chief School Improvement Officer, Chicago Public Schools Presenta...
Don Fraynd, Chief School Improvement Officer, Chicago Public Schools Presenta...
 
High School Success
High School SuccessHigh School Success
High School Success
 
PTISD District Report Oct. 2012
PTISD District Report Oct. 2012PTISD District Report Oct. 2012
PTISD District Report Oct. 2012
 
Kis aua
Kis auaKis aua
Kis aua
 
Branford Connecticut CMTs CAPT 2006-2012 results District Reference Group Ran...
Branford Connecticut CMTs CAPT 2006-2012 results District Reference Group Ran...Branford Connecticut CMTs CAPT 2006-2012 results District Reference Group Ran...
Branford Connecticut CMTs CAPT 2006-2012 results District Reference Group Ran...
 
Kenya school report card 2012 pilot report
Kenya school report card 2012   pilot reportKenya school report card 2012   pilot report
Kenya school report card 2012 pilot report
 

Similaire à Jarvis Collegiate Institute Gr 9 - 12 - EQAO Board Report

Cottingham Junior Public School Gr JK - 6 - EQAO Board Report
Cottingham Junior Public School Gr JK - 6 - EQAO Board ReportCottingham Junior Public School Gr JK - 6 - EQAO Board Report
Cottingham Junior Public School Gr JK - 6 - EQAO Board ReportEvanSage
 
Deer Park Junior and Senior Public School Gr JK - 8 - EQAO Board Report
Deer Park Junior and Senior Public School Gr JK - 8 - EQAO Board ReportDeer Park Junior and Senior Public School Gr JK - 8 - EQAO Board Report
Deer Park Junior and Senior Public School Gr JK - 8 - EQAO Board ReportEvanSage
 
Jesse Ketchum Junior and Senior Public School Gr JK - 8 - EQAO Board Report
Jesse Ketchum Junior and Senior Public School Gr JK - 8 - EQAO Board ReportJesse Ketchum Junior and Senior Public School Gr JK - 8 - EQAO Board Report
Jesse Ketchum Junior and Senior Public School Gr JK - 8 - EQAO Board ReportEvanSage
 
Rosedale Junior Public School Gr JK - 6 - EQAO Board Report
Rosedale Junior Public School Gr JK - 6 - EQAO Board ReportRosedale Junior Public School Gr JK - 6 - EQAO Board Report
Rosedale Junior Public School Gr JK - 6 - EQAO Board ReportEvanSage
 
EQAO Board Report
EQAO Board ReportEQAO Board Report
EQAO Board ReportEvanSage
 
Rosedale Junior Public School Gr JK - 6 - EQAO School Report
Rosedale Junior Public School Gr JK - 6 - EQAO School ReportRosedale Junior Public School Gr JK - 6 - EQAO School Report
Rosedale Junior Public School Gr JK - 6 - EQAO School ReportEvanSage
 
Deer Park Junior and Senior Public School Gr JK - 8 - EQAO School Report
Deer Park Junior and Senior Public School Gr JK - 8 - EQAO School ReportDeer Park Junior and Senior Public School Gr JK - 8 - EQAO School Report
Deer Park Junior and Senior Public School Gr JK - 8 - EQAO School ReportEvanSage
 
Jesse Ketchum Junior and Senior Public School Gr JK - 8 - EQAO School Report
Jesse Ketchum Junior and Senior Public School Gr JK - 8  - EQAO School ReportJesse Ketchum Junior and Senior Public School Gr JK - 8  - EQAO School Report
Jesse Ketchum Junior and Senior Public School Gr JK - 8 - EQAO School ReportEvanSage
 
Whitney Junior Public School Gr JK - 6 - EQAO School Report
Whitney Junior Public School Gr JK - 6 - EQAO School ReportWhitney Junior Public School Gr JK - 6 - EQAO School Report
Whitney Junior Public School Gr JK - 6 - EQAO School ReportEvanSage
 
Brown Junior Public School - EQAO School Report
Brown Junior Public School - EQAO School ReportBrown Junior Public School - EQAO School Report
Brown Junior Public School - EQAO School ReportEvanSage
 
An Alternative Method to Rate Teacher Performance
An Alternative Method to Rate Teacher PerformanceAn Alternative Method to Rate Teacher Performance
An Alternative Method to Rate Teacher PerformanceNWEA
 
K to 12 General Presentation
K to 12 General PresentationK to 12 General Presentation
K to 12 General PresentationDepEdPhilippines
 
1 RAM Orientation Presentation MaterialsPPT.pptx
1 RAM Orientation Presentation MaterialsPPT.pptx1 RAM Orientation Presentation MaterialsPPT.pptx
1 RAM Orientation Presentation MaterialsPPT.pptxRoseLimaMagbanua
 
STaR Analysis
STaR AnalysisSTaR Analysis
STaR Analysiscoach_ish
 
schooling vs learning.pdf
schooling vs learning.pdfschooling vs learning.pdf
schooling vs learning.pdfAyuzela1
 
SACS Presentation
SACS PresentationSACS Presentation
SACS Presentationjbhockett
 
Technology Academies - YTA and ATA
Technology Academies -  YTA and ATATechnology Academies -  YTA and ATA
Technology Academies - YTA and ATAgbilokonsky
 
Extreme math makeover
Extreme math makeoverExtreme math makeover
Extreme math makeoverakutch
 

Similaire à Jarvis Collegiate Institute Gr 9 - 12 - EQAO Board Report (20)

Cottingham Junior Public School Gr JK - 6 - EQAO Board Report
Cottingham Junior Public School Gr JK - 6 - EQAO Board ReportCottingham Junior Public School Gr JK - 6 - EQAO Board Report
Cottingham Junior Public School Gr JK - 6 - EQAO Board Report
 
Deer Park Junior and Senior Public School Gr JK - 8 - EQAO Board Report
Deer Park Junior and Senior Public School Gr JK - 8 - EQAO Board ReportDeer Park Junior and Senior Public School Gr JK - 8 - EQAO Board Report
Deer Park Junior and Senior Public School Gr JK - 8 - EQAO Board Report
 
Jesse Ketchum Junior and Senior Public School Gr JK - 8 - EQAO Board Report
Jesse Ketchum Junior and Senior Public School Gr JK - 8 - EQAO Board ReportJesse Ketchum Junior and Senior Public School Gr JK - 8 - EQAO Board Report
Jesse Ketchum Junior and Senior Public School Gr JK - 8 - EQAO Board Report
 
Rosedale Junior Public School Gr JK - 6 - EQAO Board Report
Rosedale Junior Public School Gr JK - 6 - EQAO Board ReportRosedale Junior Public School Gr JK - 6 - EQAO Board Report
Rosedale Junior Public School Gr JK - 6 - EQAO Board Report
 
EQAO Board Report
EQAO Board ReportEQAO Board Report
EQAO Board Report
 
Rosedale Junior Public School Gr JK - 6 - EQAO School Report
Rosedale Junior Public School Gr JK - 6 - EQAO School ReportRosedale Junior Public School Gr JK - 6 - EQAO School Report
Rosedale Junior Public School Gr JK - 6 - EQAO School Report
 
Deer Park Junior and Senior Public School Gr JK - 8 - EQAO School Report
Deer Park Junior and Senior Public School Gr JK - 8 - EQAO School ReportDeer Park Junior and Senior Public School Gr JK - 8 - EQAO School Report
Deer Park Junior and Senior Public School Gr JK - 8 - EQAO School Report
 
Jesse Ketchum Junior and Senior Public School Gr JK - 8 - EQAO School Report
Jesse Ketchum Junior and Senior Public School Gr JK - 8  - EQAO School ReportJesse Ketchum Junior and Senior Public School Gr JK - 8  - EQAO School Report
Jesse Ketchum Junior and Senior Public School Gr JK - 8 - EQAO School Report
 
Whitney Junior Public School Gr JK - 6 - EQAO School Report
Whitney Junior Public School Gr JK - 6 - EQAO School ReportWhitney Junior Public School Gr JK - 6 - EQAO School Report
Whitney Junior Public School Gr JK - 6 - EQAO School Report
 
Brown Junior Public School - EQAO School Report
Brown Junior Public School - EQAO School ReportBrown Junior Public School - EQAO School Report
Brown Junior Public School - EQAO School Report
 
An Alternative Method to Rate Teacher Performance
An Alternative Method to Rate Teacher PerformanceAn Alternative Method to Rate Teacher Performance
An Alternative Method to Rate Teacher Performance
 
K to 12 General Presentation
K to 12 General PresentationK to 12 General Presentation
K to 12 General Presentation
 
1 RAM Orientation Presentation MaterialsPPT.pptx
1 RAM Orientation Presentation MaterialsPPT.pptx1 RAM Orientation Presentation MaterialsPPT.pptx
1 RAM Orientation Presentation MaterialsPPT.pptx
 
STaR Analysis
STaR AnalysisSTaR Analysis
STaR Analysis
 
schooling vs learning.pdf
schooling vs learning.pdfschooling vs learning.pdf
schooling vs learning.pdf
 
SACS Presentation
SACS PresentationSACS Presentation
SACS Presentation
 
Iqar 2010
Iqar 2010Iqar 2010
Iqar 2010
 
Technology Academies - YTA and ATA
Technology Academies -  YTA and ATATechnology Academies -  YTA and ATA
Technology Academies - YTA and ATA
 
Olimpíada Internacional Matemática sem Fronteiras - Resultados do Brasil 2011...
Olimpíada Internacional Matemática sem Fronteiras - Resultados do Brasil 2011...Olimpíada Internacional Matemática sem Fronteiras - Resultados do Brasil 2011...
Olimpíada Internacional Matemática sem Fronteiras - Resultados do Brasil 2011...
 
Extreme math makeover
Extreme math makeoverExtreme math makeover
Extreme math makeover
 

Plus de EvanSage

637 Lakeshore Blvd. W PH14
637 Lakeshore Blvd. W PH14637 Lakeshore Blvd. W PH14
637 Lakeshore Blvd. W PH14EvanSage
 
1Scott St. Toronto Suite 2402
1Scott St. Toronto Suite 24021Scott St. Toronto Suite 2402
1Scott St. Toronto Suite 2402EvanSage
 
Whitney Junior Public School Gr JK - 6 Profile
Whitney Junior Public School Gr JK - 6 ProfileWhitney Junior Public School Gr JK - 6 Profile
Whitney Junior Public School Gr JK - 6 ProfileEvanSage
 
Rosedale Junior Public School Gr JK - 6 Profile
Rosedale Junior Public School Gr JK - 6 ProfileRosedale Junior Public School Gr JK - 6 Profile
Rosedale Junior Public School Gr JK - 6 ProfileEvanSage
 
Jesse Ketchum Junior and Senior Public School Gr JK - 8 Profile
Jesse Ketchum Junior and Senior Public School Gr JK - 8  ProfileJesse Ketchum Junior and Senior Public School Gr JK - 8  Profile
Jesse Ketchum Junior and Senior Public School Gr JK - 8 ProfileEvanSage
 
Jarvis Collegiate Institute Gr 9 - 12 Profile
Jarvis Collegiate Institute Gr 9 - 12 ProfileJarvis Collegiate Institute Gr 9 - 12 Profile
Jarvis Collegiate Institute Gr 9 - 12 ProfileEvanSage
 
Deer Park Junior and Senior Public School Gr JK - 8 Profile
Deer Park Junior and Senior Public School Gr JK - 8  ProfileDeer Park Junior and Senior Public School Gr JK - 8  Profile
Deer Park Junior and Senior Public School Gr JK - 8 ProfileEvanSage
 
Cottingham Junior Public School Gr JK - 6 Profile
Cottingham Junior Public School Gr JK - 6 ProfileCottingham Junior Public School Gr JK - 6 Profile
Cottingham Junior Public School Gr JK - 6 ProfileEvanSage
 
Brown Junior Public School Description
Brown Junior Public School DescriptionBrown Junior Public School Description
Brown Junior Public School DescriptionEvanSage
 
1 Scott St Condo Unit 2402
1  Scott  St  Condo  Unit 24021  Scott  St  Condo  Unit 2402
1 Scott St Condo Unit 2402EvanSage
 

Plus de EvanSage (10)

637 Lakeshore Blvd. W PH14
637 Lakeshore Blvd. W PH14637 Lakeshore Blvd. W PH14
637 Lakeshore Blvd. W PH14
 
1Scott St. Toronto Suite 2402
1Scott St. Toronto Suite 24021Scott St. Toronto Suite 2402
1Scott St. Toronto Suite 2402
 
Whitney Junior Public School Gr JK - 6 Profile
Whitney Junior Public School Gr JK - 6 ProfileWhitney Junior Public School Gr JK - 6 Profile
Whitney Junior Public School Gr JK - 6 Profile
 
Rosedale Junior Public School Gr JK - 6 Profile
Rosedale Junior Public School Gr JK - 6 ProfileRosedale Junior Public School Gr JK - 6 Profile
Rosedale Junior Public School Gr JK - 6 Profile
 
Jesse Ketchum Junior and Senior Public School Gr JK - 8 Profile
Jesse Ketchum Junior and Senior Public School Gr JK - 8  ProfileJesse Ketchum Junior and Senior Public School Gr JK - 8  Profile
Jesse Ketchum Junior and Senior Public School Gr JK - 8 Profile
 
Jarvis Collegiate Institute Gr 9 - 12 Profile
Jarvis Collegiate Institute Gr 9 - 12 ProfileJarvis Collegiate Institute Gr 9 - 12 Profile
Jarvis Collegiate Institute Gr 9 - 12 Profile
 
Deer Park Junior and Senior Public School Gr JK - 8 Profile
Deer Park Junior and Senior Public School Gr JK - 8  ProfileDeer Park Junior and Senior Public School Gr JK - 8  Profile
Deer Park Junior and Senior Public School Gr JK - 8 Profile
 
Cottingham Junior Public School Gr JK - 6 Profile
Cottingham Junior Public School Gr JK - 6 ProfileCottingham Junior Public School Gr JK - 6 Profile
Cottingham Junior Public School Gr JK - 6 Profile
 
Brown Junior Public School Description
Brown Junior Public School DescriptionBrown Junior Public School Description
Brown Junior Public School Description
 
1 Scott St Condo Unit 2402
1  Scott  St  Condo  Unit 24021  Scott  St  Condo  Unit 2402
1 Scott St Condo Unit 2402
 

Dernier

ESP 4-EDITED.pdfmmcncncncmcmmnmnmncnmncmnnjvnnv
ESP 4-EDITED.pdfmmcncncncmcmmnmnmncnmncmnnjvnnvESP 4-EDITED.pdfmmcncncncmcmmnmnmncnmncmnnjvnnv
ESP 4-EDITED.pdfmmcncncncmcmmnmnmncnmncmnnjvnnvRicaMaeCastro1
 
Scientific Writing :Research Discourse
Scientific  Writing :Research  DiscourseScientific  Writing :Research  Discourse
Scientific Writing :Research DiscourseAnita GoswamiGiri
 
Q-Factor General Quiz-7th April 2024, Quiz Club NITW
Q-Factor General Quiz-7th April 2024, Quiz Club NITWQ-Factor General Quiz-7th April 2024, Quiz Club NITW
Q-Factor General Quiz-7th April 2024, Quiz Club NITWQuiz Club NITW
 
How to Make a Duplicate of Your Odoo 17 Database
How to Make a Duplicate of Your Odoo 17 DatabaseHow to Make a Duplicate of Your Odoo 17 Database
How to Make a Duplicate of Your Odoo 17 DatabaseCeline George
 
Indexing Structures in Database Management system.pdf
Indexing Structures in Database Management system.pdfIndexing Structures in Database Management system.pdf
Indexing Structures in Database Management system.pdfChristalin Nelson
 
31 ĐỀ THI THỬ VÀO LỚP 10 - TIẾNG ANH - FORM MỚI 2025 - 40 CÂU HỎI - BÙI VĂN V...
31 ĐỀ THI THỬ VÀO LỚP 10 - TIẾNG ANH - FORM MỚI 2025 - 40 CÂU HỎI - BÙI VĂN V...31 ĐỀ THI THỬ VÀO LỚP 10 - TIẾNG ANH - FORM MỚI 2025 - 40 CÂU HỎI - BÙI VĂN V...
31 ĐỀ THI THỬ VÀO LỚP 10 - TIẾNG ANH - FORM MỚI 2025 - 40 CÂU HỎI - BÙI VĂN V...Nguyen Thanh Tu Collection
 
MS4 level being good citizen -imperative- (1) (1).pdf
MS4 level   being good citizen -imperative- (1) (1).pdfMS4 level   being good citizen -imperative- (1) (1).pdf
MS4 level being good citizen -imperative- (1) (1).pdfMr Bounab Samir
 
Beauty Amidst the Bytes_ Unearthing Unexpected Advantages of the Digital Wast...
Beauty Amidst the Bytes_ Unearthing Unexpected Advantages of the Digital Wast...Beauty Amidst the Bytes_ Unearthing Unexpected Advantages of the Digital Wast...
Beauty Amidst the Bytes_ Unearthing Unexpected Advantages of the Digital Wast...DhatriParmar
 
BIOCHEMISTRY-CARBOHYDRATE METABOLISM CHAPTER 2.pptx
BIOCHEMISTRY-CARBOHYDRATE METABOLISM CHAPTER 2.pptxBIOCHEMISTRY-CARBOHYDRATE METABOLISM CHAPTER 2.pptx
BIOCHEMISTRY-CARBOHYDRATE METABOLISM CHAPTER 2.pptxSayali Powar
 
Unraveling Hypertext_ Analyzing Postmodern Elements in Literature.pptx
Unraveling Hypertext_ Analyzing  Postmodern Elements in  Literature.pptxUnraveling Hypertext_ Analyzing  Postmodern Elements in  Literature.pptx
Unraveling Hypertext_ Analyzing Postmodern Elements in Literature.pptxDhatriParmar
 
4.16.24 21st Century Movements for Black Lives.pptx
4.16.24 21st Century Movements for Black Lives.pptx4.16.24 21st Century Movements for Black Lives.pptx
4.16.24 21st Century Movements for Black Lives.pptxmary850239
 
Expanded definition: technical and operational
Expanded definition: technical and operationalExpanded definition: technical and operational
Expanded definition: technical and operationalssuser3e220a
 
DIFFERENT BASKETRY IN THE PHILIPPINES PPT.pptx
DIFFERENT BASKETRY IN THE PHILIPPINES PPT.pptxDIFFERENT BASKETRY IN THE PHILIPPINES PPT.pptx
DIFFERENT BASKETRY IN THE PHILIPPINES PPT.pptxMichelleTuguinay1
 
4.9.24 School Desegregation in Boston.pptx
4.9.24 School Desegregation in Boston.pptx4.9.24 School Desegregation in Boston.pptx
4.9.24 School Desegregation in Boston.pptxmary850239
 
Tree View Decoration Attribute in the Odoo 17
Tree View Decoration Attribute in the Odoo 17Tree View Decoration Attribute in the Odoo 17
Tree View Decoration Attribute in the Odoo 17Celine George
 
4.11.24 Poverty and Inequality in America.pptx
4.11.24 Poverty and Inequality in America.pptx4.11.24 Poverty and Inequality in America.pptx
4.11.24 Poverty and Inequality in America.pptxmary850239
 
Transaction Management in Database Management System
Transaction Management in Database Management SystemTransaction Management in Database Management System
Transaction Management in Database Management SystemChristalin Nelson
 

Dernier (20)

Mattingly "AI & Prompt Design: Large Language Models"
Mattingly "AI & Prompt Design: Large Language Models"Mattingly "AI & Prompt Design: Large Language Models"
Mattingly "AI & Prompt Design: Large Language Models"
 
ESP 4-EDITED.pdfmmcncncncmcmmnmnmncnmncmnnjvnnv
ESP 4-EDITED.pdfmmcncncncmcmmnmnmncnmncmnnjvnnvESP 4-EDITED.pdfmmcncncncmcmmnmnmncnmncmnnjvnnv
ESP 4-EDITED.pdfmmcncncncmcmmnmnmncnmncmnnjvnnv
 
Scientific Writing :Research Discourse
Scientific  Writing :Research  DiscourseScientific  Writing :Research  Discourse
Scientific Writing :Research Discourse
 
Q-Factor General Quiz-7th April 2024, Quiz Club NITW
Q-Factor General Quiz-7th April 2024, Quiz Club NITWQ-Factor General Quiz-7th April 2024, Quiz Club NITW
Q-Factor General Quiz-7th April 2024, Quiz Club NITW
 
How to Make a Duplicate of Your Odoo 17 Database
How to Make a Duplicate of Your Odoo 17 DatabaseHow to Make a Duplicate of Your Odoo 17 Database
How to Make a Duplicate of Your Odoo 17 Database
 
Indexing Structures in Database Management system.pdf
Indexing Structures in Database Management system.pdfIndexing Structures in Database Management system.pdf
Indexing Structures in Database Management system.pdf
 
31 ĐỀ THI THỬ VÀO LỚP 10 - TIẾNG ANH - FORM MỚI 2025 - 40 CÂU HỎI - BÙI VĂN V...
31 ĐỀ THI THỬ VÀO LỚP 10 - TIẾNG ANH - FORM MỚI 2025 - 40 CÂU HỎI - BÙI VĂN V...31 ĐỀ THI THỬ VÀO LỚP 10 - TIẾNG ANH - FORM MỚI 2025 - 40 CÂU HỎI - BÙI VĂN V...
31 ĐỀ THI THỬ VÀO LỚP 10 - TIẾNG ANH - FORM MỚI 2025 - 40 CÂU HỎI - BÙI VĂN V...
 
MS4 level being good citizen -imperative- (1) (1).pdf
MS4 level   being good citizen -imperative- (1) (1).pdfMS4 level   being good citizen -imperative- (1) (1).pdf
MS4 level being good citizen -imperative- (1) (1).pdf
 
Beauty Amidst the Bytes_ Unearthing Unexpected Advantages of the Digital Wast...
Beauty Amidst the Bytes_ Unearthing Unexpected Advantages of the Digital Wast...Beauty Amidst the Bytes_ Unearthing Unexpected Advantages of the Digital Wast...
Beauty Amidst the Bytes_ Unearthing Unexpected Advantages of the Digital Wast...
 
BIOCHEMISTRY-CARBOHYDRATE METABOLISM CHAPTER 2.pptx
BIOCHEMISTRY-CARBOHYDRATE METABOLISM CHAPTER 2.pptxBIOCHEMISTRY-CARBOHYDRATE METABOLISM CHAPTER 2.pptx
BIOCHEMISTRY-CARBOHYDRATE METABOLISM CHAPTER 2.pptx
 
Unraveling Hypertext_ Analyzing Postmodern Elements in Literature.pptx
Unraveling Hypertext_ Analyzing  Postmodern Elements in  Literature.pptxUnraveling Hypertext_ Analyzing  Postmodern Elements in  Literature.pptx
Unraveling Hypertext_ Analyzing Postmodern Elements in Literature.pptx
 
4.16.24 21st Century Movements for Black Lives.pptx
4.16.24 21st Century Movements for Black Lives.pptx4.16.24 21st Century Movements for Black Lives.pptx
4.16.24 21st Century Movements for Black Lives.pptx
 
Faculty Profile prashantha K EEE dept Sri Sairam college of Engineering
Faculty Profile prashantha K EEE dept Sri Sairam college of EngineeringFaculty Profile prashantha K EEE dept Sri Sairam college of Engineering
Faculty Profile prashantha K EEE dept Sri Sairam college of Engineering
 
Expanded definition: technical and operational
Expanded definition: technical and operationalExpanded definition: technical and operational
Expanded definition: technical and operational
 
prashanth updated resume 2024 for Teaching Profession
prashanth updated resume 2024 for Teaching Professionprashanth updated resume 2024 for Teaching Profession
prashanth updated resume 2024 for Teaching Profession
 
DIFFERENT BASKETRY IN THE PHILIPPINES PPT.pptx
DIFFERENT BASKETRY IN THE PHILIPPINES PPT.pptxDIFFERENT BASKETRY IN THE PHILIPPINES PPT.pptx
DIFFERENT BASKETRY IN THE PHILIPPINES PPT.pptx
 
4.9.24 School Desegregation in Boston.pptx
4.9.24 School Desegregation in Boston.pptx4.9.24 School Desegregation in Boston.pptx
4.9.24 School Desegregation in Boston.pptx
 
Tree View Decoration Attribute in the Odoo 17
Tree View Decoration Attribute in the Odoo 17Tree View Decoration Attribute in the Odoo 17
Tree View Decoration Attribute in the Odoo 17
 
4.11.24 Poverty and Inequality in America.pptx
4.11.24 Poverty and Inequality in America.pptx4.11.24 Poverty and Inequality in America.pptx
4.11.24 Poverty and Inequality in America.pptx
 
Transaction Management in Database Management System
Transaction Management in Database Management SystemTransaction Management in Database Management System
Transaction Management in Database Management System
 

Jarvis Collegiate Institute Gr 9 - 12 - EQAO Board Report

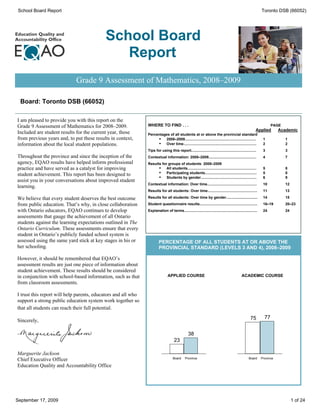
  • 1. School Board Report Toronto DSB (66052) School Board Report Grade 9 Assessment of Mathematics, 2008–2009 Board: Toronto DSB (66052) I am pleased to provide you with this report on the Grade 9 Assessment of Mathematics for 2008–2009. WHERE TO FIND . . . PAGE Applied Academic Included are student results for the current year, those Percentages of all students at or above the provincial standard from previous years and, to put these results in context, · 2008–2009...................................................................... 1 1 information about the local student populations. · Over time........................................................................ 2 2 Tips for using this report................................................................ 3 3 Throughout the province and since the inception of the Contextual information: 2008–2009............................................... 4 7 agency, EQAO results have helped inform professional Results for groups of students: 2008–2009 practice and have served as a catalyst for improving · All students.................................................................... 5 8 · Participating students................................................... 5 8 student achievement. This report has been designed to · Students by gender....................................................... 6 9 assist you in your conversations about improved student Contextual information: Over time................................................. 10 12 learning. Results for all students: Over time................................................. 11 13 We believe that every student deserves the best outcome Results for all students: Over time by gender............................... 14 15 from public education. That’s why, in close collaboration Student questionnaire results......................................................... 16–19 20–23 with Ontario educators, EQAO continues to develop Explanation of terms........................................................................ 24 24 assessments that gauge the achievement of all Ontario students against the learning expectations outlined in The Ontario Curriculum. These assessments ensure that every student in Ontario’s publicly funded school system is assessed using the same yard stick at key stages in his or PERCENTAGE OF ALL STUDENTS AT OR ABOVE THE her schooling. PROVINCIAL STANDARD (LEVELS 3 AND 4), 2008–2009 However, it should be remembered that EQAO’s assessment results are just one piece of information about student achievement. These results should be considered in conjunction with school-based information, such as that APPLIED COURSE ACADEMIC COURSE from classroom assessments. I trust this report will help parents, educators and all who support a strong public education system work together so that all students can reach their full potential. 75 77 Sincerely, 38 23 Marguerite Jackson Board Province Board Province Chief Executive Officer Education Quality and Accountability Office September 17, 2009 1 of 24
  • 2. School Board Report Toronto DSB (66052) Grade 9 Assessment of Mathematics, 2008–2009 PERCENTAGE OF ALL STUDENTS AT OR ABOVE THE PROVINCIAL STANDARD (LEVELS 3 AND 4) OVER TIME APPLIED MATHEMATICS* Board Province 35 35 34 38 23 27 15 20 17 19 2004–2005 2005–2006 2006–2007 2007–2008 2008–2009 Total Number of Students 2004–2005 2005–2006 2006–2007 2007–2008 2008–2009 Board 6 334 6 551 6 228 5 894 6 356 Province 51 155 50 687 49 056 47 817 48 482 * Note that significant revisions were made to applied courses in 2005 as reflected in The Ontario Curriculum, Grades 9 and 10: Mathematics (revised 2005). ACADEMIC MATHEMATICS Board Province 72 75 75 77 65 65 66 68 71 71 2004–2005 2005–2006 2006–2007 2007–2008 2008–2009 Total Number of Students 2004–2005 2005–2006 2006–2007 2007–2008 2008–2009 Board 13 624 13 690 13 528 13 329 13 279 Province 104 100 103 412 103 011 100 823 100 992 September 17, 2009 2 of 24
  • 3. School Board Report Toronto DSB (66052) TIPS ABOUT THIS SCHOOL OR BOARD REPORT The applied and academic This report shows how well students have met curriculum expectations for either the mathematics courses are applied or academic mathematics program to the end of Grade 9. Students complete two different and should be booklets that allow them to show what they know in mathematics. The assessment is considered separately. based on The Ontario Curriculum: Mathematics, Grades 9 and 10. Note: Students in locally developed courses do not participate in these This report includes assessments. ¨ results for this year; – ¨ a comparison of results over the past four years to aid in monitoring Each school or board is improvement and unique. To appreciate the distinctive character of a ¨ information about the characteristics of the students who participated. school or board, look at the contextual information to understand the features and Specifically, you will find characteristics of the ¨ summary graphs showing the percentage of students achieving the provincial community it serves. standard in either applied or academic mathematics; – ¨ detailed tables and graphs showing results for all levels of achievement, This assessment captures participation information and results for gender the performance of students ¨ student questionnaire results and at one point in time each year. Consider the results ¨ an explanation of all terms used in this report. along with other information about students’ achievement in mathematics. – HOW TO USE THIS REPORT Exercise caution when interpreting results for small ¨ Examine the contextual information to understand the similarities and differences schools or boards. Results between this school, the board and the province; the board and the province. may vary considerably from Consider the challenges that any differences might present. year to year, and differences may look exaggerated. For example, in a school of 30 ¨ Examine the results for applied and academic mathematics. students, a difference of 10% · Are these results consistent with what you would expect? represents only three students. · How do the school results compare to the board and province; the board results compare to the province? – Trends may be difficult to · How do these results compare over time? Note that significant revisions identify or to interpret. This is were made to applied courses in 2005 as reflected in The Ontario especially true when groups Curriculum, Grades 9 and 10: Mathematics (revised 2005). are small or in schools where · What influence might students’ attitudes have on student performance (refer there is a high turnover in the student population. to the questionnaire results)? – ¨ Speak to the school or board staff about the goals for school improvement related EQAO values students’ privacy. Results are not to mathematics. reported publicly for schools The Education Quality and Accountability Office is an independent agency that gathers information where fewer than 15 about student achievement through province-wide assessments. Each year, all Grade 9 students in students participated, applied and academic mathematics take part in this assessment across Ontario. Individual results are because it might be possible reported to students and to parents and guardians. School, board and provincial results are released to identify individual publicly. students. Learn more about us at www.eqao.com. September 17, 2009 3 of 24
  • 4. School Board Report Toronto DSB (66052) Grade 9 Assessment of Mathematics, 2008–2009, Applied Course Contextual Information This information provides a context for interpreting the board’s applied mathematics course results. Board Province Enrolment Number of students in applied mathematics course 6 356 48 482 Number of classes with students in applied mathematics course 442 2 950 Number of schools with applied mathematics classes 99 715 Number Percent Number Percent Participation in the Assessment Students who participated in the assessment 5 496 86% 45 616 94% Participating students who received one or more 1 062 19% 9 374 21% accommodations* Participating students who received one or more special 363 7% 1 144 3% provisions* Students who did not complete any part of the assessment (no 860 14% 2 866 6% data)* Gender† Based on number of students enrolled Female 2 867 45% 21 752 45% Male 3 489 55% 26 730 55% Gender not specified 0 0% 0 0% Student Status† Based on number of students enrolled English language learners* 874 14% 2 532 5% Students with special needs (excluding gifted)* 2 078 33% 14 483 30% Semester/Full Year Based on number of students enrolled First-semester course 2 089 33% 21 964 45% Second-semester course 2 037 32% 21 765 45% Full-year course 2 230 35% 4 753 10% †† Language and School Background Based on Student Questionnaire data Number of Respondents: 5 065 43 413 Speak only or mostly a language other than English at home 744 15% 2 757 6% Speak another language as often as English at home 1 068 21% 4 980 11% Attended three or more elementary schools from kindergarten to 2 031 40% 17 179 40% Grade 8 * See the Explanation of Terms. † Contextual data pertaining to “gender” and “student status” are provided by schools and/or boards through the Student Data Collection process. Some data may be missing because they were not provided by the school or the board. †† Contextual data pertaining to “school background” and “language” are gathered from the Student Questionnaire completed by students. Some data may be missing because they were not provided by the students. September 17, 2009 4 of 24
  • 5. School Board Report Toronto DSB (66052) Grade 9 Assessment of Mathematics, 2008–2009, Applied Course Results for All Students All Students* Percentage of All Students in Applied Mathematics Board Province Course at All Levels* Number of Students 6 356 48 482 # % % Level 4 193 3% 5% Level 3 1 271 20% 33% Level 2 1 894 30% 35% Level 1 1 217 19% 14% 35 33 Below Level 1 921 14% 7% 30 19 20 Participating 14 14 5 496 86% 94% 7 Students 3 5 No Data 860 14% 6% Below L1 Level 1 Level 2 Level 3 Level 4 At or Above Provincial Standard 23% 38% Board Province (Levels 3 and 4) † Results for Participating Students (excludes "no data" category) Participating Students** Percentage of Participating Students in Applied Mathematics Board Province Course at All Levels** Number of Students 5 496 45 616 # % % Level 4 193 4% 6% Level 3 1 271 23% 35% Level 2 1 894 34% 38% Level 1 1 217 22% 15% 34 38 35 Below Level 1 921 17% 7% 22 23 At or Above 17 15 Provincial Standard 27% 40% 7 4 6 (Levels 3 and 4) † Below L1 Level 1 Level 2 Level 3 Level 4 Board Province * Because percentages in tables and graphs are rounded, and because graphs do not show all reporting categories, percentages may not add to 100. ** Because percentages in tables and graphs are rounded, percentages may not add to 100. † These percentages are based on the actual number of students and cannot be calculated simply by adding the rounded percentages of students at Levels 3 and 4. September 17, 2009 5 of 24
  • 6. School Board Report Toronto DSB (66052) Grade 9 Assessment of Mathematics, 2008–2009, Applied Course Results by Gender†† All Students: Board by Gender* Percentage of All Students in Applied Female Male Mathematics Course at All Levels by Gender: Board* Number of Students 2 867 3 489 # % # % Level 4 72 3% 121 3% Level 3 535 19% 736 21% Level 2 886 31% 1 008 29% Level 1 578 20% 639 18% Below Level 1 399 14% 522 15% 31 29 20 18 19 21 Participating 14 15 2 470 86% 3 026 87% Students 3 3 No Data 397 14% 463 13% At or Above Below L1 Level 1 Level 2 Level 3 Level 4 Provincial Standard 21% 25% (Levels 3 and 4) † Female Male All Students: Province by Gender* Percentage of All Students in Applied Female Male Mathematics Course at All Levels by Gender: Province* Number of Students 21 752 26 730 # % # % Level 4 897 4% 1 618 6% Level 3 6 581 30% 9 308 35% Level 2 8 152 37% 8 965 34% Level 1 3 337 15% 3 543 13% 37 34 35 Below Level 1 1 438 7% 1 777 7% 30 Participating 15 13 20 405 94% 25 211 94% 7 7 6 Students 4 No Data 1 347 6% 1 519 6% At or Above Below L1 Level 1 Level 2 Level 3 Level 4 Provincial Standard 34% 41% (Levels 3 and 4) † Female Male * Because percentages in tables and graphs are rounded, and because graphs do not show all reporting categories, percentages may not add to 100. † These percentages are based on the actual number of students and cannot be calculated simply by adding the rounded percentages of students at Levels 3 and 4. †† Includes only students for whom gender data were available. September 17, 2009 6 of 24
  • 7. School Board Report Toronto DSB (66052) Grade 9 Assessment of Mathematics, 2008–2009, Academic Course Contextual Information This information provides a context for interpreting the board’s academic mathematics course results. Board Province Enrolment Number of students in academic mathematics course 13 279 100 992 Number of classes with students in academic mathematics 578 4 156 course Number of schools with academic mathematics classes 89 684 Number Percent Number Percent Participation in the Assessment Students who participated in the assessment 13 063 98% 100 060 99% Participating students who received one or more 398 3% 3 233 3% accommodations* Participating students who received one or more special 456 3% 1 709 2% provisions* Students who did not complete any part of the assessment (no 216 2% 932 1% data)* Gender† Based on number of students enrolled Female 6 499 49% 51 554 51% Male 6 780 51% 49 438 49% Gender not specified 0 0% 0 0% Student Status† Based on number of students enrolled English language learners* 1 093 8% 3 942 4% Students with special needs (excluding gifted)* 800 6% 4 639 5% Semester/Full Year Based on number of students enrolled First-semester course 2 659 20% 44 727 44% Second-semester course 3 115 23% 43 199 43% Full-year course 7 505 57% 13 066 13% Language and School Background†† Based on Student Questionnaire data Number of Respondents: 12 240 96 485 Speak only or mostly a language other than English at home 2 438 20% 8 689 9% Speak another language as often as English at home 3 192 26% 14 233 15% Attended three or more elementary schools from kindergarten to 4 769 39% 33 813 35% Grade 8 * See the Explanation of Terms. † Contextual data pertaining to “gender” and “student status” are provided by schools and/or boards through the Student Data Collection process. Some data may be missing because they were not provided by the school or the board. †† Contextual data pertaining to “school background” and “language” are gathered from the Student Questionnaire completed by students. Some data may be missing because they were not provided by the students. September 17, 2009 7 of 24
  • 8. School Board Report Toronto DSB (66052) Grade 9 Assessment of Mathematics, 2008–2009, Academic Course Results for All Students All Students* Percentage of All Students in Academic Mathematics Board Province Course at All Levels* Number of Students 13 279 100 992 # % % Level 4 1 490 11% 8% Level 3 8 434 64% 69% 69 64 Level 2 1 913 14% 15% Level 1 1 101 8% 6% Below Level 1 125 1% <1% Participating 14 15 11 13 063 98% 99% 8 8 Students 6 1 <1 No Data 216 2% 1% Below L1 Level 1 Level 2 Level 3 Level 4 At or Above Provincial Standard 75% 77% Board Province (Levels 3 and 4) † Results for Participating Students (excludes "no data" category) Participating Students** Percentage of Participating Students in Academic Mathematics Board Province Course at All Levels** Number of Students 13 063 100 060 # % % Level 4 1 490 11% 8% Level 3 8 434 65% 70% 70 65 Level 2 1 913 15% 15% Level 1 1 101 8% 6% Below Level 1 125 1% <1% At or Above 15 15 11 Provincial Standard 76% 78% 8 6 8 1 <1 (Levels 3 and 4) † Below L1 Level 1 Level 2 Level 3 Level 4 Board Province * Because percentages in tables and graphs are rounded, and because graphs do not show all reporting categories, percentages may not add to 100. ** Because percentages in tables and graphs are rounded, percentages may not add to 100. † These percentages are based on the actual number of students and cannot be calculated simply by adding the rounded percentages of students at Levels 3 and 4. September 17, 2009 8 of 24
  • 9. School Board Report Toronto DSB (66052) Grade 9 Assessment of Mathematics, 2008–2009, Academic Course Results by Gender†† All Students: Board by Gender* Percentage of All Students in Academic Female Male Mathematics Course at All Levels by Gender: Board* Number of Students 6 499 6 780 # % # % Level 4 641 10% 849 13% Level 3 4 077 63% 4 357 64% 63 64 Level 2 1 019 16% 894 13% Level 1 616 9% 485 7% Below Level 1 50 1% 75 1% Participating 16 13 13 6 403 99% 6 660 98% 9 7 10 Students 1 1 No Data 96 1% 120 2% At or Above Below L1 Level 1 Level 2 Level 3 Level 4 Provincial Standard 73% 77% (Levels 3 and 4) † Female Male All Students: Province by Gender* Percentage of All Students in Academic Female Male Mathematics Course at All Levels by Gender: Province* Number of Students 51 554 49 438 # % # % Level 4 3 530 7% 4 629 9% Level 3 35 048 68% 35 013 71% 68 71 Level 2 8 652 17% 6 476 13% Level 1 3 715 7% 2 615 5% Below Level 1 156 <1% 226 <1% Participating 17 13 51 101 99% 48 959 99% 7 5 7 9 Students <1 <1 No Data 453 1% 479 1% At or Above Below L1 Level 1 Level 2 Level 3 Level 4 Provincial Standard 75% 80% (Levels 3 and 4) † Female Male * Because percentages in tables and graphs are rounded, and because graphs do not show all reporting categories, percentages may not add to 100. † These percentages are based on the actual number of students and cannot be calculated simply by adding the rounded percentages of students at Levels 3 and 4. †† Includes only students for whom gender data were available. September 17, 2009 9 of 24
  • 10. School Board Report Toronto DSB (66052) Grade 9 Assessment of Mathematics, 2008–2009 Contextual Information over Time: Applied Mathematics Course This information provides a context for interpreting the board’s results over the past five years. 2004–2005 2005–2006 2006–2007 2007–2008 2008–2009 Enrolment Number of students in applied mathematics course 6 334 6 551 6 228 5 894 6 356 Number of classes with students in applied mathematics course 368 420 421 401 442 Number of schools with applied mathematics classes 84 96 96 96 99 Participation in the Assessment Students who participated in the assessment 85% 79% 80% 86% 86% Participating students who received one or more 18% 12% 14% 19% 19% accommodations* Participating students who received one or more special 7% 4% 5% 6% 7% provisions* Students who did not complete any part of the assessment (no 11% 17% 20% 14% 14% data)* Students who were exempted* 4% 4% ---ÌÌ --- --- Gender† Based on number of students enrolled Female 42% 45% 45% 44% 45% Male 54% 55% 55% 56% 55% Gender not specified 3% 0% <1% 0% 0% Student Status† Based on number of students enrolled English language learners* 11% 15% 15% 15% 14% Students with special needs (excluding gifted)* 22% 26% 29% 33% 33% Semester/Full Year Based on number of students enrolled First-semester course 33% 34% 33% 34% 33% Second-semester course 31% 34% 36% 34% 32% Full-year course 36% 32% 31% 32% 35% †† Language and School Background Based on Student Questionnaire data Number of Respondents: n/a n/a 4 626 4 723 5 065 Speak only or mostly a language other than English at home 15% 16% 15% Speak another language as often as English at home Information not available 21% 22% 21% Attended three or more elementary schools from kindergarten to 41% 42% 40% Grade 8 * See the Explanation of Terms. † Contextual data pertaining to “gender” and “student status” are provided by schools and/or boards through the Student Data Collection process. Some data may be missing because they were not provided by the school or the board. ÌÌ Beginning in 2006–2007, exemptions have not been permitted. †† Contextual data pertaining to “school background” and “language” are gathered from the Student Questionnaire completed by students. Some data may be missing because they were not provided by the students. n/a Information not available. September 17, 2009 10 of 24
  • 11. School Board Report Toronto DSB (66052) Results over Time, 2005–2006 to 2008–2009 Applied Mathematics Course for All Students** Board* Percentage of All Students in Year '05–'06 '06–'07 '07–'08 '08–'09 Applied Mathematics Course at All Levels: Board* Number of Students 6 551 6 228 5 894 6 356 Level 4 2% 2% 3% 3% Level 3 17% 15% 16% 20% Level 2 28% 29% 30% 30% Level 1 17% 18% 20% 19% Below Level 1 15% 16% 17% 14% 28 29 30 30 Participating Students 79% 80% 86% 86% 15 16 17 14 17 18 20 19 17 15 16 20 No Data 17% 20% 14% 14% 2 2 3 3 ExemptÌ 4% --- --- --- Below L1 Level 1 Level 2 Level 3 Level 4 At or Above Provincial Standard 20% 17% 19% 23% (Levels 3 and 4)† 2005–2006 2006–2007 2007–2008 2008–2009 Province* Percentage of All Students in Year '05–'06 '06–'07 '07–'08 '08–'09 Applied Mathematics Course at All Levels: Province* Number of Students 50 687 49 056 47 817 48 482 Level 4 5% 5% 5% 5% Level 3 31% 30% 29% 33% Level 2 34% 36% 36% 35% Level 1 14% 14% 15% 14% Below Level 1 7% 7% 8% 7% 34 36 36 35 31 30 29 33 Participating Students 90% 91% 93% 94% 15 14 14 14 7 7 8 7 No Data 8% 9% 7% 6% 5 5 5 5 ExemptÌ 2% --- --- --- Below L1 Level 1 Level 2 Level 3 Level 4 At or Above Provincial Standard 35% 35% 34% 38% (Levels 3 and 4)† 2005–2006 2006–2007 2007–2008 2008–2009 * Because percentages in tables and graphs are rounded, and because graphs do not show all reporting categories, percentages may not add to 100. ** Note that significant revisions were made to applied courses in 2005 as reflected in The Ontario Curriculum, Grades 9 and 10: Mathematics (revised 2005). † These percentages are based on the actual number of students and cannot be calculated simply by adding the rounded percentages of students at Levels 3 and 4. Ì In 2006–2007, students who were coded “exempt” were placed in the “no data” category. Since this may affect the percentage of students for whom no data are available, the results may not be comparable with those of previous years. September 17, 2009 11 of 24
  • 12. School Board Report Toronto DSB (66052) Grade 9 Assessment of Mathematics, 2008–2009 Contextual Information over Time: Academic Mathematics Course This information provides a context for interpreting the board’s results over the past five years. 2004–2005 2005–2006 2006–2007 2007–2008 2008–2009 Enrolment Number of students in academic mathematics course 13 624 13 690 13 528 13 329 13 279 Number of classes with students in academic mathematics 542 565 557 568 578 course Number of schools with academic mathematics classes 82 90 86 88 89 Participation in the Assessment Students who participated in the assessment 98% 96% 97% 98% 98% Participating students who received one or more 3% 2% 2% 3% 3% accommodations* Participating students who received one or more special 4% 2% 3% 3% 3% provisions* Students who did not complete any part of the assessment (no 2% 3% 3% 2% 2% data)* Students who were exempted* 1% 1% ---ÌÌ --- --- Gender† Based on number of students enrolled Female 48% 50% 50% 49% 49% Male 49% 50% 50% 51% 51% Gender not specified 3% 0% <1% 0% 0% Student Status† Based on number of students enrolled English language learners* 7% 9% 9% 8% 8% Students with special needs (excluding gifted)* 4% 5% 5% 6% 6% Semester/Full Year Based on number of students enrolled First-semester course 21% 21% 21% 23% 20% Second-semester course 22% 23% 24% 23% 23% Full-year course 57% 56% 55% 55% 57% Language and School Background†† Based on Student Questionnaire data Number of Respondents: n/a n/a 12 458 12 482 12 240 Speak only or mostly a language other than English at home 20% 20% 20% Speak another language as often as English at home Information not available 25% 26% 26% Attended three or more elementary schools from kindergarten to 40% 40% 39% Grade 8 * See the Explanation of Terms. † Contextual data pertaining to “gender” and “student status” are provided by schools and/or boards through the Student Data Collection process. Some data may be missing because they were not provided by the school or the board. ÌÌ Beginning in 2006–2007, exemptions have not been permitted. †† Contextual data pertaining to “school background” and “language” are gathered from the Student Questionnaire completed by students. Some data may be missing because they were not provided by the students. n/a Information not available. September 17, 2009 12 of 24
  • 13. School Board Report Toronto DSB (66052) Results over Time, 2005–2006 to 2008–2009 Academic Mathematics Course for All Students Board* Percentage of All Students in Year '05–'06 '06–'07 '07–'08 '08–'09 Academic Mathematics Course at All Levels: Board* Number of Students 13 690 13 528 13 329 13 279 Level 4 7% 10% 11% 11% Level 3 58% 56% 61% 64% 64 Level 2 16% 17% 15% 14% 58 56 61 Level 1 12% 12% 10% 8% Below Level 1 2% 2% 1% 1% Participating Students 96% 97% 98% 98% 16 17 15 12 12 14 10 10 11 11 8 7 No Data 3% 3% 2% 2% 2 2 1 1 ExemptÌ 1% --- --- --- Below L1 Level 1 Level 2 Level 3 Level 4 At or Above Provincial Standard 65% 66% 72% 75% (Levels 3 and 4)† 2005–2006 2006–2007 2007–2008 2008–2009 Province* Percentage of All Students in Year '05–'06 '06–'07 '07–'08 '08–'09 Academic Mathematics Course at All Levels: Province* Number of Students 103 412 103 011 100 823 100 992 Level 4 6% 6% 8% 8% Level 3 65% 64% 68% 69% 68 69 65 64 Level 2 17% 18% 16% 15% Level 1 9% 9% 7% 6% Below Level 1 1% 1% 1% <1% Participating Students 98% 98% 99% 99% 17 18 16 15 9 9 7 8 8 No Data 1% 2% 1% 1% 1 1 1 <1 6 6 6 ExemptÌ <1% --- --- --- Below L1 Level 1 Level 2 Level 3 Level 4 At or Above Provincial Standard 71% 71% 75% 77% (Levels 3 and 4)† 2005–2006 2006–2007 2007–2008 2008–2009 * Because percentages in tables and graphs are rounded, and because graphs do not show all reporting categories, percentages may not add to 100. † These percentages are based on the actual number of students and cannot be calculated simply by adding the rounded percentages of students at Levels 3 and 4. Ì In 2006–2007, students who were coded “exempt” were placed in the “no data” category. Since this may affect the percentage of students for whom no data are available, the results may not be comparable with those of previous years. September 17, 2009 13 of 24
  • 14. School Board Report Toronto DSB (66052) RESULTS FOR ALL STUDENTS OVER TIME BY GENDER† Percentage of Students At or Above the Provincial Standard (Levels 3 and 4): GRADE 9 APPLIED MATHEMATICS* 2004–2005 2005–2006 2006–2007 2007–2008 2008–2009 BOARD 21 25 16 20 19 18 17 18 20 14 PROVINCE 41 33 37 33 37 36 34 28 31 25 Female Male Total Number of Students in Applied Mathematics Course† 2004–2005 2005–2006 2006–2007 2007–2008 2008–2009 Female Male Female Male Female Male Female Male Female Male Board 2 688 3 439 2 927 3 624 2 773 3 451 2 591 3 303 2 867 3 489 Province 22 371 27 413 22 884 27 802 22 126 26 926 21 626 26 182 21 752 26 730 † Includes only students for whom gender data were available. * Note that significant revisions were made to applied courses in 2005 as reflected in The Ontario Curriculum, Grades 9 and 10: Mathematics (revised 2005). September 17, 2009 14 of 24
  • 15. School Board Report Toronto DSB (66052) RESULTS FOR ALL STUDENTS OVER TIME BY GENDER† Percentage of Students At or Above the Provincial Standard (Levels 3 and 4): GRADE 9 ACADEMIC MATHEMATICS 2004–2005 2005–2006 2006–2007 2007–2008 2008–2009 73 73 77 66 66 67 70 64 65 65 BOARD 77 80 72 72 74 75 67 69 70 69 PROVINCE Female Male Total Number of Students in Academic Mathematics Course† 2004–2005 2005–2006 2006–2007 2007–2008 2008–2009 Female Male Female Male Female Male Female Male Female Male Board 6 595 6 635 6 875 6 815 6 756 6 770 6 548 6 781 6 499 6 780 Province 52 030 50 129 53 183 50 228 52 887 50 122 51 367 49 452 51 554 49 438 † Includes only students for whom gender data were available. September 17, 2009 15 of 24
  • 16. School Board Report Toronto DSB (66052) Grade 9 Assessment of Mathematics, 2008–2009, Applied Course STUDENT QUESTIONNAIRE RESULTS FOR THIS BOARD (# = 5 065) Percentage of Students* Questionnaire Item 0 100 Number of Students Who 1. Degree to which students “agree” or “disagree” with each of the following statements: Answered “Strongly Agree or Agree” I like mathematics. 40 28 31 2 023 I am good at mathematics. 33 35 31 1 668 I understand most of the mathematics I am taught. 60 26 14 3 028 The mathematics I learn now is very useful for 47 27 25 2 398 everyday life. I need to keep taking mathematics for the kind of job I 47 30 22 2 377 want after I leave school. Mathematics is boring. 36 28 35 1 810 Mathematics is an easy subject. 20 30 49 1 019 Strongly agree or Disagree or Undecided agree strongly disagree Number of Students Who 2. How “easy” or “hard” students find mathematics questions that deal with the following: Answered “Very Easy or Easy” number sense (e.g., operations with integers, rational 46 34 18 2 348 numbers, exponents) algebra (e.g., solving equations, simplifying 41 29 28 2 094 expressions with polynomials) linear relations (e.g., scatter plots, lines of best fit) 57 27 15 2 869 measurement (e.g., perimeter, area, volume) 62 24 13 3 117 geometry (e.g., angles, parallel lines, quadrilaterals) 40 34 24 2 020 Very easy or easy Undecided Hard or very hard * Percentages may not add to 100, due to a lack of or ambiguous responses. Where there is no number in a box, the percentage of responses is smaller than 4. September 17, 2009 16 of 24
  • 17. School Board Report Toronto DSB (66052) Grade 9 Assessment of Mathematics, 2008–2009, Applied Course STUDENT QUESTIONNAIRE RESULTS FOR THIS BOARD (# = 5 065) Percentage of Students* Questionnaire Item 0 100 Number of Students Who 3. Students have the following at home to use for mathematics school work: Answered “Yes” a computer 49 49 2 495 a scientific calculator 75 23 3 794 a graphing calculator 14 83 733 Yes No Number of 4. Amount of time students usually spend on mathematics homework (in or out of school) on any given day: Students more than 45 minutes 16 809 between 31 and 45 minutes 24 1 201 30 minutes or less 41 2 071 mathematics homework not usually assigned 17 882 Number of 5. How often students complete all of their mathematics homework: Students never or seldom 15 779 sometimes 34 1 719 often or always 48 2 449 Number of 6. How often students have been absent from their Grade 9 mathematics class this year: Students never 14 713 one to four times 47 2 366 five to nine times 21 1 039 10 or more times 16 817 * Percentages may not add to 100, due to a lack of or ambiguous responses. Where there is no number in a box, the percentage of responses is smaller than 4. September 17, 2009 17 of 24
  • 18. School Board Report Toronto DSB (66052) Grade 9 Assessment of Mathematics, 2008–2009, Applied Course STUDENT QUESTIONNAIRE RESULTS FOR THIS BOARD (# = 5 065) Percentage of Students* Questionnaire Item 0 100 Number of 7. How often students have been late for their Grade 9 mathematics class this year: Students never 24 1 237 one to four times 36 1 801 five to nine times 18 902 10 or more times 19 987 Number of 8. Language(s) students speak at home: Students only or mostly English 62 3 134 another language (or other languages) as often as 21 1 068 English only or mostly another language (or other languages) 15 744 9. Number of elementary schools (kindergarten to Grade 8) attended: Number of Students one or two schools 57 2 886 three schools 20 995 four schools 10 514 five schools or more 10 522 * Percentages may not add to 100, due to a lack of or ambiguous responses. September 17, 2009 18 of 24
  • 19. School Board Report Toronto DSB (66052) Grade 9 Assessment of Mathematics, 2008–2009, Applied Course Board Province All Students All Students (# = 43 413) (# = 19 517) (# = 23 896) (# = 5 065) (# = 2 292) (# = 2 773) Female* Female* STUDENT QUESTIONNAIRE RESULTS Male* Male* FOR BOARD AND PROVINCE (all students, female, male) Percentage of students indicating that they “strongly agree” or “agree” with each of the following statements: I like mathematics. 40% 33% 46% 36% 30% 42% I am good at mathematics. 33% 26% 39% 36% 28% 43% I understand most of the mathematics I am taught. 60% 57% 62% 63% 59% 66% The mathematics I learn now is very useful for everyday life. 47% 46% 48% 42% 39% 44% I need to keep taking mathematics for the kind of job I want 47% 45% 49% 43% 39% 46% after I leave school. Mathematics is boring. 36% 38% 34% 42% 44% 41% Mathematics is an easy subject. 20% 15% 24% 22% 17% 27% Percentage of students indicating that the following are “very easy” or “easy”: number sense 46% 42% 50% 47% 43% 50% algebra 41% 41% 42% 43% 44% 43% linear relations 57% 57% 57% 64% 63% 64% measurement 62% 61% 62% 66% 65% 67% geometry 40% 37% 42% 41% 36% 45% Percentage of students indicating they have the following at home to use for mathematics school work: a computer 49% 50% 48% 45% 46% 44% a scientific calculator 75% 80% 71% 75% 79% 73% a graphing calculator 14% 13% 15% 10% 8% 11% Percentage of students indicating they usually spend the following amounts of time on mathematics homework (in or out of school) on any given day:** 30 minutes or less 41% 38% 43% 46% 44% 47% more than 30 minutes 40% 43% 37% 34% 38% 31% mathematics homework not usually assigned 17% 17% 18% 19% 17% 21% Percentage of students indicating they complete all of their mathematics homework** never or seldom. 15% 12% 18% 16% 13% 19% sometimes. 34% 34% 34% 31% 31% 31% often or always. 48% 51% 46% 51% 55% 48% Percentage of students indicating they have been absent from their mathematics class this year** four times or less. 61% 61% 61% 60% 58% 61% five times or more. 37% 37% 36% 39% 41% 38% Percentage of students indicating how often they have been late for their mathematics class this year** four times or less. 60% 62% 59% 69% 69% 68% five times or more. 37% 36% 39% 30% 29% 30% Percentage of students indicating that they speak the following language(s) at home:** only or mostly English 62% 63% 61% 81% 81% 81% another language (or other languages) as often as English 21% 22% 20% 11% 12% 11% only or mostly another language (or other languages) 15% 12% 17% 6% 6% 7% Percentage of students indicating that from kindergarten to Grade 8 they attended three or more elementary schools. 40% 41% 39% 40% 40% 39% * Includes only students for whom gender data were available. ** Percentages may not add to 100, due to a lack of or ambiguous responses. September 17, 2009 19 of 24
  • 20. School Board Report Toronto DSB (66052) Grade 9 Assessment of Mathematics, 2008–2009, Academic Course STUDENT QUESTIONNAIRE RESULTS FOR THIS BOARD (# = 12 240) Percentage of Students* Questionnaire Item 0 100 Number of Students Who 1. Degree to which students “agree” or “disagree” with each of the following statements: Answered “Strongly Agree or Agree” I like mathematics. 58 23 19 7 118 I am good at mathematics. 51 30 18 6 292 I understand most of the mathematics I am taught. 72 18 9 8 859 The mathematics I learn now is very useful for 42 31 27 5 108 everyday life. I need to keep taking mathematics for the kind of job I 58 29 12 7 107 want after I leave school. Mathematics is boring. 27 28 45 3 263 Mathematics is an easy subject. 30 29 40 3 685 Strongly agree or Disagree or Undecided agree strongly disagree Number of Students Who 2. How “easy” or “hard” students find mathematics questions that deal with the following: Answered “Very Easy or Easy” number sense (e.g., operations with integers, rational 69 21 9 8 401 numbers, exponents) algebra (e.g., solving equations, simplifying 65 19 15 7 901 expressions with polynomials) linear relations (e.g., scatter plots, lines of best fit) 47 29 22 5 745 analytic geometry (e.g., slope, y-intercept, equations of 45 24 29 5 553 lines) measurement (e.g., perimeter, area, volume) 75 16 7 9 190 geometry (e.g., angles, parallel lines, quadrilaterals) 63 22 13 7 758 Very easy or easy Undecided Hard or very hard * Percentages may not add to 100, due to a lack of or ambiguous responses. Where there is no number in a box, the percentage of responses is smaller than 4. September 17, 2009 20 of 24
  • 21. School Board Report Toronto DSB (66052) Grade 9 Assessment of Mathematics, 2008–2009, Academic Course STUDENT QUESTIONNAIRE RESULTS FOR THIS BOARD (# = 12 240) Percentage of Students* Questionnaire Item 0 100 Number of Students Who 3. Students have the following at home to use for mathematics school work: Answered “Yes” a computer 59 39 7 264 a scientific calculator 87 11 10 654 a graphing calculator 13 85 1 536 Yes No Number of 4. Amount of time students usually spend on mathematics homework (in or out of school) on any given day: Students more than 45 minutes 24 2 978 between 31 and 45 minutes 34 4 189 30 minutes or less 36 4 415 mathematics homework not usually assigned 3 389 Number of 5. How often students complete all of their mathematics homework: Students never or seldom 14 1 669 sometimes 26 3 134 often or always 58 7 141 Number of 6. How often students have been absent from their Grade 9 mathematics class this year: Students never 19 2 353 one to four times 56 6 842 five to nine times 16 1 943 10 or more times 6 782 * Percentages may not add to 100, due to a lack of or ambiguous responses. Where there is no number in a box, the percentage of responses is smaller than 4. September 17, 2009 21 of 24