SlideShare une entreprise Scribd logo
1  sur  17
Télécharger pour lire hors ligne
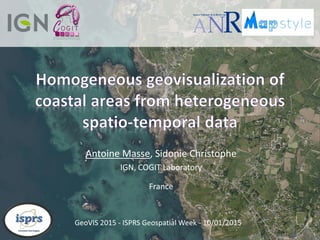
Antoine Masse, Sidonie Christophe
IGN, COGIT Laboratory
France
GeoVIS 2015 - ISPRS Geospatial Week - 10/01/2015
GeoVIS 2015 - ISPRS Geospatial Week - 10/01/2015 2
• Coastal area
Between highest astronomical tide (shoreline)
and lowest astronomical tide (drying line)
• Spatio-temporal objects & phenomena
• Uncertainty: in motion (tides, sands)
• Incompleteness of data: underwater observation problems
• Imprecision: different definitions of an object at different scale
Sea/Land interface
ShorelineDrying line
Point Reyes, California
Red : DTM data (res. 1m, prec. 0,2m)
Yellow : 1:15,000 topomap
Blue : 1:50,000 topomap
Motivation: coastal area geovisualization
Different Shoreline definition
3
Different uses & users  Different geovis
Limitations:
 Visual discontinuities and heterogeneity
between sea & land
 Perception of tides and/or water depth
for non-specialist users
C-Map®, navigation software
ScanLittoral®, Touristic/Public map
Interactive elevation simulation of lake Erie, USA (NOAA)
Ortho-image of La Grande Motte, Google Maps®
Ocean seafloor map of Hawai'i
GeoVIS 2015 - ISPRS Geospatial Week - 10/01/2015
Motivation: coastal area
geovisualization
Purpose of the talk
4
• To convey sea dynamic information to users
Example of tide dynamic for informational purposes
• Hypothesis:
– Using heterogeneous data (maps, ortho-imagery,
LiDAR)…
– … to make homogeneous visualizations between
sea & land
– … by controlling photo-realism/abstraction
– … to convey tides & water depth perception
GeoVIS 2015 - ISPRS Geospatial Week - 10/01/2015
Implementation
GeoVIS 2015 - ISPRS Geospatial Week - 10/01/2015 5
Lidar acquisition (land/sea)
SHOM
0
5
10
Water elevation (in meters)
Tidal data, REFMAR® project
DTM (land/sea)
SHOM
Resolution: 1m/5m (land/sea)
Vertical precision: 0.2m/0.5m (land/sea)
Style
Rendering Engine Final
Rendering
Perception
Geographic
feature
External
data
Visual
Variables
Inspiration sources Colors, …
Maps, ortho-imagery, …
Abstraction, ortho-image-realism
Proposition of
geovisualizations
6
GeoVIS 2015 - ISPRS Geospatial Week - 10/01/2015
4 examples for water depth visualization, static
and dynamic
Same data, different stylization of water depth:
- Abstraction maps
- (Ortho) photo-realism
0
5
10
Water elevation (in meters)
Data
Inspiration
7
Inspiration: Map abstraction (1:25,000)
Location: Lanildut, Finistère, France
Data: DTM: Litto3D OpenData
Tidal data: REFMAR OpenData
Cartographic database
Color map
1st example: perception of
water depth by intervals
Low tide
05/28/2009
14:00
Depth (m) 0 -5 -10 -20
Color
Uses:
Tourism, Hiking, Fishing
Issues:
≠ producers
≠ uses
no tidal information
(ex: accessibility of Ile de Melon)
GeoVIS 2015 - ISPRS Geospatial Week - 10/01/2015
High tide
05/28/2009
19:00
8
1st example: perception of water depth intervals
Time x4000
GeoVIS 2015 - ISPRS Geospatial Week - 10/01/2015
9
Inspiration: Map abstraction
2nd example:
continuous
perception of water
depth
Location: Lanildut, Finistère, France
Data: DTM: Litto3D OpenData
Tidal data: REFMAR OpenData
Cartographic database
Colormap (interpolated)
Low tide
05/28/2009
14:00
High tide
05/28/2009
19:00
GeoVIS 2015 - ISPRS Geospatial Week - 10/01/2015
Depth (m) 0 -5 -10 -20
Color
10
2nd example: continuous perception of water depth
Time x4000
GeoVIS 2015 - ISPRS Geospatial Week - 10/01/2015
11
Inspiration: Ortho-image photo-realism
Location: Lanildut, Finistère, France
Data: DTM: Litto3D OpenData
Tidal data: REFMAR OpenData
IGN BD Ortho (land part)
Colormap (interpolated)
3rd example: continuous water depth perception
Depth (m) 0 -5 -10 -20
Color
Uses:
Exploration, landscape survey, …
Issues:
Color gaps
Depth gaps
no tidal information
visualization of a specific tidal stage
Low tide
05/28/2009
14:00
High tide
05/28/2009
19:00
GeoVIS 2015 - ISPRS Geospatial Week - 10/01/2015
12
3rd example: water depth perception
Brightness +20%
Contrast +40%
Time x4000
GeoVIS 2015 - ISPRS Geospatial Week - 10/01/2015
13
Location: Vannes, Morbihan, France
Data: DTM: Litto3D® OpenData
Tidal data: REFMAR® OpenData
IGN BD Ortho® (land part)
Colormap (interpolated)
4th example: water depth perception
Depth (m) 0 -5 -10 -20
Color
Uses:
Exploration, landscape survey, …
Issues:
Sands
Sea infiltration at high tide High tide
03/21/2015
16:30
Low tide
03/21/2015
10:20
GeoVIS 2015 - ISPRS Geospatial Week - 10/01/2015
Inspiration: Ortho-image photorealism
14
4th example: water depth perception
Brightness +20%
Contrast +40%
Time x4000
GeoVIS 2015 - ISPRS Geospatial Week - 10/01/2015
Conclusion
GeoVIS 2015 - ISPRS Geospatial Week - 10/01/2015 15
Goal: Convey sea dynamic information to geovisualization users
Thoughts for coastal geovisualization:
• Important: Data precision and land/sea visual continuity
 improve water depth perception
• Static and dynamic visualization -> different use, complementary
• Abstraction/Photo-realism: same data, different stylization
16
- User Evaluation: uses and users?
• readability, handling, adaptation to specific use,
integration in final-user applications, etc.
• Task examples: How deep it is? When is it accessible?
- Tool adaptability
• Other data for validation
• Realism improvements
• With new data (ex: seafloor cover)
• With new stylization tools (expressive textures like
waves and sea stream, shaded relief)
Perspectives
Our method with other data
Carmel-by-the-sea, CA, USA
NOAA for DTM (sea) / Google Maps (land)
Shaded relief (Yu, 2005)
GeoVIS 2015 - ISPRS Geospatial Week - 10/01/2015Water texture
Thanks
17
mapstyle.ign.fr antoinemasse.froxygene-project.sourceforge.net/
nice software nice project nice speaker
GeoVIS 2015 - ISPRS Geospatial Week - 10/01/2015

Contenu connexe

En vedette

Géovisualisation de données géographiques hétérogènes entre abstraction et ph...
Géovisualisation de données géographiques hétérogènes entre abstraction et ph...Géovisualisation de données géographiques hétérogènes entre abstraction et ph...
Géovisualisation de données géographiques hétérogènes entre abstraction et ph...Charlotte Hoarau
 
Sliding from imagery realism to topographic abstraction
Sliding from imagery realism to topographic abstractionSliding from imagery realism to topographic abstraction
Sliding from imagery realism to topographic abstractionCharlotte Hoarau
 
Color and textures interpolation for homogeneous sliding between orthoimagery...
Color and textures interpolation for homogeneous sliding between orthoimagery...Color and textures interpolation for homogeneous sliding between orthoimagery...
Color and textures interpolation for homogeneous sliding between orthoimagery...GeoVIS'15 Workshop
 
Intégration de méthodes de rendu expressif dans un SIG
Intégration de méthodes de rendu expressif dans un SIGIntégration de méthodes de rendu expressif dans un SIG
Intégration de méthodes de rendu expressif dans un SIGSidonie Christophe
 
MapStyle: Automatic Rendering of a Cassini Style
MapStyle: Automatic Rendering of a Cassini StyleMapStyle: Automatic Rendering of a Cassini Style
MapStyle: Automatic Rendering of a Cassini StyleSidonie Christophe
 
MapStyle - Besoins et enjeux en cartographie
MapStyle - Besoins et enjeux en cartographieMapStyle - Besoins et enjeux en cartographie
MapStyle - Besoins et enjeux en cartographieSidonie Christophe
 

En vedette (6)

Géovisualisation de données géographiques hétérogènes entre abstraction et ph...
Géovisualisation de données géographiques hétérogènes entre abstraction et ph...Géovisualisation de données géographiques hétérogènes entre abstraction et ph...
Géovisualisation de données géographiques hétérogènes entre abstraction et ph...
 
Sliding from imagery realism to topographic abstraction
Sliding from imagery realism to topographic abstractionSliding from imagery realism to topographic abstraction
Sliding from imagery realism to topographic abstraction
 
Color and textures interpolation for homogeneous sliding between orthoimagery...
Color and textures interpolation for homogeneous sliding between orthoimagery...Color and textures interpolation for homogeneous sliding between orthoimagery...
Color and textures interpolation for homogeneous sliding between orthoimagery...
 
Intégration de méthodes de rendu expressif dans un SIG
Intégration de méthodes de rendu expressif dans un SIGIntégration de méthodes de rendu expressif dans un SIG
Intégration de méthodes de rendu expressif dans un SIG
 
MapStyle: Automatic Rendering of a Cassini Style
MapStyle: Automatic Rendering of a Cassini StyleMapStyle: Automatic Rendering of a Cassini Style
MapStyle: Automatic Rendering of a Cassini Style
 
MapStyle - Besoins et enjeux en cartographie
MapStyle - Besoins et enjeux en cartographieMapStyle - Besoins et enjeux en cartographie
MapStyle - Besoins et enjeux en cartographie
 

Similaire à Geovisualization of coastal areas from heterogeneous spatio-temporal data (Antoine Masse)

Nereus atene-rven - presentation 3 - 2014
Nereus   atene-rven - presentation 3 - 2014Nereus   atene-rven - presentation 3 - 2014
Nereus atene-rven - presentation 3 - 2014Silvano De Zorzi
 
Presentation - Adapting to a changing climate in the management of coastal zo...
Presentation - Adapting to a changing climate in the management of coastal zo...Presentation - Adapting to a changing climate in the management of coastal zo...
Presentation - Adapting to a changing climate in the management of coastal zo...OECD Environment
 
Inter-sensor comparison of lake surface temperatures derived from MODIS, AVHR...
Inter-sensor comparison of lake surface temperatures derived from MODIS, AVHR...Inter-sensor comparison of lake surface temperatures derived from MODIS, AVHR...
Inter-sensor comparison of lake surface temperatures derived from MODIS, AVHR...Sajid Pareeth
 
Citclops @ geo x, geneva 2014 01 15
Citclops @ geo x, geneva 2014 01 15Citclops @ geo x, geneva 2014 01 15
Citclops @ geo x, geneva 2014 01 15Luigi Ceccaroni
 
Seagrass mapping and monitoring along the coast of Crete, Greece. Mid-Term Pr...
Seagrass mapping and monitoring along the coast of Crete, Greece. Mid-Term Pr...Seagrass mapping and monitoring along the coast of Crete, Greece. Mid-Term Pr...
Seagrass mapping and monitoring along the coast of Crete, Greece. Mid-Term Pr...Universität Salzburg
 
Supervised classification and improved filtering method for shoreline detection.
Supervised classification and improved filtering method for shoreline detection.Supervised classification and improved filtering method for shoreline detection.
Supervised classification and improved filtering method for shoreline detection.Dr Amira Bibo
 
DSD-INT 2014 - Delft-FEWS Users Meeting - Welcome, Jaap Kwadijk, Deltares
DSD-INT 2014 - Delft-FEWS Users Meeting - Welcome, Jaap Kwadijk, DeltaresDSD-INT 2014 - Delft-FEWS Users Meeting - Welcome, Jaap Kwadijk, Deltares
DSD-INT 2014 - Delft-FEWS Users Meeting - Welcome, Jaap Kwadijk, DeltaresDeltares
 
Seagrass Mapping and Monitoring Along the Coasts of Crete, Greece
Seagrass Mapping and Monitoring Along the Coasts of Crete, GreeceSeagrass Mapping and Monitoring Along the Coasts of Crete, Greece
Seagrass Mapping and Monitoring Along the Coasts of Crete, GreeceUniversität Salzburg
 
EO - National - Stereo Success Story
EO - National - Stereo Success StoryEO - National - Stereo Success Story
EO - National - Stereo Success StorySpace-Applications
 
Snow Monitoring for Water Availability and Irrigation
Snow Monitoring for Water Availability and IrrigationSnow Monitoring for Water Availability and Irrigation
Snow Monitoring for Water Availability and IrrigationExtremeEarth
 
Gaucherand S. CEMAGREF, Tourism and wetland management
Gaucherand S. CEMAGREF, Tourism and wetland managementGaucherand S. CEMAGREF, Tourism and wetland management
Gaucherand S. CEMAGREF, Tourism and wetland managementRESTORE
 
Environmental gis gabon
Environmental gis gabonEnvironmental gis gabon
Environmental gis gabonTTI Production
 
Drought monitoring, Precipitation statistics, and water balance with freely a...
Drought monitoring, Precipitation statistics, and water balance with freely a...Drought monitoring, Precipitation statistics, and water balance with freely a...
Drought monitoring, Precipitation statistics, and water balance with freely a...AngelosAlamanos
 
Outputs and recommendations from the Baltic Sea-basin Checkpoint Workshop
Outputs and recommendations from the Baltic Sea-basin Checkpoint WorkshopOutputs and recommendations from the Baltic Sea-basin Checkpoint Workshop
Outputs and recommendations from the Baltic Sea-basin Checkpoint WorkshopEMODnet
 
Results of the EMODnet Sea-basin Checkpoints: geology
Results of the EMODnet Sea-basin Checkpoints: geologyResults of the EMODnet Sea-basin Checkpoints: geology
Results of the EMODnet Sea-basin Checkpoints: geologyEMODnet
 
DEM-based Methods for Flood Risk Mapping at Large Scale
DEM-based Methods for Flood Risk Mapping at Large ScaleDEM-based Methods for Flood Risk Mapping at Large Scale
DEM-based Methods for Flood Risk Mapping at Large ScaleSalvatore Manfreda
 
DSD-INT 2017 A stroll through the European marine data landscape the role of ...
DSD-INT 2017 A stroll through the European marine data landscape the role of ...DSD-INT 2017 A stroll through the European marine data landscape the role of ...
DSD-INT 2017 A stroll through the European marine data landscape the role of ...Deltares
 

Similaire à Geovisualization of coastal areas from heterogeneous spatio-temporal data (Antoine Masse) (20)

Nereus atene-rven - presentation 3 - 2014
Nereus   atene-rven - presentation 3 - 2014Nereus   atene-rven - presentation 3 - 2014
Nereus atene-rven - presentation 3 - 2014
 
Sea Level Rise: evidence and scenarios (BC3 Summer School _July 2015)
Sea Level Rise: evidence and scenarios (BC3 Summer School _July 2015)Sea Level Rise: evidence and scenarios (BC3 Summer School _July 2015)
Sea Level Rise: evidence and scenarios (BC3 Summer School _July 2015)
 
Presentation - Adapting to a changing climate in the management of coastal zo...
Presentation - Adapting to a changing climate in the management of coastal zo...Presentation - Adapting to a changing climate in the management of coastal zo...
Presentation - Adapting to a changing climate in the management of coastal zo...
 
Mapping UK Sea Space
Mapping UK Sea SpaceMapping UK Sea Space
Mapping UK Sea Space
 
Inter-sensor comparison of lake surface temperatures derived from MODIS, AVHR...
Inter-sensor comparison of lake surface temperatures derived from MODIS, AVHR...Inter-sensor comparison of lake surface temperatures derived from MODIS, AVHR...
Inter-sensor comparison of lake surface temperatures derived from MODIS, AVHR...
 
Citclops @ geo x, geneva 2014 01 15
Citclops @ geo x, geneva 2014 01 15Citclops @ geo x, geneva 2014 01 15
Citclops @ geo x, geneva 2014 01 15
 
Seagrass mapping and monitoring along the coast of Crete, Greece. Mid-Term Pr...
Seagrass mapping and monitoring along the coast of Crete, Greece. Mid-Term Pr...Seagrass mapping and monitoring along the coast of Crete, Greece. Mid-Term Pr...
Seagrass mapping and monitoring along the coast of Crete, Greece. Mid-Term Pr...
 
Supervised classification and improved filtering method for shoreline detection.
Supervised classification and improved filtering method for shoreline detection.Supervised classification and improved filtering method for shoreline detection.
Supervised classification and improved filtering method for shoreline detection.
 
DSD-INT 2014 - Delft-FEWS Users Meeting - Welcome, Jaap Kwadijk, Deltares
DSD-INT 2014 - Delft-FEWS Users Meeting - Welcome, Jaap Kwadijk, DeltaresDSD-INT 2014 - Delft-FEWS Users Meeting - Welcome, Jaap Kwadijk, Deltares
DSD-INT 2014 - Delft-FEWS Users Meeting - Welcome, Jaap Kwadijk, Deltares
 
Seagrass Mapping and Monitoring Along the Coasts of Crete, Greece
Seagrass Mapping and Monitoring Along the Coasts of Crete, GreeceSeagrass Mapping and Monitoring Along the Coasts of Crete, Greece
Seagrass Mapping and Monitoring Along the Coasts of Crete, Greece
 
EO - National - Stereo Success Story
EO - National - Stereo Success StoryEO - National - Stereo Success Story
EO - National - Stereo Success Story
 
Snow Monitoring for Water Availability and Irrigation
Snow Monitoring for Water Availability and IrrigationSnow Monitoring for Water Availability and Irrigation
Snow Monitoring for Water Availability and Irrigation
 
Gaucherand S. CEMAGREF, Tourism and wetland management
Gaucherand S. CEMAGREF, Tourism and wetland managementGaucherand S. CEMAGREF, Tourism and wetland management
Gaucherand S. CEMAGREF, Tourism and wetland management
 
Environmental gis gabon
Environmental gis gabonEnvironmental gis gabon
Environmental gis gabon
 
Drought monitoring, Precipitation statistics, and water balance with freely a...
Drought monitoring, Precipitation statistics, and water balance with freely a...Drought monitoring, Precipitation statistics, and water balance with freely a...
Drought monitoring, Precipitation statistics, and water balance with freely a...
 
Outputs and recommendations from the Baltic Sea-basin Checkpoint Workshop
Outputs and recommendations from the Baltic Sea-basin Checkpoint WorkshopOutputs and recommendations from the Baltic Sea-basin Checkpoint Workshop
Outputs and recommendations from the Baltic Sea-basin Checkpoint Workshop
 
Results of the EMODnet Sea-basin Checkpoints: geology
Results of the EMODnet Sea-basin Checkpoints: geologyResults of the EMODnet Sea-basin Checkpoints: geology
Results of the EMODnet Sea-basin Checkpoints: geology
 
DEM-based Methods for Flood Risk Mapping at Large Scale
DEM-based Methods for Flood Risk Mapping at Large ScaleDEM-based Methods for Flood Risk Mapping at Large Scale
DEM-based Methods for Flood Risk Mapping at Large Scale
 
DSD-INT 2017 A stroll through the European marine data landscape the role of ...
DSD-INT 2017 A stroll through the European marine data landscape the role of ...DSD-INT 2017 A stroll through the European marine data landscape the role of ...
DSD-INT 2017 A stroll through the European marine data landscape the role of ...
 
L012438186
L012438186L012438186
L012438186
 

Plus de GeoVIS'15 Workshop

Visualizing the Viewer (Clare Davies)
Visualizing the Viewer (Clare Davies)Visualizing the Viewer (Clare Davies)
Visualizing the Viewer (Clare Davies)GeoVIS'15 Workshop
 
Relief inversion effect in terrain representations: Where should we place the...
Relief inversion effect in terrain representations: Where should we place the...Relief inversion effect in terrain representations: Where should we place the...
Relief inversion effect in terrain representations: Where should we place the...GeoVIS'15 Workshop
 
Visualization of Marine Sand Dune Displacements utilizing Modern GPU Techniqu...
Visualization of Marine Sand Dune Displacements utilizing Modern GPU Techniqu...Visualization of Marine Sand Dune Displacements utilizing Modern GPU Techniqu...
Visualization of Marine Sand Dune Displacements utilizing Modern GPU Techniqu...GeoVIS'15 Workshop
 
From open geographical data to tangible maps: improving the accessibility of ...
From open geographical data to tangible maps: improving the accessibility of ...From open geographical data to tangible maps: improving the accessibility of ...
From open geographical data to tangible maps: improving the accessibility of ...GeoVIS'15 Workshop
 
A study on mental representations for realistic visualization. The particular...
A study on mental representations for realistic visualization. The particular...A study on mental representations for realistic visualization. The particular...
A study on mental representations for realistic visualization. The particular...GeoVIS'15 Workshop
 
GeoVIS'15 - Exploring the impact of visual complexity levels in 3D city model...
GeoVIS'15 - Exploring the impact of visual complexity levels in 3D city model...GeoVIS'15 - Exploring the impact of visual complexity levels in 3D city model...
GeoVIS'15 - Exploring the impact of visual complexity levels in 3D city model...GeoVIS'15 Workshop
 

Plus de GeoVIS'15 Workshop (6)

Visualizing the Viewer (Clare Davies)
Visualizing the Viewer (Clare Davies)Visualizing the Viewer (Clare Davies)
Visualizing the Viewer (Clare Davies)
 
Relief inversion effect in terrain representations: Where should we place the...
Relief inversion effect in terrain representations: Where should we place the...Relief inversion effect in terrain representations: Where should we place the...
Relief inversion effect in terrain representations: Where should we place the...
 
Visualization of Marine Sand Dune Displacements utilizing Modern GPU Techniqu...
Visualization of Marine Sand Dune Displacements utilizing Modern GPU Techniqu...Visualization of Marine Sand Dune Displacements utilizing Modern GPU Techniqu...
Visualization of Marine Sand Dune Displacements utilizing Modern GPU Techniqu...
 
From open geographical data to tangible maps: improving the accessibility of ...
From open geographical data to tangible maps: improving the accessibility of ...From open geographical data to tangible maps: improving the accessibility of ...
From open geographical data to tangible maps: improving the accessibility of ...
 
A study on mental representations for realistic visualization. The particular...
A study on mental representations for realistic visualization. The particular...A study on mental representations for realistic visualization. The particular...
A study on mental representations for realistic visualization. The particular...
 
GeoVIS'15 - Exploring the impact of visual complexity levels in 3D city model...
GeoVIS'15 - Exploring the impact of visual complexity levels in 3D city model...GeoVIS'15 - Exploring the impact of visual complexity levels in 3D city model...
GeoVIS'15 - Exploring the impact of visual complexity levels in 3D city model...
 

Dernier

Servosystem Theory / Cybernetic Theory by Petrovic
Servosystem Theory / Cybernetic Theory by PetrovicServosystem Theory / Cybernetic Theory by Petrovic
Servosystem Theory / Cybernetic Theory by PetrovicAditi Jain
 
Fertilization: Sperm and the egg—collectively called the gametes—fuse togethe...
Fertilization: Sperm and the egg—collectively called the gametes—fuse togethe...Fertilization: Sperm and the egg—collectively called the gametes—fuse togethe...
Fertilization: Sperm and the egg—collectively called the gametes—fuse togethe...D. B. S. College Kanpur
 
Citronella presentation SlideShare mani upadhyay
Citronella presentation SlideShare mani upadhyayCitronella presentation SlideShare mani upadhyay
Citronella presentation SlideShare mani upadhyayupadhyaymani499
 
Pests of jatropha_Bionomics_identification_Dr.UPR.pdf
Pests of jatropha_Bionomics_identification_Dr.UPR.pdfPests of jatropha_Bionomics_identification_Dr.UPR.pdf
Pests of jatropha_Bionomics_identification_Dr.UPR.pdfPirithiRaju
 
OECD bibliometric indicators: Selected highlights, April 2024
OECD bibliometric indicators: Selected highlights, April 2024OECD bibliometric indicators: Selected highlights, April 2024
OECD bibliometric indicators: Selected highlights, April 2024innovationoecd
 
User Guide: Magellan MX™ Weather Station
User Guide: Magellan MX™ Weather StationUser Guide: Magellan MX™ Weather Station
User Guide: Magellan MX™ Weather StationColumbia Weather Systems
 
trihybrid cross , test cross chi squares
trihybrid cross , test cross chi squarestrihybrid cross , test cross chi squares
trihybrid cross , test cross chi squaresusmanzain586
 
Pests of castor_Binomics_Identification_Dr.UPR.pdf
Pests of castor_Binomics_Identification_Dr.UPR.pdfPests of castor_Binomics_Identification_Dr.UPR.pdf
Pests of castor_Binomics_Identification_Dr.UPR.pdfPirithiRaju
 
Observational constraints on mergers creating magnetism in massive stars
Observational constraints on mergers creating magnetism in massive starsObservational constraints on mergers creating magnetism in massive stars
Observational constraints on mergers creating magnetism in massive starsSérgio Sacani
 
Manassas R - Parkside Middle School 🌎🏫
Manassas R - Parkside Middle School 🌎🏫Manassas R - Parkside Middle School 🌎🏫
Manassas R - Parkside Middle School 🌎🏫qfactory1
 
well logging & petrophysical analysis.pptx
well logging & petrophysical analysis.pptxwell logging & petrophysical analysis.pptx
well logging & petrophysical analysis.pptxzaydmeerab121
 
FREE NURSING BUNDLE FOR NURSES.PDF by na
FREE NURSING BUNDLE FOR NURSES.PDF by naFREE NURSING BUNDLE FOR NURSES.PDF by na
FREE NURSING BUNDLE FOR NURSES.PDF by naJASISJULIANOELYNV
 
bonjourmadame.tumblr.com bhaskar's girls
bonjourmadame.tumblr.com bhaskar's girlsbonjourmadame.tumblr.com bhaskar's girls
bonjourmadame.tumblr.com bhaskar's girlshansessene
 
Organic farming with special reference to vermiculture
Organic farming with special reference to vermicultureOrganic farming with special reference to vermiculture
Organic farming with special reference to vermicultureTakeleZike1
 
Dubai Calls Girl Lisa O525547819 Lexi Call Girls In Dubai
Dubai Calls Girl Lisa O525547819 Lexi Call Girls In DubaiDubai Calls Girl Lisa O525547819 Lexi Call Girls In Dubai
Dubai Calls Girl Lisa O525547819 Lexi Call Girls In Dubaikojalkojal131
 
Oxo-Acids of Halogens and their Salts.pptx
Oxo-Acids of Halogens and their Salts.pptxOxo-Acids of Halogens and their Salts.pptx
Oxo-Acids of Halogens and their Salts.pptxfarhanvvdk
 
Pests of Bengal gram_Identification_Dr.UPR.pdf
Pests of Bengal gram_Identification_Dr.UPR.pdfPests of Bengal gram_Identification_Dr.UPR.pdf
Pests of Bengal gram_Identification_Dr.UPR.pdfPirithiRaju
 
Introduction of Human Body & Structure of cell.pptx
Introduction of Human Body & Structure of cell.pptxIntroduction of Human Body & Structure of cell.pptx
Introduction of Human Body & Structure of cell.pptxMedical College
 

Dernier (20)

Servosystem Theory / Cybernetic Theory by Petrovic
Servosystem Theory / Cybernetic Theory by PetrovicServosystem Theory / Cybernetic Theory by Petrovic
Servosystem Theory / Cybernetic Theory by Petrovic
 
Fertilization: Sperm and the egg—collectively called the gametes—fuse togethe...
Fertilization: Sperm and the egg—collectively called the gametes—fuse togethe...Fertilization: Sperm and the egg—collectively called the gametes—fuse togethe...
Fertilization: Sperm and the egg—collectively called the gametes—fuse togethe...
 
Citronella presentation SlideShare mani upadhyay
Citronella presentation SlideShare mani upadhyayCitronella presentation SlideShare mani upadhyay
Citronella presentation SlideShare mani upadhyay
 
Pests of jatropha_Bionomics_identification_Dr.UPR.pdf
Pests of jatropha_Bionomics_identification_Dr.UPR.pdfPests of jatropha_Bionomics_identification_Dr.UPR.pdf
Pests of jatropha_Bionomics_identification_Dr.UPR.pdf
 
OECD bibliometric indicators: Selected highlights, April 2024
OECD bibliometric indicators: Selected highlights, April 2024OECD bibliometric indicators: Selected highlights, April 2024
OECD bibliometric indicators: Selected highlights, April 2024
 
User Guide: Magellan MX™ Weather Station
User Guide: Magellan MX™ Weather StationUser Guide: Magellan MX™ Weather Station
User Guide: Magellan MX™ Weather Station
 
trihybrid cross , test cross chi squares
trihybrid cross , test cross chi squarestrihybrid cross , test cross chi squares
trihybrid cross , test cross chi squares
 
Pests of castor_Binomics_Identification_Dr.UPR.pdf
Pests of castor_Binomics_Identification_Dr.UPR.pdfPests of castor_Binomics_Identification_Dr.UPR.pdf
Pests of castor_Binomics_Identification_Dr.UPR.pdf
 
Let’s Say Someone Did Drop the Bomb. Then What?
Let’s Say Someone Did Drop the Bomb. Then What?Let’s Say Someone Did Drop the Bomb. Then What?
Let’s Say Someone Did Drop the Bomb. Then What?
 
Observational constraints on mergers creating magnetism in massive stars
Observational constraints on mergers creating magnetism in massive starsObservational constraints on mergers creating magnetism in massive stars
Observational constraints on mergers creating magnetism in massive stars
 
Interferons.pptx.
Interferons.pptx.Interferons.pptx.
Interferons.pptx.
 
Manassas R - Parkside Middle School 🌎🏫
Manassas R - Parkside Middle School 🌎🏫Manassas R - Parkside Middle School 🌎🏫
Manassas R - Parkside Middle School 🌎🏫
 
well logging & petrophysical analysis.pptx
well logging & petrophysical analysis.pptxwell logging & petrophysical analysis.pptx
well logging & petrophysical analysis.pptx
 
FREE NURSING BUNDLE FOR NURSES.PDF by na
FREE NURSING BUNDLE FOR NURSES.PDF by naFREE NURSING BUNDLE FOR NURSES.PDF by na
FREE NURSING BUNDLE FOR NURSES.PDF by na
 
bonjourmadame.tumblr.com bhaskar's girls
bonjourmadame.tumblr.com bhaskar's girlsbonjourmadame.tumblr.com bhaskar's girls
bonjourmadame.tumblr.com bhaskar's girls
 
Organic farming with special reference to vermiculture
Organic farming with special reference to vermicultureOrganic farming with special reference to vermiculture
Organic farming with special reference to vermiculture
 
Dubai Calls Girl Lisa O525547819 Lexi Call Girls In Dubai
Dubai Calls Girl Lisa O525547819 Lexi Call Girls In DubaiDubai Calls Girl Lisa O525547819 Lexi Call Girls In Dubai
Dubai Calls Girl Lisa O525547819 Lexi Call Girls In Dubai
 
Oxo-Acids of Halogens and their Salts.pptx
Oxo-Acids of Halogens and their Salts.pptxOxo-Acids of Halogens and their Salts.pptx
Oxo-Acids of Halogens and their Salts.pptx
 
Pests of Bengal gram_Identification_Dr.UPR.pdf
Pests of Bengal gram_Identification_Dr.UPR.pdfPests of Bengal gram_Identification_Dr.UPR.pdf
Pests of Bengal gram_Identification_Dr.UPR.pdf
 
Introduction of Human Body & Structure of cell.pptx
Introduction of Human Body & Structure of cell.pptxIntroduction of Human Body & Structure of cell.pptx
Introduction of Human Body & Structure of cell.pptx
 

Geovisualization of coastal areas from heterogeneous spatio-temporal data (Antoine Masse)

  • 1. Antoine Masse, Sidonie Christophe IGN, COGIT Laboratory France GeoVIS 2015 - ISPRS Geospatial Week - 10/01/2015
  • 2. GeoVIS 2015 - ISPRS Geospatial Week - 10/01/2015 2 • Coastal area Between highest astronomical tide (shoreline) and lowest astronomical tide (drying line) • Spatio-temporal objects & phenomena • Uncertainty: in motion (tides, sands) • Incompleteness of data: underwater observation problems • Imprecision: different definitions of an object at different scale Sea/Land interface ShorelineDrying line Point Reyes, California Red : DTM data (res. 1m, prec. 0,2m) Yellow : 1:15,000 topomap Blue : 1:50,000 topomap Motivation: coastal area geovisualization Different Shoreline definition
  • 3. 3 Different uses & users  Different geovis Limitations:  Visual discontinuities and heterogeneity between sea & land  Perception of tides and/or water depth for non-specialist users C-Map®, navigation software ScanLittoral®, Touristic/Public map Interactive elevation simulation of lake Erie, USA (NOAA) Ortho-image of La Grande Motte, Google Maps® Ocean seafloor map of Hawai'i GeoVIS 2015 - ISPRS Geospatial Week - 10/01/2015 Motivation: coastal area geovisualization
  • 4. Purpose of the talk 4 • To convey sea dynamic information to users Example of tide dynamic for informational purposes • Hypothesis: – Using heterogeneous data (maps, ortho-imagery, LiDAR)… – … to make homogeneous visualizations between sea & land – … by controlling photo-realism/abstraction – … to convey tides & water depth perception GeoVIS 2015 - ISPRS Geospatial Week - 10/01/2015
  • 5. Implementation GeoVIS 2015 - ISPRS Geospatial Week - 10/01/2015 5 Lidar acquisition (land/sea) SHOM 0 5 10 Water elevation (in meters) Tidal data, REFMAR® project DTM (land/sea) SHOM Resolution: 1m/5m (land/sea) Vertical precision: 0.2m/0.5m (land/sea) Style Rendering Engine Final Rendering Perception Geographic feature External data Visual Variables Inspiration sources Colors, … Maps, ortho-imagery, … Abstraction, ortho-image-realism
  • 6. Proposition of geovisualizations 6 GeoVIS 2015 - ISPRS Geospatial Week - 10/01/2015 4 examples for water depth visualization, static and dynamic Same data, different stylization of water depth: - Abstraction maps - (Ortho) photo-realism 0 5 10 Water elevation (in meters) Data Inspiration
  • 7. 7 Inspiration: Map abstraction (1:25,000) Location: Lanildut, Finistère, France Data: DTM: Litto3D OpenData Tidal data: REFMAR OpenData Cartographic database Color map 1st example: perception of water depth by intervals Low tide 05/28/2009 14:00 Depth (m) 0 -5 -10 -20 Color Uses: Tourism, Hiking, Fishing Issues: ≠ producers ≠ uses no tidal information (ex: accessibility of Ile de Melon) GeoVIS 2015 - ISPRS Geospatial Week - 10/01/2015 High tide 05/28/2009 19:00
  • 8. 8 1st example: perception of water depth intervals Time x4000 GeoVIS 2015 - ISPRS Geospatial Week - 10/01/2015
  • 9. 9 Inspiration: Map abstraction 2nd example: continuous perception of water depth Location: Lanildut, Finistère, France Data: DTM: Litto3D OpenData Tidal data: REFMAR OpenData Cartographic database Colormap (interpolated) Low tide 05/28/2009 14:00 High tide 05/28/2009 19:00 GeoVIS 2015 - ISPRS Geospatial Week - 10/01/2015 Depth (m) 0 -5 -10 -20 Color
  • 10. 10 2nd example: continuous perception of water depth Time x4000 GeoVIS 2015 - ISPRS Geospatial Week - 10/01/2015
  • 11. 11 Inspiration: Ortho-image photo-realism Location: Lanildut, Finistère, France Data: DTM: Litto3D OpenData Tidal data: REFMAR OpenData IGN BD Ortho (land part) Colormap (interpolated) 3rd example: continuous water depth perception Depth (m) 0 -5 -10 -20 Color Uses: Exploration, landscape survey, … Issues: Color gaps Depth gaps no tidal information visualization of a specific tidal stage Low tide 05/28/2009 14:00 High tide 05/28/2009 19:00 GeoVIS 2015 - ISPRS Geospatial Week - 10/01/2015
  • 12. 12 3rd example: water depth perception Brightness +20% Contrast +40% Time x4000 GeoVIS 2015 - ISPRS Geospatial Week - 10/01/2015
  • 13. 13 Location: Vannes, Morbihan, France Data: DTM: Litto3D® OpenData Tidal data: REFMAR® OpenData IGN BD Ortho® (land part) Colormap (interpolated) 4th example: water depth perception Depth (m) 0 -5 -10 -20 Color Uses: Exploration, landscape survey, … Issues: Sands Sea infiltration at high tide High tide 03/21/2015 16:30 Low tide 03/21/2015 10:20 GeoVIS 2015 - ISPRS Geospatial Week - 10/01/2015 Inspiration: Ortho-image photorealism
  • 14. 14 4th example: water depth perception Brightness +20% Contrast +40% Time x4000 GeoVIS 2015 - ISPRS Geospatial Week - 10/01/2015
  • 15. Conclusion GeoVIS 2015 - ISPRS Geospatial Week - 10/01/2015 15 Goal: Convey sea dynamic information to geovisualization users Thoughts for coastal geovisualization: • Important: Data precision and land/sea visual continuity  improve water depth perception • Static and dynamic visualization -> different use, complementary • Abstraction/Photo-realism: same data, different stylization
  • 16. 16 - User Evaluation: uses and users? • readability, handling, adaptation to specific use, integration in final-user applications, etc. • Task examples: How deep it is? When is it accessible? - Tool adaptability • Other data for validation • Realism improvements • With new data (ex: seafloor cover) • With new stylization tools (expressive textures like waves and sea stream, shaded relief) Perspectives Our method with other data Carmel-by-the-sea, CA, USA NOAA for DTM (sea) / Google Maps (land) Shaded relief (Yu, 2005) GeoVIS 2015 - ISPRS Geospatial Week - 10/01/2015Water texture
  • 17. Thanks 17 mapstyle.ign.fr antoinemasse.froxygene-project.sourceforge.net/ nice software nice project nice speaker GeoVIS 2015 - ISPRS Geospatial Week - 10/01/2015