SlideShare une entreprise Scribd logo
1  sur  12
Global Water Supply Threat


                                     Vorosmarty et al Nature 2010

The global percentage of dry areas has increased by
about 1.74% (of global land area) per decade (11%)
from 1950 to 2008.    Aiguo Dai. J.Geophysical Res 2011
Happiness and GDP
    Percentage very happy    United States


                                 Real income
                                 per person


                                    Percentage
                                    very happy

     Source: Layard (2005)


 “Americans have been more successful decoupling GDP from
 happiness than in decoupling it from material and energy” —
 Peter Victor                                                  2
Fossil and Cement Emissions
Global fossil and cement emissions: 9.5±0.5PgC in 2011, 54% over 1990
            Projection for 2012: 9.7±0.5PgC, 58% over 1990


             Uncertainty is ±5% for one standard deviation (IPCC “likely” range)
      Source: Peters et al. 2012a; Le Quéré et al. 2012; CDIAC Data; Global Carbon Project 2012
The recent shift from coal to gas in the USA
 The recent shift from coal to gas in the US could “kick start” mitigation
To keep below 2ºC requires a shift to technologies with lower emissions


          Grey areas are: World War I, Great Depression, World War II, oil shocks
               Source: Peters et al. 2012a; CDIAC Data; Global Carbon Project 2012
Emissions from coal, oil, gas, cement
Emissions growth 2000-2011: coal (4.9%/yr), oil (1.1%/yr), gas (2.7%/yr),
            cement (6.9%/yr), flaring (4.3%/yr, not shown)

                                                                                    Share of global
                                                                                    emissions in 2011


             Source: CDIAC Data; Le Quéré et al. 2012; Global Carbon Project 2012
Top Fossil Fuel Emitters (Absolute)
       Top four emitters in 2011 covered 62% of global emissions
        China (28%), United States (16%), EU27 (11%), India (7%)


The growing gap between EU27 and USA is due to emission decreases in Germany (45% of the
1990-2011 cumulative difference), UK (19%), Romania (13%), Czech Republic (8%), and Poland
                                            (5%)
Major flows from Production to Consumption
        Start of Arrow: fossil-fuel consumption (production)
          End of arrow: goods and services consumption


        Values for 2007. EU27 is treated as one region. Units: TgC=PgC/1000
                              Source: Peters et al 2012b
Major flows from Extraction to Consumption
                Start of Arrow: fossil-fuel extraction
           End of arrow: goods and services consumption


                               Arrow scaling different in previous figure


         Values for 2007. EU27 is treated as one region. Units: TgC=PgC/1000
                               Source: Peters et al 2012b
Since 1986:
Western Fire Season 78 days longer
4X Increase in Fires > 1000acres
6X Increase in Acres Burned
> Increase in Forests above 6500ft
Power Plants like
Colstrip use 1 Train Car
   every 5 minutes
Energy Efficiency Works
                                    Per Capita Electricity Consumption
             14,000
                                                                         United States
             12,000


             10,000
kWh/person


              8,000                                                       California


              6,000


              4,000


              2,000


                -
                      1960   1964   1968   1972   1976   1980   1984   1988   1992       1996   2000   2004

Source: California Energy Commission, 2005

Contenu connexe

Tendances

Low Carbon Learning (User V1)
Low Carbon Learning (User V1)Low Carbon Learning (User V1)
Low Carbon Learning (User V1)martinip
 
An innovation challenge we all share
An innovation challenge we all shareAn innovation challenge we all share
An innovation challenge we all shareCapgemini
 
Shropshire Hills Aonb Presentation 21st October 2008
Shropshire Hills Aonb Presentation 21st October 2008Shropshire Hills Aonb Presentation 21st October 2008
Shropshire Hills Aonb Presentation 21st October 2008Marches Energy Agency
 
Energy Climate Era
Energy Climate EraEnergy Climate Era
Energy Climate Eralarae9411
 
Renewable Energy
Renewable EnergyRenewable Energy
Renewable Energyguest4440e5
 
Energy And Climate Change
Energy And Climate ChangeEnergy And Climate Change
Energy And Climate ChangeDavid Hone
 
Capitalism, carbon and climate change
Capitalism, carbon and climate changeCapitalism, carbon and climate change
Capitalism, carbon and climate changeSTEPS Centre
 
Professor Sir David King at the Bristol Festival Of Ideas
Professor Sir David King at the Bristol Festival Of IdeasProfessor Sir David King at the Bristol Festival Of Ideas
Professor Sir David King at the Bristol Festival Of IdeasJames Barlow
 
Seth Kaplan presentation at EUCI conference on Renewable Energy Markets in Ne...
Seth Kaplan presentation at EUCI conference on Renewable Energy Markets in Ne...Seth Kaplan presentation at EUCI conference on Renewable Energy Markets in Ne...
Seth Kaplan presentation at EUCI conference on Renewable Energy Markets in Ne...Seth Kaplan
 
Air Pollution and COVID-19, Enrico Botta
Air Pollution and COVID-19, Enrico BottaAir Pollution and COVID-19, Enrico Botta
Air Pollution and COVID-19, Enrico BottaStatsCommunications
 
World nuclear-performance-report-2016
World nuclear-performance-report-2016World nuclear-performance-report-2016
World nuclear-performance-report-2016Leonam Guimarães
 
Panel 4. CCS technology - Dr Elizabeth Burton
Panel 4. CCS technology - Dr Elizabeth BurtonPanel 4. CCS technology - Dr Elizabeth Burton
Panel 4. CCS technology - Dr Elizabeth BurtonGlobal CCS Institute
 
What is carbon-negative technology and its remarkable impact on the environment?
What is carbon-negative technology and its remarkable impact on the environment?What is carbon-negative technology and its remarkable impact on the environment?
What is carbon-negative technology and its remarkable impact on the environment?mohammedmostafa86
 
Global Warming
Global WarmingGlobal Warming
Global Warmingcorrin
 

Tendances (20)

Low Carbon Learning (User V1)
Low Carbon Learning (User V1)Low Carbon Learning (User V1)
Low Carbon Learning (User V1)
 
APP Email 10.24.05 (c)
APP Email 10.24.05 (c)APP Email 10.24.05 (c)
APP Email 10.24.05 (c)
 
An innovation challenge we all share
An innovation challenge we all shareAn innovation challenge we all share
An innovation challenge we all share
 
Shropshire Hills Aonb Presentation 21st October 2008
Shropshire Hills Aonb Presentation 21st October 2008Shropshire Hills Aonb Presentation 21st October 2008
Shropshire Hills Aonb Presentation 21st October 2008
 
Energy Climate Era
Energy Climate EraEnergy Climate Era
Energy Climate Era
 
Renewable Energy
Renewable EnergyRenewable Energy
Renewable Energy
 
APP Email 10.06.05
APP Email 10.06.05APP Email 10.06.05
APP Email 10.06.05
 
Stories to Watch 2012
Stories to Watch 2012Stories to Watch 2012
Stories to Watch 2012
 
Energy And Climate Change
Energy And Climate ChangeEnergy And Climate Change
Energy And Climate Change
 
Capitalism, carbon and climate change
Capitalism, carbon and climate changeCapitalism, carbon and climate change
Capitalism, carbon and climate change
 
Professor Sir David King at the Bristol Festival Of Ideas
Professor Sir David King at the Bristol Festival Of IdeasProfessor Sir David King at the Bristol Festival Of Ideas
Professor Sir David King at the Bristol Festival Of Ideas
 
Nuclear for climate
Nuclear for climateNuclear for climate
Nuclear for climate
 
Bcfr April 20 2010
Bcfr April 20 2010Bcfr April 20 2010
Bcfr April 20 2010
 
Seth Kaplan presentation at EUCI conference on Renewable Energy Markets in Ne...
Seth Kaplan presentation at EUCI conference on Renewable Energy Markets in Ne...Seth Kaplan presentation at EUCI conference on Renewable Energy Markets in Ne...
Seth Kaplan presentation at EUCI conference on Renewable Energy Markets in Ne...
 
Air Pollution and COVID-19, Enrico Botta
Air Pollution and COVID-19, Enrico BottaAir Pollution and COVID-19, Enrico Botta
Air Pollution and COVID-19, Enrico Botta
 
World nuclear-performance-report-2016
World nuclear-performance-report-2016World nuclear-performance-report-2016
World nuclear-performance-report-2016
 
Panel 4. CCS technology - Dr Elizabeth Burton
Panel 4. CCS technology - Dr Elizabeth BurtonPanel 4. CCS technology - Dr Elizabeth Burton
Panel 4. CCS technology - Dr Elizabeth Burton
 
Renewable or nuclear energy
Renewable or nuclear energyRenewable or nuclear energy
Renewable or nuclear energy
 
What is carbon-negative technology and its remarkable impact on the environment?
What is carbon-negative technology and its remarkable impact on the environment?What is carbon-negative technology and its remarkable impact on the environment?
What is carbon-negative technology and its remarkable impact on the environment?
 
Global Warming
Global WarmingGlobal Warming
Global Warming
 

En vedette

Global Carbon Budget 2014
Global Carbon Budget 2014Global Carbon Budget 2014
Global Carbon Budget 2014Glen Peters
 
How to think like a startup
How to think like a startupHow to think like a startup
How to think like a startupLoic Le Meur
 
Teaching Students with Emojis, Emoticons, & Textspeak
Teaching Students with Emojis, Emoticons, & TextspeakTeaching Students with Emojis, Emoticons, & Textspeak
Teaching Students with Emojis, Emoticons, & TextspeakShelly Sanchez Terrell
 
Hype vs. Reality: The AI Explainer
Hype vs. Reality: The AI ExplainerHype vs. Reality: The AI Explainer
Hype vs. Reality: The AI ExplainerLuminary Labs
 
Study: The Future of VR, AR and Self-Driving Cars
Study: The Future of VR, AR and Self-Driving CarsStudy: The Future of VR, AR and Self-Driving Cars
Study: The Future of VR, AR and Self-Driving CarsLinkedIn
 

En vedette (6)

Global Carbon Budget 2014
Global Carbon Budget 2014Global Carbon Budget 2014
Global Carbon Budget 2014
 
Inaugural Addresses
Inaugural AddressesInaugural Addresses
Inaugural Addresses
 
How to think like a startup
How to think like a startupHow to think like a startup
How to think like a startup
 
Teaching Students with Emojis, Emoticons, & Textspeak
Teaching Students with Emojis, Emoticons, & TextspeakTeaching Students with Emojis, Emoticons, & Textspeak
Teaching Students with Emojis, Emoticons, & Textspeak
 
Hype vs. Reality: The AI Explainer
Hype vs. Reality: The AI ExplainerHype vs. Reality: The AI Explainer
Hype vs. Reality: The AI Explainer
 
Study: The Future of VR, AR and Self-Driving Cars
Study: The Future of VR, AR and Self-Driving CarsStudy: The Future of VR, AR and Self-Driving Cars
Study: The Future of VR, AR and Self-Driving Cars
 

Similaire à Steve running powerpoint

Climate Change: Current Status, Impacts and Solutions by Mario Molina
Climate Change: Current Status, Impacts and Solutions by Mario MolinaClimate Change: Current Status, Impacts and Solutions by Mario Molina
Climate Change: Current Status, Impacts and Solutions by Mario MolinaWILD Foundation
 
Steven Chu at BASF Science Symposium
Steven Chu at BASF Science Symposium Steven Chu at BASF Science Symposium
Steven Chu at BASF Science Symposium BASF
 
crittenden_presentation.pdf
crittenden_presentation.pdfcrittenden_presentation.pdf
crittenden_presentation.pdfGKPATHSALA
 
Worlds without nuclear3
Worlds without nuclear3Worlds without nuclear3
Worlds without nuclear3Ben Heard
 
Final Energy Essay
Final Energy EssayFinal Energy Essay
Final Energy EssayAmie Nevin
 
Nuclear Power: From Opponent to Proponent
Nuclear Power: From Opponent to ProponentNuclear Power: From Opponent to Proponent
Nuclear Power: From Opponent to ProponentBen Heard
 
Science Vale UK energy event keynote presentation
Science Vale UK energy event   keynote presentationScience Vale UK energy event   keynote presentation
Science Vale UK energy event keynote presentationScience Vale UK
 
Michael P Totten A Climate For Life Mesh Talk Bioneer Los Angeles 12 09 09
Michael P Totten A Climate For Life Mesh Talk Bioneer Los Angeles 12 09 09Michael P Totten A Climate For Life Mesh Talk Bioneer Los Angeles 12 09 09
Michael P Totten A Climate For Life Mesh Talk Bioneer Los Angeles 12 09 09Michael P Totten
 
Wdr2010 Graphics Ch0 Overview[1]
Wdr2010 Graphics Ch0 Overview[1]Wdr2010 Graphics Ch0 Overview[1]
Wdr2010 Graphics Ch0 Overview[1]wringobanker
 
A2 CAMBRIDGE GEOGRAPHY: ENVIRONMENTAL MANAGEMENT - SUSTAINABLE ENERGY SUPPLIES
A2 CAMBRIDGE GEOGRAPHY: ENVIRONMENTAL MANAGEMENT - SUSTAINABLE ENERGY SUPPLIESA2 CAMBRIDGE GEOGRAPHY: ENVIRONMENTAL MANAGEMENT - SUSTAINABLE ENERGY SUPPLIES
A2 CAMBRIDGE GEOGRAPHY: ENVIRONMENTAL MANAGEMENT - SUSTAINABLE ENERGY SUPPLIESGeorge Dumitrache
 
Alternative Fuel in vehicle
Alternative Fuel in vehicle Alternative Fuel in vehicle
Alternative Fuel in vehicle jiodadi
 
John Hanger Webinar: The Truth About Gas Drilling and America's Energy Choices
John Hanger Webinar: The Truth About Gas Drilling and America's Energy ChoicesJohn Hanger Webinar: The Truth About Gas Drilling and America's Energy Choices
John Hanger Webinar: The Truth About Gas Drilling and America's Energy ChoicesMarcellus Drilling News
 
Climate Change Actions
Climate Change ActionsClimate Change Actions
Climate Change Actionsjefmoi
 
Positioning The Nuclear Sector In A Greener World Roger Emmott Jan 2009
Positioning The Nuclear Sector In A Greener World   Roger Emmott Jan 2009Positioning The Nuclear Sector In A Greener World   Roger Emmott Jan 2009
Positioning The Nuclear Sector In A Greener World Roger Emmott Jan 2009Roger Emmott
 
The Unscientific Fantasy: 100% Renewables
The Unscientific Fantasy: 100% RenewablesThe Unscientific Fantasy: 100% Renewables
The Unscientific Fantasy: 100% RenewablesKarl Pauls
 
HEC Presentation about IPEEC and EE
HEC Presentation about IPEEC and EEHEC Presentation about IPEEC and EE
HEC Presentation about IPEEC and EEnooone
 

Similaire à Steve running powerpoint (20)

Climate Change: Current Status, Impacts and Solutions by Mario Molina
Climate Change: Current Status, Impacts and Solutions by Mario MolinaClimate Change: Current Status, Impacts and Solutions by Mario Molina
Climate Change: Current Status, Impacts and Solutions by Mario Molina
 
Steven Chu at BASF Science Symposium
Steven Chu at BASF Science Symposium Steven Chu at BASF Science Symposium
Steven Chu at BASF Science Symposium
 
crittenden_presentation.pdf
crittenden_presentation.pdfcrittenden_presentation.pdf
crittenden_presentation.pdf
 
Worlds without nuclear3
Worlds without nuclear3Worlds without nuclear3
Worlds without nuclear3
 
Final Energy Essay
Final Energy EssayFinal Energy Essay
Final Energy Essay
 
Nuclear Power: From Opponent to Proponent
Nuclear Power: From Opponent to ProponentNuclear Power: From Opponent to Proponent
Nuclear Power: From Opponent to Proponent
 
Science Vale UK energy event keynote presentation
Science Vale UK energy event   keynote presentationScience Vale UK energy event   keynote presentation
Science Vale UK energy event keynote presentation
 
Michael P Totten A Climate For Life Mesh Talk Bioneer Los Angeles 12 09 09
Michael P Totten A Climate For Life Mesh Talk Bioneer Los Angeles 12 09 09Michael P Totten A Climate For Life Mesh Talk Bioneer Los Angeles 12 09 09
Michael P Totten A Climate For Life Mesh Talk Bioneer Los Angeles 12 09 09
 
Zmiany klimatyczne: mity czy realia
Zmiany klimatyczne: mity czy realiaZmiany klimatyczne: mity czy realia
Zmiany klimatyczne: mity czy realia
 
Wdr2010 Graphics Ch0 Overview[1]
Wdr2010 Graphics Ch0 Overview[1]Wdr2010 Graphics Ch0 Overview[1]
Wdr2010 Graphics Ch0 Overview[1]
 
A2 CAMBRIDGE GEOGRAPHY: ENVIRONMENTAL MANAGEMENT - SUSTAINABLE ENERGY SUPPLIES
A2 CAMBRIDGE GEOGRAPHY: ENVIRONMENTAL MANAGEMENT - SUSTAINABLE ENERGY SUPPLIESA2 CAMBRIDGE GEOGRAPHY: ENVIRONMENTAL MANAGEMENT - SUSTAINABLE ENERGY SUPPLIES
A2 CAMBRIDGE GEOGRAPHY: ENVIRONMENTAL MANAGEMENT - SUSTAINABLE ENERGY SUPPLIES
 
Alternative Fuel in vehicle
Alternative Fuel in vehicle Alternative Fuel in vehicle
Alternative Fuel in vehicle
 
Johan rockström och Anders Wijkman - Bankrupting nature 2013
Johan rockström och Anders Wijkman - Bankrupting nature 2013 Johan rockström och Anders Wijkman - Bankrupting nature 2013
Johan rockström och Anders Wijkman - Bankrupting nature 2013
 
Thesis. LPWI
Thesis. LPWIThesis. LPWI
Thesis. LPWI
 
John Hanger Webinar: The Truth About Gas Drilling and America's Energy Choices
John Hanger Webinar: The Truth About Gas Drilling and America's Energy ChoicesJohn Hanger Webinar: The Truth About Gas Drilling and America's Energy Choices
John Hanger Webinar: The Truth About Gas Drilling and America's Energy Choices
 
Climate Change Actions
Climate Change ActionsClimate Change Actions
Climate Change Actions
 
Positioning The Nuclear Sector In A Greener World Roger Emmott Jan 2009
Positioning The Nuclear Sector In A Greener World   Roger Emmott Jan 2009Positioning The Nuclear Sector In A Greener World   Roger Emmott Jan 2009
Positioning The Nuclear Sector In A Greener World Roger Emmott Jan 2009
 
The Unscientific Fantasy: 100% Renewables
The Unscientific Fantasy: 100% RenewablesThe Unscientific Fantasy: 100% Renewables
The Unscientific Fantasy: 100% Renewables
 
HEC Presentation about IPEEC and EE
HEC Presentation about IPEEC and EEHEC Presentation about IPEEC and EE
HEC Presentation about IPEEC and EE
 
Green office tips
Green office tipsGreen office tips
Green office tips
 

Steve running powerpoint

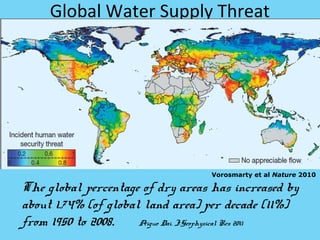
  • 1. Global Water Supply Threat Vorosmarty et al Nature 2010 The global percentage of dry areas has increased by about 1.74% (of global land area) per decade (11%) from 1950 to 2008. Aiguo Dai. J.Geophysical Res 2011
  • 2. Happiness and GDP Percentage very happy United States Real income per person Percentage very happy Source: Layard (2005) “Americans have been more successful decoupling GDP from happiness than in decoupling it from material and energy” — Peter Victor 2
  • 3. Fossil and Cement Emissions Global fossil and cement emissions: 9.5±0.5PgC in 2011, 54% over 1990 Projection for 2012: 9.7±0.5PgC, 58% over 1990 Uncertainty is ±5% for one standard deviation (IPCC “likely” range) Source: Peters et al. 2012a; Le Quéré et al. 2012; CDIAC Data; Global Carbon Project 2012
  • 4. The recent shift from coal to gas in the USA The recent shift from coal to gas in the US could “kick start” mitigation To keep below 2ºC requires a shift to technologies with lower emissions Grey areas are: World War I, Great Depression, World War II, oil shocks Source: Peters et al. 2012a; CDIAC Data; Global Carbon Project 2012
  • 5. Emissions from coal, oil, gas, cement Emissions growth 2000-2011: coal (4.9%/yr), oil (1.1%/yr), gas (2.7%/yr), cement (6.9%/yr), flaring (4.3%/yr, not shown) Share of global emissions in 2011 Source: CDIAC Data; Le Quéré et al. 2012; Global Carbon Project 2012
  • 6. Top Fossil Fuel Emitters (Absolute) Top four emitters in 2011 covered 62% of global emissions China (28%), United States (16%), EU27 (11%), India (7%) The growing gap between EU27 and USA is due to emission decreases in Germany (45% of the 1990-2011 cumulative difference), UK (19%), Romania (13%), Czech Republic (8%), and Poland (5%)
  • 7. Major flows from Production to Consumption Start of Arrow: fossil-fuel consumption (production) End of arrow: goods and services consumption Values for 2007. EU27 is treated as one region. Units: TgC=PgC/1000 Source: Peters et al 2012b
  • 8. Major flows from Extraction to Consumption Start of Arrow: fossil-fuel extraction End of arrow: goods and services consumption Arrow scaling different in previous figure Values for 2007. EU27 is treated as one region. Units: TgC=PgC/1000 Source: Peters et al 2012b
  • 9. Since 1986: Western Fire Season 78 days longer 4X Increase in Fires > 1000acres 6X Increase in Acres Burned > Increase in Forests above 6500ft
  • 10.
  • 11. Power Plants like Colstrip use 1 Train Car every 5 minutes
  • 12. Energy Efficiency Works Per Capita Electricity Consumption 14,000 United States 12,000 10,000 kWh/person 8,000 California 6,000 4,000 2,000 - 1960 1964 1968 1972 1976 1980 1984 1988 1992 1996 2000 2004 Source: California Energy Commission, 2005

Notes de l'éditeur

  1. Data are now widely available from surveys of happiness and life satisfaction In these surveys, people are asked to rate their level of happiness or life satisfaction on a numerical scale (from 1-10 for example) If we look at these data over time for countries like the U.S. or UK, we find that although GDP per capita has more than tripled since 1950, people have not become any happier “ Americans have been more successful decoupling GDP from happiness than in decoupling it from material and energy” The chart is from Layard, R., 2005. Happiness: lessons from a new science . Penguin Press, New York, p. 30. The quote is from: Victor, P.A., 2008. Managing Without Growth: Slower by Design, Not Disaster . Edward Elgar, Cheltenham, UK, p. 125.