Experiment report - Pedestrian simulation
•
1 j'aime•590 vues

Report of a physical simulation done at the new pedestrian link at the Montreal Jewish General Hospital August 8 2013

Recommandé
Contenu connexe
En vedette
En vedette (19)
Plus de Alvaro Gil
Plus de Alvaro Gil (9)
Experiment report - Pedestrian simulation
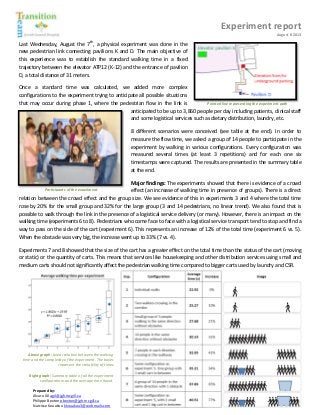
- 1. Experiment report August 8 2013 Last Wednesday, August the 7th, a physical experiment was done in the new pedestrian link connecting pavilions K and D. The main objective of this experience was to establish the standard walking time in a fixed trajectory between the elevator ATP12 (K-12) and the entrance of pavilion D, a total distance of 31 meters. Once a standard time was calculated, we added more complex configurations to the experiment trying to anticipate all possible situations that may occur during phase 1, where the pedestrian flow in the link is Pointed line representing the experiment path anticipated to be up to 3,860 people per day including patients, clinical staff and some logistical services such as dietary distribution, laundry, etc. 8 different scenarios were conceived (see table at the end). In order to measure the flow time, we asked a group of 14 people to participate in the experiment by walking in various configurations. Every configuration was measured several times (at least 3 repetitions) and for each one six timestamps were captured. The results are presented in the summary table at the end. Major findings: The experiments showed that there is evidence of a crowd effect (an increase of walking time in presence of groups). There is a direct relation between the crowd effect and the group size. We see evidence of this in experiments 3 and 4 where the total time rose by 20% for the small group and 32% for the large group (3 and 14 pedestrians, no linear trend). We also found that is possible to walk through the link in the presence of a logistical service delivery (or many). However, there is an impact on the walking time (experiments 6 to 8). Pedestrians who come face to face with a logistical service transport tend to stop and find a way to pass on the side of the cart (experiment 6). This represents an increase of 12% of the total time (experiment 6 vs. 5). When the obstacle was very big, the increase went up to 33% (7 vs. 4). Participants of the experiment Experiments 7 and 8 showed that the size of the cart has a greater effect on the total time than the status of the cart (moving or static) or the quantity of carts. This means that services like housekeeping and other distribution services using small and medium carts should not significantly affect the pedestrian walking time compared to bigger carts used by laundry and CSR. Above graph: Linear relation between the walking time and the complexity of the experiment. The boxes represent the variability of times Right graph: Summary table of all the experiment configurations and the average time found. Prepared by: Alvaro Gil agil@jgh.mcgill.ca Philippe Bexton pbexton@jgh.mcgill.ca Narcisse Kouakou kkouakou3@webmails.com