Contenu connexe
Similaire à Western U.S. view point april 2012
Similaire à Western U.S. view point april 2012 (20)
Western U.S. view point april 2012
- 1. CBRE
Western U.S.
www.cbre.com/research April 2012
Shifting Landscapes and Aftershocks: Western Office Markets on the Move
By Darin Mellott,
Senior Research Analyst, Salt Lake City
After major shocks to the financial system in 2008 and According to the Q4 2011 CBRE North America Office
ensuing Great Recession, west coast office market Vacancy Index, average vacancy for west coast office
landscapes were altered. Even today, aftershocks markets at the end of 2011 was 17.3% compared to
continue to be felt as adjustments in housing, local 16% nationally. Performance varies in the region
industry and varying degrees of government austerity ranging from a low of 11.2% vacancy in San Francisco
continue to shape market environments. Furthermore, to a high of 25.5% in Phoenix. Some of the reasons for
financial markets still healing from events of the last varying performance will be explored in this report, but
decade now face new threats from Europe’s sovereign in summary, these west coast office markets reflect
debt crisis and businesses buffeted by uncertainty are broader trends. As such, some metros continue to
reluctant to hire. All combined, this is the new struggle as others hit their stride.
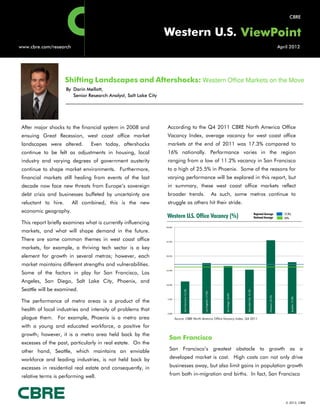
economic geography. Regional Average 17.3%
Western U.S. Office Vacancy (%) National Average 16%
This report briefly examines what is currently influencing
30.0%
markets, and what will shape demand in the future.
There are some common themes in west coast office 25.0%
markets, for example, a thriving tech sector is a key
element for growth in several metros; however, each 20.0%
market maintains different strengths and vulnerabilities.
15.0%
Some of the factors in play for San Francisco, Los
Angeles, San Diego, Salt Lake City, Phoenix, and
10.0%
Seattle will be examined.
San Francisco: 11.2%
Salt Lake City: 15.3%
Los Angeles: 17.6%
San Diego: 16.6%
Phoenix: 25.5%
Seattle: 17.9%
The performance of metro areas is a product of the 5.0%
health of local industries and intensity of problems that
0.0%
plague them. For example, Phoenix is a metro area Source: CBRE North America Office Vacancy Index, Q4 2011
with a young and educated workforce, a positive for
growth; however, it is a metro area held back by the
San Francisco
excesses of the past, particularly in real estate. On the
other hand, Seattle, which maintains an enviable San Francisco’s greatest obstacle to growth as a
workforce and leading industries, is not held back by developed market is cost. High costs can not only drive
excesses in residential real estate and consequently, in businesses away, but also limit gains in population growth
relative terms is performing well. from both in-migration and births. In fact, San Francisco
© 2012, CBRE
- 2. Western U.S. ViewPoint
County is only one of four counties in the state of During 2011, the area’s office market experienced
California with a projected decline in its birth rate over substantial improvement. With absorption totaling 2.1
the next 10 years, according to the California million sq. ft., vacancy fell from 15.5% at year-end 2010
Department of Finance. Furthermore, the city’s large to 11.2% at year-end 2011. Solid demand pushed the
financial sector leaves it vulnerable to negative effects market’s average asking lease rate up to $38.40 per sq.
from increasing regulation and Europe’s sovereign ft. at year-end 2011 from $31.33 at the end of 2010,
debt crisis. representing a 23% increase.
Currently, San Francisco maintains the lowest office The outlook for San Francisco is positive through the
vacancy in the western United States.1 As the tech medium-term, barring any major exogenous shocks,
sector in San Francisco continues to thrive, it is creating especially through financial channels. Strong demand
robust demand for office space, particularly Class B for office space will ensure continued positive absorption,
product that tech firms tend to gravitate toward. bringing vacancy down. With steady demand and falling
Demand from tech firms is providing an effective vacancy, lease rates can be expected to increase during
counterbalance to sluggishness in financial services. 2012. Future performance in San Francisco’s office
Almost 20% of all jobs in the Bay Area can be classified market will depend upon the tech industry. At the
as part of the tech sector, and during the last quarter of present time, indicators are giving reason to be confident
2011, tech-oriented tenants accounted for more than that the area’s office market will perform well in 2012.3
50% of demand for office space.2
Western U.S. Job Growth in 2011
To the city’s benefit, a well-educated workforce and
2.1%
presence as a global tech hub will create some Seattle -1.9%
1.6%
gravitational pull and continue to attract firms both new
1.1%
and established. According to analysis by the Phoenix 2.0%
1.5%
California Department of Finance, the Bay Area 5.2%
Salt Lake City 2.7%
maintains the six most college-educated counties in the 3.6%
state. San Diego -1.8%
2.4%
0.9%
The Bureau of Labor Statistics (BLS) reported job growth 1.8%
Los Angeles 0.3%
in San Francisco for 2011 at 2.4% across all sectors, 0.5%
6.8%
outperforming state and national averages. In sectors San Francisco -0.9%
2.4%
related to office demand, job growth—although
-3.0% -2.0% -1.0% 0.0% 1.0% 2.0% 3.0% 4.0% 5.0% 6.0% 7.0% 8.0%
mixed—was a net positive. Financial services
contracted slightly at a rate of 0.9%. Meanwhile, Professional & Bus Svcs Financial Svcs Total Job Growth
Source: Bureau of Labor Statistics
professional and business services grew at a robust
rate of 6.8% in 2011. Due to its prominence in the Los Angeles
area, the importance of a healthy tech sector cannot be The economic recovery in Los Angeles can be
understated. A healthy tech sector will also buoy other characterized as subdued. Employment data is especially
professional and business services, further increasing important in Los Angeles, because without a concentrated
demand for office space. and thriving industry, such as tech or aerospace in
1 CBRE North America Office Vacancy Index Q4, 2011
2 CBRE Viewpoint: Technology Sets the Pace in the San Francisco Office Market
3 CBRE Research, San Francisco
April 2012
Page 2
© 2012, CBRE
- 3. Western U.S. ViewPoint
Seattle, the area depends on its large consumer base complicate its economic recovery and long-term growth
to underpin the local economy. As employment prospects.
growth remains sluggish, it will continue to restrain
Over the medium-term, several planned multi-billion-
LA’s economy from growing at a faster rate.
dollar public investments will boost the local economy
By percentage, job growth in America’s second- and improve infrastructure, including an underground
largest city was the lowest of six metros in this report. light rail system in downtown Los Angeles, facility
According to the BLS, LA registered job growth of just improvements at LAX and Port of LA, convention center
0.5% for 2011. In office-using sectors, financial expansion and a new NFL football stadium.4 Such
services grew slightly at 0.3%, while professional and investments will provide short-term support for the local
business services expanded by 1.8% in 2011. economy and ensure a viable future for international
Difficulties in the labor market are reflected in both trade, which is a stabilizing and important component
sluggish growth and current unemployment levels. of the metro area’s economy.
At 11.6% in December 2011, unemployment in Los
Due to its exposure to international trade, Los Angeles
Angeles was 40 basis points higher than the state
benefitted as flow volumes recovered after the
average and 3.1 percentage points higher than the
recession. However, any dramatic slowdown in the
national average.
global economy as a result of Europe’s sovereign debt
Western U.S. Population Growth % Change 2000-2010
crisis, or sustained energy prices at highly elevated
levels, would deal a blow to the area’s economy.
Seattle 11.2%
It should be noted that improvements to the Panama
Phoenix 24.2%
Canal will be complete in 2014 and allow cargo to be
Salt Lake City
more economically shipped directly from Asia to the
14.6%
east coast. This is a significant development to
San Diego 10.0% monitor, because ports in the LA metro support an
estimated 500,000 jobs. While improvements to ports
Los Angeles 3.1%
will help maintain a competitive edge of speed relative
San Francisco 3.7%
to east coast destinations, disputes regarding
improvements are slowing enhancement projects. Such
0.0% 5.0% 10.0% 15.0% 20.0% 25.0%
developments must be monitored closely to understand
Source: 2010 U.S. Census for counties of each metro area.
how the Panama Canal improvements will ultimately
Demographics in the city paint a mixed picture. On affect the southland.5
the positive end, LA’s population increased by 3.1%
The Los Angeles office market experienced positive
from 2000 to 2010, according to the U.S. Census
absorption of almost 686,000 sq. ft. during 2011,
Bureau. However, vulnerabilities that need to be
meanwhile vacancy held steady at 17.6% from year-
addressed come from the high cost of doing business
end 2010 to year-end 2011. At 17.6%, office vacancy
and low levels of education attainment, which will
4 Moody’s Analytics
5 The Economist: “California’s Ports: The fickle Asian container”
April 2012
Page 3
© 2012, CBRE
- 4. Western U.S. ViewPoint
in Los Angeles surpasses both western and national Western U.S. Net Absorption Rates (%)
averages last reported to be 17.3% and 16%, 6.00%
respectively.6 Meanwhile, average asking lease rates 5.00%
remained unchanged at $29.76 per sq. ft. Although 4.00%
indicators are showing some improvement in the LA 3.00%
San Francisco
2.00%
office market, it is struggling. Large tenants continue Los Angeles
1.00% San Diego
to shed space, with smaller to mid-sized firms driving Phoenix
0.00%
most of the recent gains.7 -1.00%
Salt Lake
Seattle
-2.00%
Interestingly, the Santa Monica submarket in the LA
-3.00%
metro stands out and will continue to outperform the -4.00%
rest of the market. Not surprisingly, tech companies 2007 2008 2009 2010 2011
Source: CBRE Research
are driving growth there. Santa Monica continues to
attract attention and is home to names such as
Google, Facebook and Yahoo. Current vacancy in presence of such industries in San Diego will be bolstered
the submarket is 9.4%, well below the metro average by a 50% increase in startups compared to the first half of
of 17.6%. 2011. Additionally, Johnson & Johnson will open a
biotech and health IT innovation center in 2012. 8
In the broader Los Angeles market, office demand will
remain sluggish through the short-term. In the public sector, a heavy defense presence does pose
Consequently, absorption will remain subdued, but is some risk to the area’s economy. However, with the
expected to remain positive. Vacancy is expected to Obama Administration’s renewed focus on the Asia
slowly decline, aided by restricted new supply. Pacific region, San Diego’s naval base will likely shield
However, lease rates both asking and effective are the area from painfully deep defense cuts. Furthermore,
stabilizing and are expected to remain stable demand for Northrup Grumman’s unmanned aerial
throughout 2012. vehicles is supporting the company’s growth in the area.9
Los Angeles will struggle more than other markets to BLS data indicates job growth in San Diego was subdued
make progress toward a healthy supply-demand at 0.9% in 2011. In sectors related to office demand,
balance and the timing of such a development financial services contracted by 1.8%, and professional
extends into the medium-term. and business services expanded by 2.4% over the same
period.
San Diego
General economic conditions and office market Indicators for future growth are also encouraging. San
indicators in San Diego are continuing to improve. Diego’s demographics are favorable and will support
The local economy is benefitting from healthy tech future growth. The U.S. Census Bureau reports the
and R&D sectors. Furthermore, the long-term county’s population grew by 10% from 2000 to 2010.
6 CBRE North America Office Vacancy Index Q4, 2011
7 CBRE Research, Los Angeles
8,9 Moody’s Analytics
April 2012
Page 4
© 2012, CBRE
- 5. Western U.S. ViewPoint
Additionally, population growth is positive and education Salt Lake City
attainment in San Diego is above the average of cities Salt Lake continues to attract the attention of premier
profiled in this report.10 companies such as Adobe, eBay, Electronic Arts,
Goldman Sachs and Twitter. Notably, Goldman’s
San Diego experienced positive absorption over the last
office in Salt Lake City is now the firm’s second
nine consecutive quarters. During 2011, positive
largest in the Americas and projected to become its
absorption totaled 907,316 sq. ft. Consequently,
fourth-largest globally.11
vacancy fell from 19.1% at year-end 2010 to 16.6% at
year-end 2011. San Diego’s vacancy is 70 basis points Meanwhile, a developing tech corridor extending
below the regional average, but still 60 basis points from the southern portion of Salt Lake County along
above the national average. Market-wide average I-15 to northern Utah County is drawing the attention
asking lease rates increased almost 3% going from of reputable tech firms and spurring demand for
$24.24 per sq. ft. at year-end 2010 to $24.96 at the end office space. This trend will only be bolstered by
of 2011. startups from the University of Utah and Brigham
Young University (BYU). In 2011, The Association of
Western U.S. Average Lease Rates (FSG)
University Technology Managers ranked the
$45.00
University of Utah as number one in the U.S. for
$40.00
most tech startups, followed by MIT and BYU taking
$35.00 third place.
$30.00
Salt Lake benefits from a diverse economy, healthy
$25.00
demographics, and a low cost of doing business.
$20.00
Furthermore, prudent fiscal management allowed
$15.00
state and local governments to avoid painfully deep
San Francisco $38.40
Salt Lake City $19.12
Los Angeles $29.76
San Diego $24.96
spending cuts from being implemented as less-than-
Phoenix $20.75
$10.00
Seattle $28.13
$5.00 optimal revenues pushed governments elsewhere
$0.00 toward austerity.
Source: CBRE Research
BLS data shows Salt Lake experienced healthy job
With an encouraging economic outlook, absorption growth during 2011, well above the national average
is expected to remain positive through 2012. at 3.6% across all sectors. In office-related sectors,
Looking ahead, with healthy absorption rates, financial services grew at 2.7%, and professional and
vacancy will fall in the San Diego market as new business services at a brisk 5.2% during the same
supply remains restricted. Meanwhile, lease rates will period. Utah’s largest metro and capital city
remain stable due to ample supply. Overall, the maintain a young and educated workforce, which will
outlook for the near-term is stable, with healthier continue to attract employers. Furthermore, in-
growth rates returning over the medium-term. migration and high birth rates are demographic
advantages that will bolster long-term growth.12
10 CBRE Mapping Center
11 Bloomberg Businessweek: “Salt Lake City’s Lure”
12 Moody’s Analytics
April 2012
Page 5
© 2012, CBRE
- 6. Western U.S. ViewPoint
As a result of healthy job growth and improving 2012. Difficulties in housing and a sluggish labor
economic conditions, positive absorption totaled market are restraining consumption and subduing
652,381 sq. ft. during 2011. Positive absorption growth in the local economy.14
brought vacancy down from 17.1% at year-end
2010 to 15.3% at the end of 2011. Average asking Although Phoenix will experience a drag from
lease rates fell from $19.54 per sq. ft. in Q4 2010 to housing and the current employment picture is
$19.12 at year-end 2011. difficult, long-term prospects give reason to be
optimistic. The metro area’s low business costs and
Although positive absorption is expected to continue, young-educated workforce will enable future growth.
the rate of improvement in vacancy experienced Industries that will provide long-term growth include
during 2011 will not be maintained in 2012. professional and business services, healthcare,
Additional space from both new construction and renewable energy, and tech.15
large users moving to dedicated single-tenant office
buildings will heavily influence market indicators. As Western U.S. Historical Unemployment Rates
such, vacancy will stabilize on a market-wide basis 14.0%
and climb in select submarkets, particularly
12.0%
downtown. Lease rates are expected to remain
under pressure, but will trend toward stabilization, 10.0%
with isolated increases in areas as demand continues San Francisco
8.0% Los Angeles
to be somewhat subdued and new supply enters the San Diego
market. However, over the medium-term, market 6.0% Salt Lake City
Phoenix
dynamics will improve and allow for rental rate 4.0% Seattle
growth, absent any external shocks.
2.0%
Phoenix 0.0%
At year-end 2011, Phoenix registered the highest 2007 2008 2009 2010 2011
Source: Bureau of Labor Statistics
vacancy rate in the western United States.13 Overall,
office vacancy in Phoenix ranks third-highest in the Overall job growth in Phoenix was 1.5% during 2011
U.S. behind Detroit and Palm Beach County, according to the BLS. In office-using sectors,
respectively. However, the area’s office market is financial services experienced growth of 2.0%, while
recovering. professional and business services expanded by 1.1%
over the same period.
Phoenix is a market that maintains a tremendous
amount of potential, but continues to underperform. Absorption increased from 233,670 sq. ft. for 2010
Distress sales will continue to weigh on the metro to 1.9 million sq. ft. in 2011. Consequently, vacancy
area’s housing market and higher than average fell nearly one percentage point from 26.2% at year-
foreclosures will continue to push prices down in end 2010 to 25.5% at year-end 2011. However,
due to an over-abundant supply of office space,
13 CBRE North America Office Vacancy Index Q4, 2011
14, 15 Moody’s Analytics
April 2012
Page 6
© 2012, CBRE
- 7. Western U.S. ViewPoint
average asking lease rates went from $21.77 per sq. ft. As a market without major issues in residential real
at the end of 2010 to $20.75 at year-end 2011. estate and industries with high wages and continuing
growth potential, Seattle’s office market will
Looking ahead, due to improving local dynamics,
outperform national averages over the medium-term,
positive absorption is expected in 2012. As new
barring any major shocks to the economy.20 Due to
construction remains confined to one new 92,000-sq.-
a highly educated workforce and industries that will
ft. building in southeast Phoenix, restricted new supply
play an integral role in global economic growth, the
will allow vacancy to fall.16 Lease rates are stabilizing,
future for Washington’s largest metro gives much
both asking and effective as landlords are offering
reason for optimism through the medium-term.
fewer concessions. Although improving, a healthy
supply-demand dynamic will not return to Phoenix Growth in 2011 was primarily driven by tech
during the short-term. companies. Within the tech category, it is also worth
noting that Amazon is the largest tenant in the Seattle
market. Within the next six months, Amazon will
Seattle
occupy approximately 2.7 million sq. ft. in Seattle, up
Seattle is a city well-positioned for the 21st century. The
from 1 million sq. ft. just three years ago.
Seattle metro area boasts a concentration of aerospace
Underlying growth trends are less impressive;
and software companies that are able to compete in
however, with such explosive growth, Amazon is
and export to global markets. Boeing’s assembly lines
essentially turbo-charging market indicators in
will remain busy for years as U.S. airlines replace their
Seattle.21
aging fleets, emerging market demand increases and
fuel costs drive airlines toward newer, more efficient At 17.9%, Seattle’s office market vacancy is 60 basis
aircraft. Boeing’s impact is significant due to points higher than the western region average of
substantial economic multipliers associated with 17.3%. However, the market experienced positive
aerospace manufacturing.17 absorption over the last seven quarters. Positive
absorption for 2011 totaled just over 1.9 million sq.
In addition to aerospace, software companies are
ft., bringing vacancy rates down to 17.9% at year-
growing and returned to their prerecession employment
end 2011 from 19.1% at year-end 2010.
levels. 18 Of the six metro areas examined in this
report, Seattle metro maintains the highest level of Absorption is expected to remain positive and
college education attainment.19 Consequently, continue bringing vacancy down. Average asking
businesses are drawn to the area’s workforce. lease rates will begin to stabilize and remain stable,
with increases isolated to a few properties
According to BLS data, job growth across all sectors in
experiencing low vacancy. As 2012 progresses,
Seattle was 1.6% for 2011. Office-using sectors were
incremental increases in asking and effective rates
mixed, with financial services contracting by 1.9% and
can be expected.
professional and business services expanding by 2.1%,
offsetting weakness in financial services.
16 CBRE Research, Phoenix
17, 18, 20 Moody’s Analytics
19 CBRE Mapping Center
21 CBRE Research, Seattle
April 2012
Page 7
© 2012, CBRE
- 8. Western U.S. ViewPoint
Conclusion
When looking at current and expected performance in the western U.S., demographics, tech, and housing
are shaping the landscape. Metro areas with young and educated workforces attract modern industry, able
to compete in the global economy. Office demand will outperform national averages in such areas.
Overall, San Francisco, Salt Lake City, Phoenix and Seattle maintain the highest potential for above-trend
growth. Metro areas in Southern California, while improving, will struggle with less-favorable demographics
and an absence of concentrated industries able to drive growth in the near-term.
While conditions in each metro area will affect future performance, it is important to note external influences
as well. Rising fuel prices, driven by geo-political issues, particularly relating to Iran’s nuclear ambitions are
of great concern. Additionally, threats of contagion will plague the financial system as Europe’s sovereign
debt crisis grinds on. Domestically, fiscal and tax policy maintain the potential to adversely affect the U.S.
recovery as policymakers grapple with how to address expiring Bush tax cuts and automatic budget cuts.
Worst-case scenarios are not expected during the short-term, but external risks must be taken seriously and
need to be monitored. While recent economic data in the U.S. is encouraging and resilient, uncertainty will
continue to temper the outlook.
FOR MORE INFORMATION, PLEASE CONTACT:
Darin Mellott
Senior Research Analyst
801.869.8014
darin.mellott@cbre.com
Asieh Mansour, PhD.
Head of Research, Americas and
Senior Managing Director, Global Research
415.772.0258
asieh.mansour@cbre.com
Twitter: @AsiehMansourCRE
Data Disclaimer:
Unless otherwise noted, all market data provided by local CBRE research departments.
References to the San Francisco market are specific to the CBRE downtown office reporting area.
All references to absorption refer to net absorption.
Lease rates represented are annualized Full Service Gross (FSG).
© Copyright 2012 CBRE Statistics contained herein may represent a different data set than that used to generate
National Vacancy and Availability Index statistics published by CBRE Corporate Communications or CBRE’s research and
April 2012
econometric forecasting unit, CBRE Econometric Advisors. Information herein has been obtained from sources believed
reliable. While we do not doubt its accuracy, we have not verified it and make no guarantee, warranty or representation Page 8
about it. It is your responsibility to independently confirm its accuracy and completeness. Any projections, opinions,
assumptions or estimates used are for example only and do not represent the current or future performance of the market.
This information is designed exclusively for use by CBRE clients, and cannot be reproduced without prior written
permission of CBRE. © 2012, CBRE