1. 5.9%
6.9%
3.8%
3.7%
4.2%
1.2%
6.0%
3.9%
5.5%
0% 2% 4% 6% 8%
Sydney
Melbourne
Brisbane
Adelaide
Perth
Hobart
Darwin
Canberra
Combined capitals
12.8%
11.8%
4.0%
3.3%
-4.1%
1.1%
-4.2%
4.5%
8.7%
-10% -5% 0% 5% 10% 15%
Sydney
Melbourne
Brisbane
Adelaide
Perth
Hobart
Darwin
Canberra
Combined capitals
48.0%
31.5%
15.0%
10.9%
9.3%
6.3%
7.8%
9.4%
30.1%
0% 20% 40% 60%
Sydney
Melbourne
Brisbane
Adelaide
Perth
Hobart
Darwin
Canberra
Combined capitals
74.6%
60.8%
11.4%
13.0%
10.7%
-2.8%
21.0%
22.9%
46.8%
-20% 0% 20% 40% 60% 80% 100%
Sydney
Melbourne
Brisbane
Adelaide
Perth
Hobart
Darwin
Canberra
Combined capitals
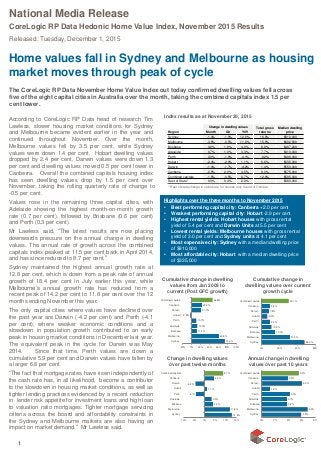
Region Month Qtr YOY
Sydney -1.4% -1.0% 12.8% 16.8% $810,000
Melbourne -3.5% -0.5% 11.8% 15.5% $602,500
Brisbane 0.6% 1.8% 4.0% 8.8% $467,200
Adelaide 0.7% 1.0% 3.3% 7.7% $410,000
Perth 0.3% -1.9% -4.1% -0.2% $499,000
Hobart -2.4% -2.9% 1.1% 6.6% $335,000
Darwin -1.3% -1.7% -4.2% 1.4% $550,000
Canberra -0.5% 2.0% 4.5% 9.0% $575,000
Combined capitals -1.5% -0.5% 8.7% 12.8% $595,000
Rest of State* 0.3% 0.4% 2.8% $380,000
Median dwelling
price
Change in dwelling values Total gross
returns
1
National Media Release
CoreLogic RP Data Hedonic Home Value Index, November 2015 Results
Released: Tuesday, December 1, 2015
Home values fall in Sydney and Melbourne as housing
market moves through peak of cycle
The CoreLogic RP Data November Home Value Index out today confirmed dwelling values fell across
five of the eight capital cities in Australia over the month, taking the combined capitals index 1.5 per
cent lower.
According to CoreLogic RP Data head of research Tim
Lawless, slower housing market conditions for Sydney
and Melbourne became evident earlier in the year and
continued throughout November. Over the month,
Melbourne values fell by 3.5 per cent, while Sydney
values were down 1.4 per cent. Hobart dwelling values
dropped by 2.4 per cent, Darwin values were down 1.3
per cent and dwelling values moved 0.5 per cent lower in
Canberra. Overall the combined capitals housing index
has seen dwelling values drop by 1.5 per cent over
November, taking the rolling quarterly rate of change to
-0.5 per cent.
Values rose in the remaining three capital cities, with
Adelaide showing the highest month-on-month growth
rate (0.7 per cent), followed by Brisbane (0.6 per cent)
and Perth (0.3 per cent).
Mr Lawless said, “The latest results are now placing
downwards pressure on the annual change in dwelling
values. The annual rate of growth across the combined
capitals index peaked at 11.5 per cent back in April 2014,
and has since reduced to 8.7 per cent.”
Sydney maintained the highest annual growth rate at
12.8 per cent, which is down from a peak rate of annual
growth of 18.4 per cent in July earlier this year, while
Melbourne’s annual growth rate has reduced from a
recent peak of 14.2 per cent to 11.8 per cent over the 12
months ending November this year.
The only capital cities where values have declined over
the past year are Darwin (-4.2 per cent) and Perth (-4.1
per cent), where weaker economic conditions and a
slowdown in population growth contributed to an early
peak in housing market conditions in December last year.
The equivalent peak in the cycle for Darwin was May
2014. Since that time, Perth values are down a
cumulative 5.9 per cent and Darwin values have fallen by
a larger 6.8 per cent.
“The fact that mortgage rates have risen independently of
the cash rate has, in all likelihood, become a contributor
to the slowdown in housing market conditions, as well as
tighter lending practices evidenced by a recent reduction
in lender risk appetite for investment loans and high loan
to valuation ratio mortgages. Tighter mortgage servicing
criteria across the board and affordability constraints in
the Sydney and Melbourne markets are also having an
impact on market demand.” Mr Lawless said.
Cumulative change in dwelling
values from Jan 2009 to
current (Post GFC growth)
Cumulative change in
dwelling values over current
growth cycle
Annual change in dwelling
values over past 10 years
Change in dwelling values
over past twelve months
Highlights over the three months to November 2015
• Best performing capital city: Canberra +2.0 per cent
• Weakest performing capital city: Hobart -2.9 per cent
• Highest rental yields: Hobart houses with gross rental
yield of 5.4 per cent and Darwin Units at 5.5 per cent
• Lowest rental yields: Melbourne houses with gross rental
yield of 3.0 per cent and Sydney units at 4.1 per cent
• Most expensive city: Sydney with a median dwelling price
of $810,000
• Most affordable city: Hobart with a median dwelling price
of $335,000
* Rest of state change in values are for houses only to end of October
Index results as at November 30, 2015
2. 4.1%
4.2%
5.3%
4.7%
4.4%
5.4%
5.5%
5.1%
4.3%
0% 2% 4% 6%
Sydney
Melbourne
Brisbane
Adelaide
Perth
Hobart
Darwin
Canberra
Combined
capitals
Gross rental yields, combined capital citiesAs a consequence of the tighter lending environment for
investors, as well as gross rental yields being at near
record lows, participation in the housing market from
investors has reduced from 54.1 per cent of all new
mortgages in May 2015 to 45.4 per cent at the end of
September, which is the lowest level since July 2013.
Data released by APRA at the end of last month showed
the pace of investment related housing credit growth fell
below the APRA 10 per cent speed limit for the first time
since September last year, with the monthly change in
investment credit growth the lowest since October 2011.
According to today’s results, the slowdown comes after
auction clearance rates have moderated back to the low
60 per cent range since the last week of October, whilst
average selling time and vendor discounting rates also
continue to rise from their record lows.
The 1.5 per cent decline in capital city dwelling values
over the month, coupled with a 0.3 per cent rise in
weekly rents, has seen the average gross yield record a
subtle improvement over the month. This follows a trend
towards lower rental yields which commenced in May
2013. Gross yields remain close to record lows for
houses in Melbourne at an average of 3.0 per cent, while
Sydney has overtaken Melbourne to show the lowest
yield profile across the capital city unit markets, with an
average gross rental yield of 4.1 per cent.
2
Gross rental yields, houses and units
Houses Units
Mr Lawless said, “Slower housing market conditions will likely be a topic of conversation when the Reserve Bank
board meets today to deliberate on the cash rate setting. A less buoyant housing market is likely to provide the
Reserve Bank with a greater degree of flexibility in adjusting interest rates without as much risk of overstimulating
the housing market.”
“While the Reserve Bank is likely to welcome a slowdown in the rate of home value appreciation, the overriding
objective would be to avoid a significant downturn in the housing market, which would act as a weight on
economic growth and potentially impact financial system stability.”
“With the housing market moving through the peak of the cycle at a time when there is a large number of new
dwellings commencing construction, there is likely to be a heightened level of settlement risk for off the plan
purchases.”
“Those purchasers who have recently purchased off-the-plan may face challenges at the time of settlement if the
valuation of the property is lower than the contracted price, or if mortgage finance is less freely available, or on
more expensive terms. This would imply that some buyers may have a higher loan to valuation ratio than
anticipated, which could require additional funds to bring the LVR down to a level the lender is comfortable with.”
“As a result of slowing housing market conditions, an additional risk for policymakers is where a large number of
dwellings approved for construction are postponed or withdrawn as developers face fewer presales or lose
confidence in their ability to deliver a profitable project to market,” Mr Lawless said.
Media inquiries contact: CoreLogic national communications manager – 07 3114 9879 or media@corelogic.com.au
About CoreLogic RP Data
CoreLogic RP Data is a wholly owned subsidiary of CoreLogic (NYSE: CLGX),which is the largest property data and analytics company in the
world. CoreLogic RP Data provides property information, analytics and services across Australia and New Zealand and is currently developing
and growing partnerships throughout Asia. With Australia’s most comprehensive property databases, the company’s combined data offering is
derived from public, contributory and proprietary sources and includes over 500 million decision points spanning over three decades of collection,
providing detailed coverage of property and other encumbrances such as tenancy, location, hazard risk and related performance information.
With over 11,000 customers and 120,000 end users, CoreLogic RP Data is the leading provider of property data, analytics and related services to
consumers, investors, real estate, mortgage, finance, banking, insurance, developers, wealth management and government. CoreLogic RP Data
delivers value to clients through unique data, analytics, workflow technology, advisory and geo spatial services. Clients rely on CoreLogic RP
Data to help identify and manage growth opportunities, improve performance and mitigate risk. CoreLogic RP Data employs over 480 people at
nine locations across Australia and in New Zealand. For more information call 1300 734 318 or visit www.corelogic.com.au
National Media Release cont’d
CoreLogic RP Data Hedonic Home Value Index Results
Houses Units
3.2%
3.0%
4.3%
4.1%
3.9%
5.4%
5.3%
4.1%
3.4%
0% 2% 4% 6%
Sydney
Melbourne
Brisbane
Adelaide
Perth
Hobart
Darwin
Canberra
Combined
capitals
3. Capital Growth to 30 November 2015 Sydney Melbourne
Brisbane -
Gold Coast Adelaide Perth
Australia 5
Capitals
(ASX) Hobart Darwin Canberra Brisbane
Australia
8 Capitals
Table 1A: All Dwellings
Month -1.4% -3.5% 0.4% 0.7% 0.3% -1.5% -2.4% -1.3% -0.5% 0.6% -1.5%
Quarter -1.0% -0.5% 1.4% 1.0% -1.9% -0.5% -2.9% -1.7% 2.0% 1.8% -0.5%
Year-to-Date 12.8% 10.1% 3.7% 1.4% -5.9% 7.9% -1.5% -3.7% 5.2% 3.2% 7.8%
Year-on-Year 12.8% 11.8% 4.5% 3.3% -4.1% 8.9% 1.1% -4.2% 4.5% 4.0% 8.7%
Total Return Year-on-Year 16.8% 15.5% 9.3% 7.7% -0.2% 13.0% 6.6% 1.4% 9.0% 8.8% 12.8%
Median price* based on settled sales over quarter $810,000 $602,500 $470,000 $410,000 $499,000 $593,000 $335,000 $550,000 $575,000 $467,200 $595,000
Table 1B: Houses
Month -1.5% -3.6% 0.5% 0.7% 0.4% -1.6% -2.4% -3.6% -0.5% 0.7% -1.6%
Quarter -1.4% -0.4% 1.6% 1.1% -2.1% -0.6% -3.3% -1.0% 2.4% 1.9% -0.6%
Year-to-Date 13.2% 10.9% 3.8% 1.4% -6.1% 8.1% -2.0% -3.0% 5.6% 3.3% 7.9%
Year-on-Year 13.2% 12.9% 4.8% 3.4% -4.2% 9.2% 0.5% -3.8% 5.0% 4.4% 9.1%
Total Return Year-on-Year 17.0% 16.5% 9.6% 7.8% -0.3% 13.2% 6.0% 1.9% 9.4% 9.1% 13.0%
Median price* based on settled sales over quarter $950,000 $675,000 $512,000 $435,000 $515,000 $630,000 $355,000 $575,000 $625,000 $495,000 $626,000
Table 1C: Units
Month -0.7% -2.0% -0.1% 0.2% -0.5% -0.9% -2.4% 10.6% -0.9% -0.4% -0.9%
Quarter 0.6% -0.9% -0.3% -0.2% 0.0% 0.1% 1.7% -4.8% -3.0% 0.6% 0.1%
Year-to-Date 11.1% 3.4% 2.4% 1.8% -3.4% 7.0% 3.6% -6.4% -0.5% 2.4% 7.0%
Year-on-Year 11.1% 2.9% 1.3% 2.3% -3.6% 6.8% 7.2% -6.1% -1.1% -0.3% 6.6%
Total Return Year-on-Year 16.0% 7.3% 6.9% 7.3% 0.9% 11.6% 13.2% -0.5% 4.0% 5.2% 11.4%
Median price* based on settled sales over quarter $675,000 $503,500 $385,000 $342,000 $415,000 $517,200 $291,500 $511,000 $422,500 $400,000 $525,000
Table 1D: Rental Yield Results
Houses 3.2% 3.0% 4.3% 4.1% 3.9% 3.4% 5.4% 5.3% 4.1% 4.3% 3.4%
Units 4.1% 4.2% 5.4% 4.7% 4.4% 4.3% 5.4% 5.5% 5.1% 5.3% 4.3%
3
The indices in grey shading have been designed for trading environments in partnership with the Australian Securities Exchange
(www.asx.com.au). Indices under blue shading (Hobart, Darwin, Canberra, Brisbane and the 8 capital city aggregate) are calculated under the
same methodology however are not currently planned to be part of the trading environment.
*The median price is the middle price of all settled sales over the three months to the end of the final month. Median prices are provided as an
indicator of what price a typical home sold for over the most recent quarter. The median price has no direct relationship with the CoreLogic RP
Data Hedonic Index value. The change in the Index value over time reflects the underlying capital growth rates generated by residential property
in the relevant region.
The CoreLogic RP Data Hedonic Index growth rates are not ordinarily influenced by capital expenditure on homes, compositional changes in the
types of properties being transacted, or variations in the type and quality of new homes manufactured over time. The CoreLogic RP Data ‘index
values’ are not, therefore, the same as the ‘median price’ sold during a given period. See the methodology below for further details.
Methodology: The CoreLogic RP Data Hedonic Home Value Index is calculated using a hedonic regression methodology that addresses the
issue of compositional bias associated with median price and other measures. In simple terms, the index is calculated using recent sales data
combined with information about the attributes of individual properties such as the number of bedrooms and bathrooms, land area and
geographical context of the dwelling. By separating each property comprising the index into its various formational and locational attributes,
differing observed sales values for each property can be separated into those associated with varying attributes and those resulting from changes
in the underlying residential property market. Also, by understanding the value associated with each attribute of a given property, this
methodology can be used to estimate the value of dwellings with known characteristics for which there is no recent sales price by observing the
characteristics and sales prices of other dwellings which have recently transacted. It then follows that changes in the market value of the stock of
residential property comprising an index can be accurately tracked through time. RP Data owns and maintains Australia's largest property related
database in Australia which includes transaction data for every home sale within every state and territory. CoreLogic RP Data augments this data
with recent sales advice from real estate industry professionals, listings information and attribute data collected from a variety of sources. For
detailed methodological information please visit www.corelogic.com.au
For more information on the CoreLogic RP Data Indices, please go to http://www.corelogic.com.au
Media enquiries contact: Mitch Koper , CoreLogic RP Data national communications manager – 07 3114 9879 or media@corelogic.com.au
Introduction to the CoreLogic RP Data Daily Hedonic Home Value Index methodology:
The CoreLogic RP Data Hedonic Home Value Index is calculated using a hedonic regression methodology that addresses the issue of
compositional bias associated with median price and other measures. In simple terms, the index is calculated using recent sales data combined
with information about the attributes of individual properties such as the number of bedrooms and bathrooms, land area and geographical context
of the dwelling. By separating each property comprising the index into its various formational and locational attributes, differing observed sales
values for each property can be separated into those associated with varying attributes and those resulting from changes in the underlying
residential property market. Also, by understanding the value associated with each attribute of a given property, this methodology can be used to
estimate the value of dwellings with known characteristics for which there is no recent sales price by observing the characteristics and sales
prices of other dwellings which have recently transacted. It then follows that changes in the market value of the stock of residential property
comprising an index can be accurately tracked through time. CoreLogic owns and maintains Australia's largest property related database in
Australia which includes transaction data for every home sale within every state and territory. CoreLogic augments this data with recent sales
advice from real estate industry professionals, listings information and attributes data collected from a variety of sources. For detailed
methodological information please visit www.corelogic.com.au.
CoreLogic RP Data Home Value Index tables
National Media Release cont’d